


Gold (XAU) price rebounds from the strong support of $4,100 after the sharp selloff this week. The spot gold price has recovered to $4,500 and is looking for next direction. However, the bigger picture still indicates price pressure in the short term. In my opinion, gold is entering a stabilization period where high yields, a strong dollar and continued geopolitical tensions are driving markets. This article outlines the key macro drivers, precious metals performance and signals coming from related markets which will determine next move in gold.
Macro Drivers – War, Inflation, and Fed Policy Shape Gold’s Direction
Dip Buying Emerges as Gold Rebounds from Key Support
Gold recovered on Friday after hitting the major support zone of $4,100. Spot gold increased 2.6% to close at $4493.68 and hit an intraday high of $4555.63.
Gold price hits four-month low at $4099, which brought prices to the 200-day SMA. This drop stimulated heavy dip buying. Despite this strong reversal from the $4099, the rebound is the result of short covering and bargain hunting and not a complete change of trend.
War, Inflation, and Hawkish Fed Limit Gold’s Upside
The U.S.-Iran war is a major driver of uncertainty in precious metals sector. The conflict has now reached its fourth week and is spreading throughout the region. Energy markets are under pressure.
Brent Oil (BCO) prices are surging above $110 per barrel. Supply risks are still high as Iran has not agreed to reopen the Strait of Hormuz. This keeps the supply in the world tight.
Gold Price Forecast
Every new Gold analysis as it publishes, today's technical signal and key levels, live price — on one page.
See all Gold forecastsIncreasing oil prices are feeding inflation fears. Fertilizer and energy are getting more expensive. This is hitting the global economy and keeping the uncertainty high.
Gold benefits from this environment. But this time, inflation is forcing central banks to remain hawkish. That is putting a ceiling on gold’s upside in the short term.
Moreover political tensions in the U.S. are also increasing. The recent “No Kings” movement reflects general increase in public dissatisfaction and institutional pressure. This further adds to the overall environment of uncertainty. Investors currently have to contend with geopolitical conflict overseas and political friction at home.
This combination supports safe-haven demand. However, in the current cycle, that demand is being made up for by higher yields and a strong dollar.
The outlook of the Federal Reserve has changed dramatically. Rising inflation has driven up expectations of rate hikes. At the moment, market does not expect any rate cuts in 2026 as per the Fed Watch tool. This scenario has put pressure on gold.

Before the US-Iran war, the market expected two cuts. That change has strengthened US dollar and pushed yields higher.
Precious Metals Breakdown – Why Gold Held While Others Fell Sharply
After the US-Iran war started on 28 Feb 2026 all precious metals started moving lower. This indicates that conflict did not result in continued safe-haven rally across the sector. Gold fared relatively better than the rest and had the smallest decline which shows its defensive nature.
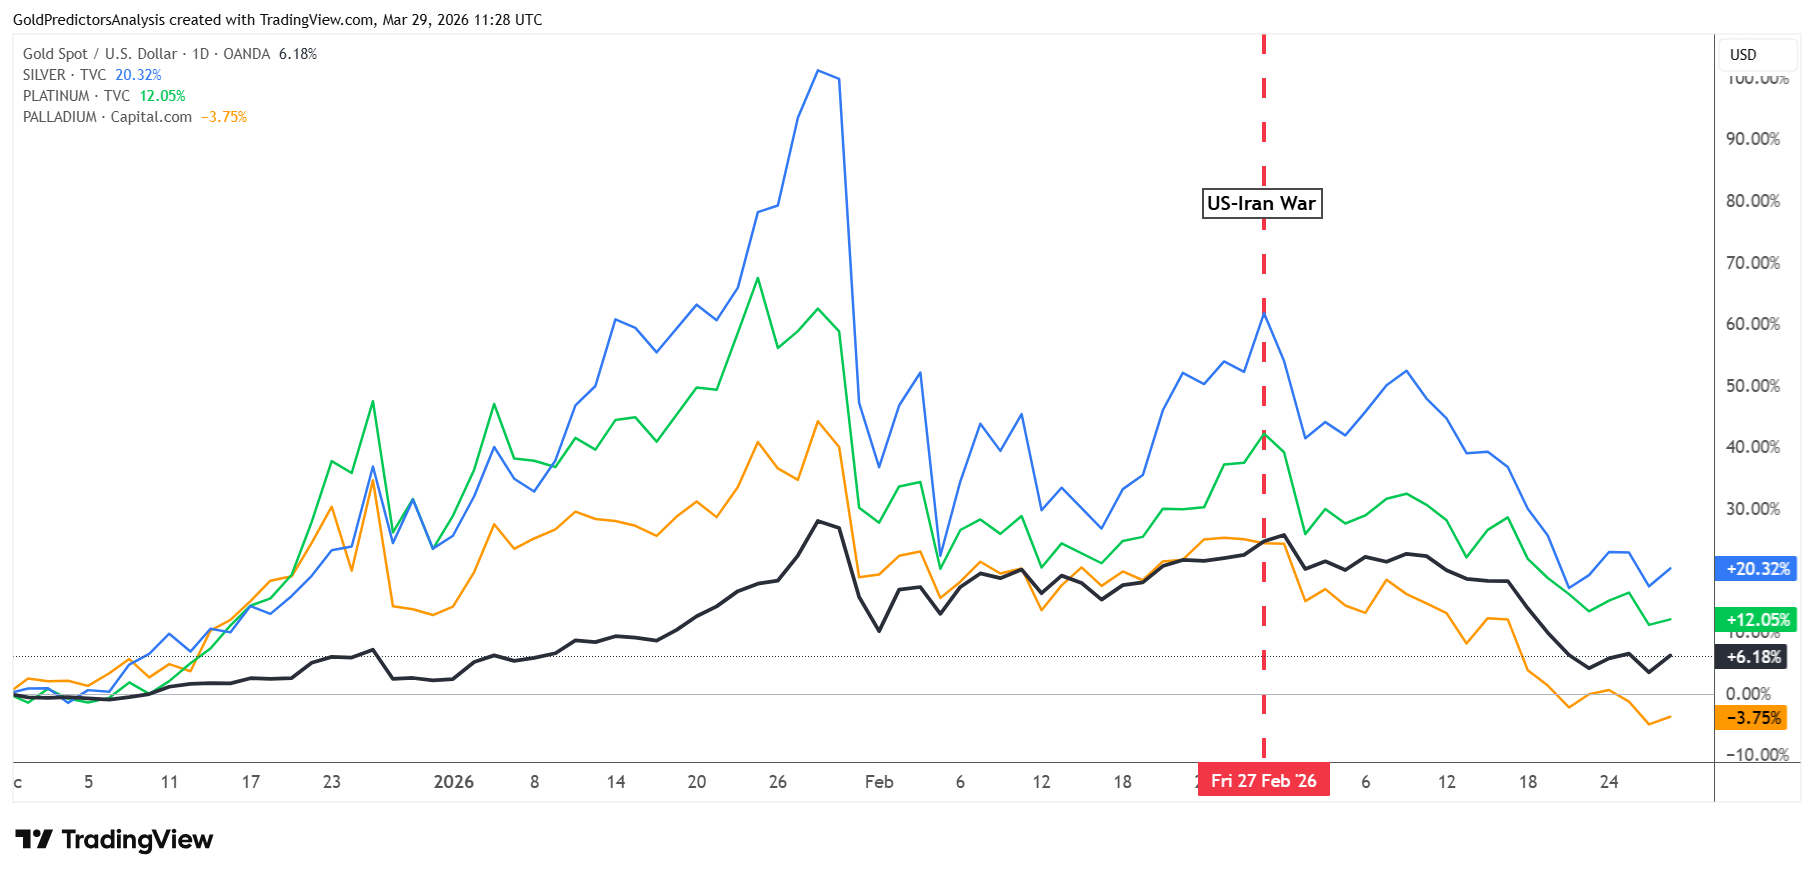
Silver (XAG) and platinum (XPL) rose in the beginning, but the strength was short-lived. Both metals subsequently turned around and fell under selling pressure. Palladium remained the weakest and continued to go lower without any strong recovery.
Overall, it is clear by looking at the chart that geopolitical tensions were not enough to prop up prices, as stronger dollar, higher yields and broad market selling brought the whole metals complex lower.
The chart below shows that the gold price has dropped 15.56% since the war started. This drop made it the least volatile metal in the group. On the other hand, platinum fell by 19.50%, silver by 21.87% and palladium by the highest percentage of 22.58%.
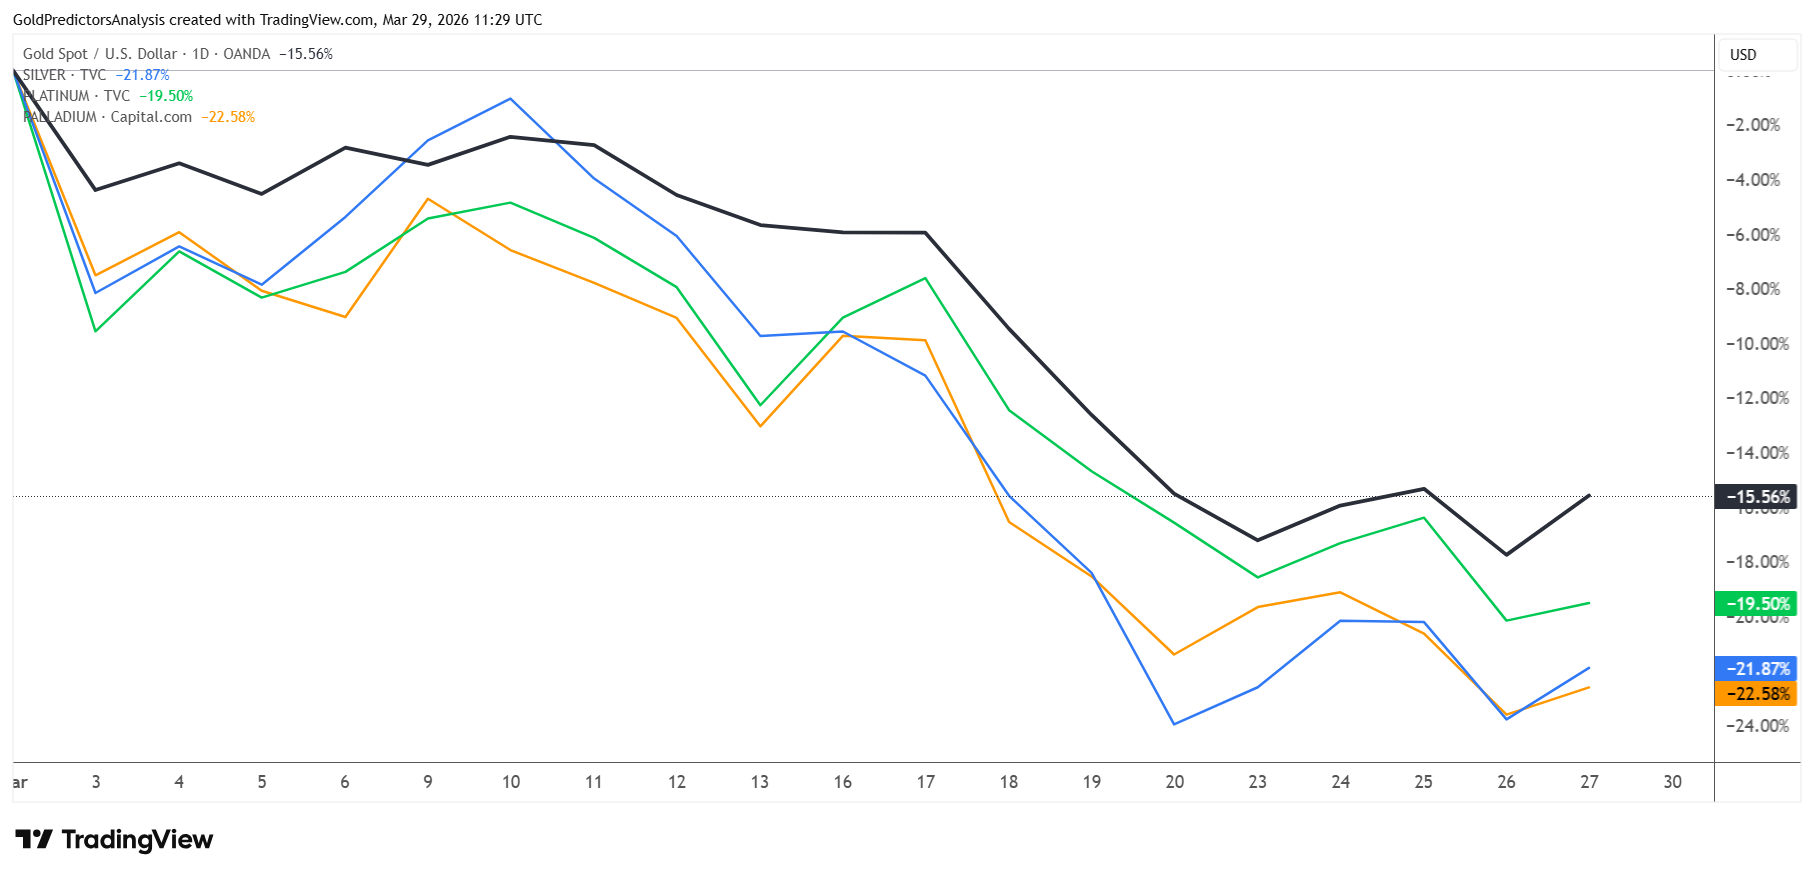
It shows that investors did not rush into the whole precious metals space for safety.
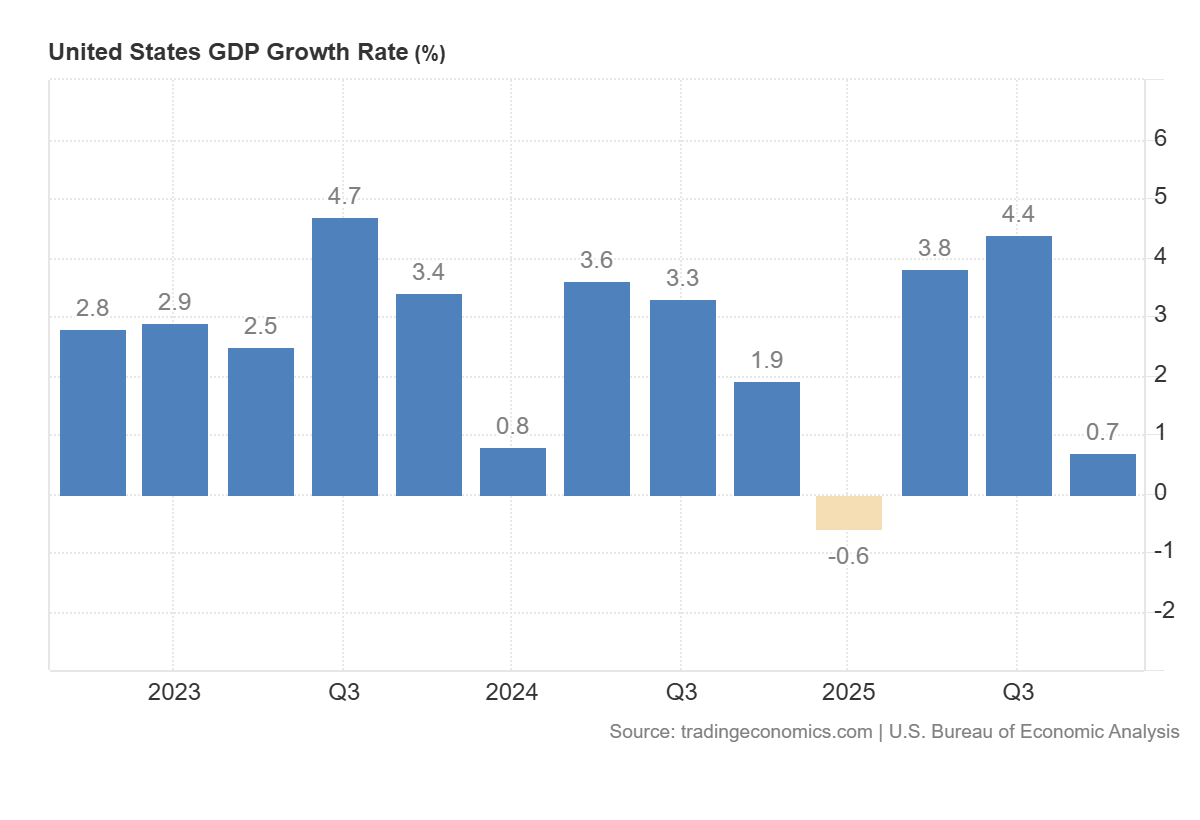
Silver and palladium experienced greater pressure due to the fact that they are more sensitive to expectations of growth and general market sentiment. The US growth is already slowing as per the latest data. The ongoing crisis will further slow growth and impact the silver prices.
Platinum also dropped but not as much as silver or palladium (XPD). This drop in precious metals was due to the rising yields, stronger dollar and forced liquidation.
Related Markets – Miners, Dollar, and Financial Conditions
Gold Miners and Financial Conditions Signal Weak Sentiment
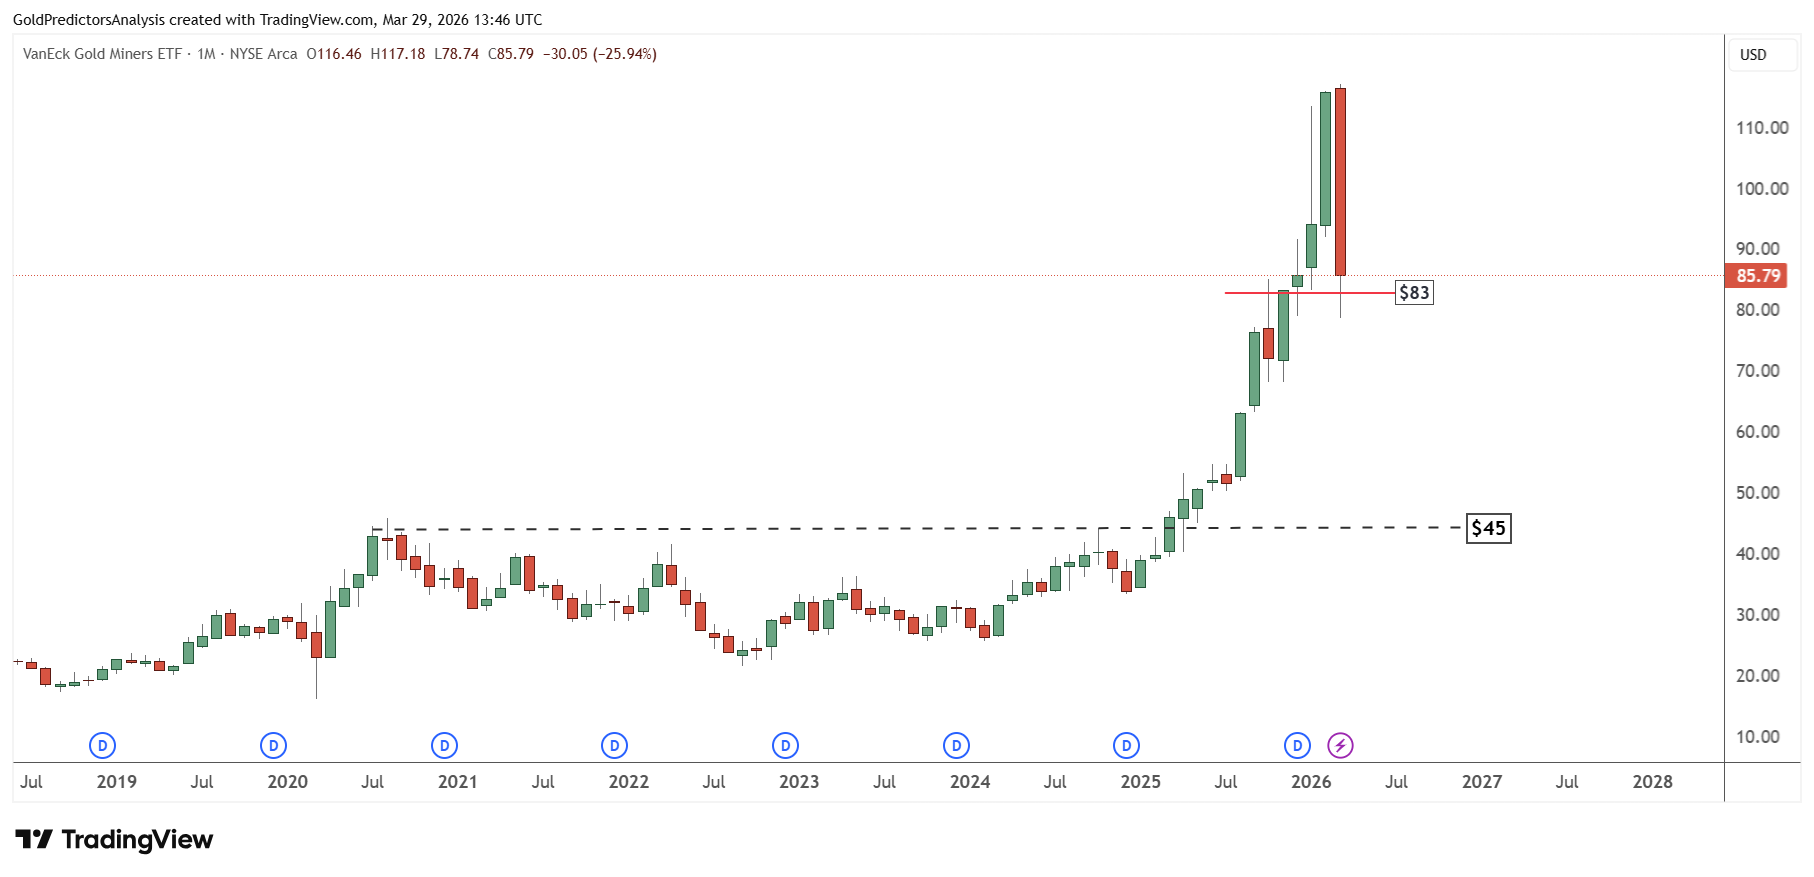
Gold mining stocks dropped more than gold. Miners have operational leverage. When gold is falling, their margins compress more quickly. Many of the mining stocks fell off sharply which indicates institutional rotation out of the sector.
The chart for VanEck Gold Miners ETF (GDX) shows that the drop in March hits near the December 2025 lows which has been the strong support zone around $80-$85. A strong recovery is underway after hitting this support and the market is still looking for new headlines from the geopolitical news.
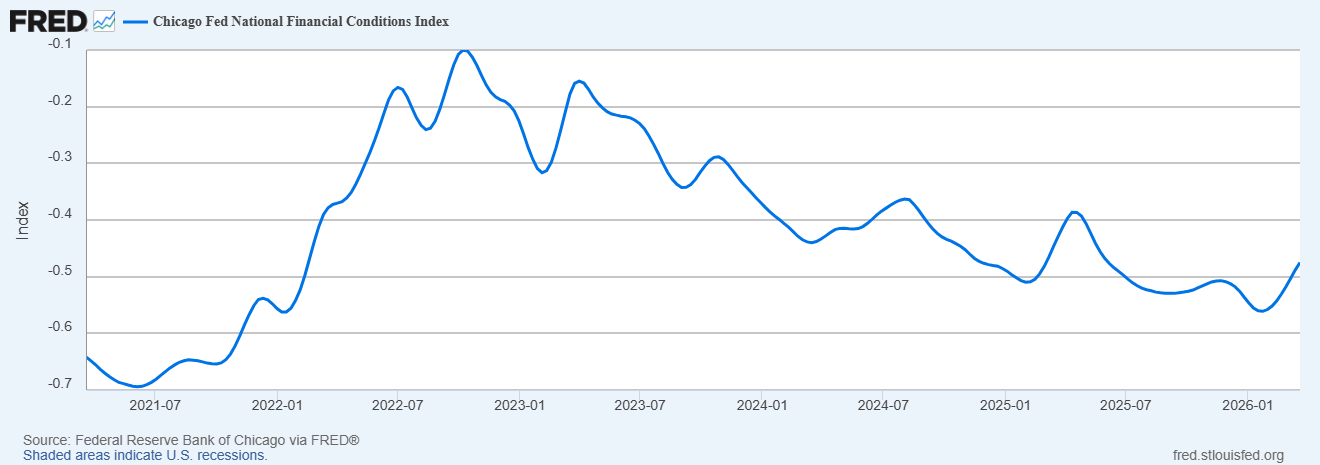
On the other hand, the Chicago Fed National Financial Conditions Index is at -0.475 as of March 20. A move above -0.40 would confirm a stronger risk off signal.
Historical Capital Rotation Favors Gold in Market Stress
The chart below shows the S&P 500 to gold ratio, which indicates capital rotation into gold during times of great economic and financial stress. Each of the marked cycles, including 1931, 1970 and 2002, has a similar structure. Markets are trending higher for a period of time, then they lose momentum and break down below trend support.
Once that breakdown occurs, this capital begins to flow away from risk assets and move into gold. The highlighted areas show the places where this transition begins. These moments have followed long rallies when valuations have been stretched and macro risks begin to rise.
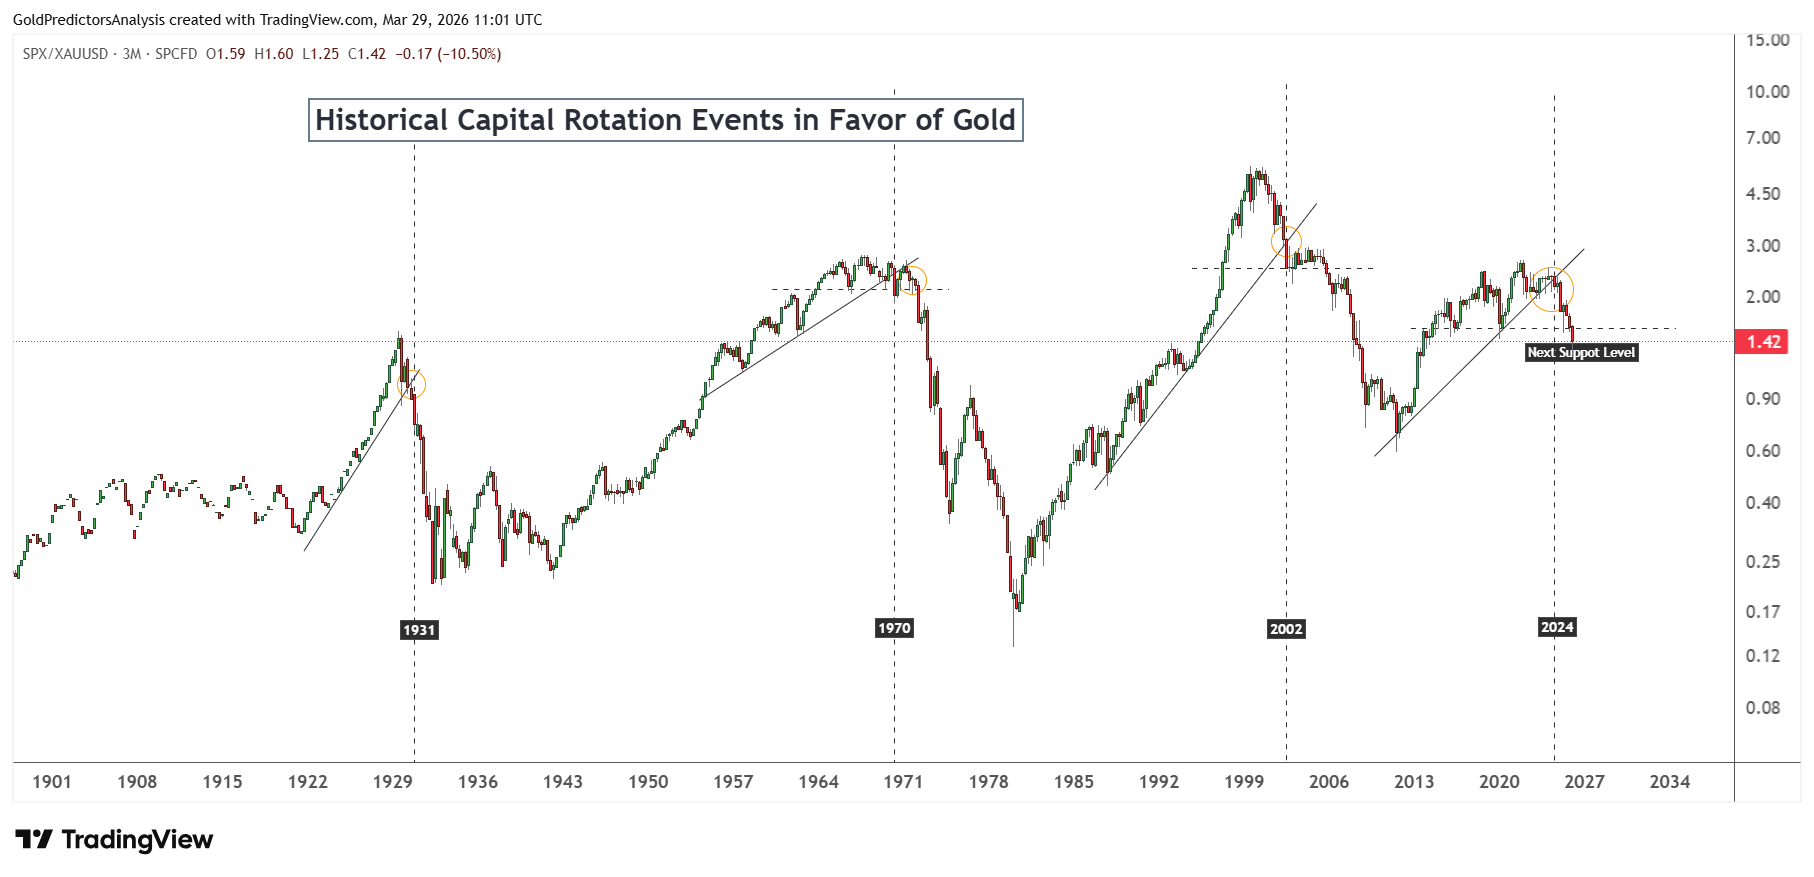
The current setup in 2024 appears to be similar to past cycles. The market tested an important rising trendline. The chart confirms that this pattern was broken which points towards further downside risk in the ratio.
If this pattern follows history, there could be deeper correction in equities that will cause another big rotation into gold. The overvaluation measures of S&P 500 and the current energy crisis which are impacting the global stock market, are highlighting the similar situation where the capital rotation will finally flow into gold.
Market Risks
The greatest risk for gold is the Federal Reserve remaining hawkish for longer. Rising inflation is continuing to help prop up higher yields and a stronger dollar.
On the other hand, if oil prices remain above $110 and inflation remains high, rate cuts may remain off the table for longer than expected. This may prevent any sustained upside. At the same time, if geopolitical tensions ease, safe haven demand may weaken more and cause another wave of selling.
Another important risk is from the wider market conditions and investor positioning. The recent rise in gold’s price is still due to short covering and dip buying and not strong long term demand. If risk assets stabilize or recover, then capital may continue to flow away from gold.
Mining stocks are already facing weak sentiment which indicates a lack of institutional support. In addition, further liquidation in commodities or a better equity market could postpone any recovery in gold. This means that market may continue to be volatile and downside risks are still present in the near term.
In Closing – Stabilization Phase Before Next Move
Gold is showing early signs of stabilization after a sharp correction. The strong bounce off the $4,100 area is highlighting that buyers are still in the game at lower levels. However, the current recovery is not yet underpinned by strong fundamentals. The market is still under pressure from higher yields, a strong dollar and hawkish Federal Reserve. As long as these factors are in place it is likely that any upside in gold is likely to be limited in the short term.
At the same time, the bigger picture still favors gold in the long term. Historical patterns indicate that capital will rotate into gold under periods of economic stress and market weakness. The present arrangement in equities and across the world markets indicates the rotation into gold. If risk assets weaken, gold could find strength and move higher. Until then, the market is likely to remain volatile, with gold trading in a stabilization phase prior to the next major move. This stabilization phase might be the $4,000-$4,500 where prices may consolidate before moving to $5,000. This consolidation may confirm a bottoming process in gold if $4,000 holds.
If you’d like to know more about how to trade gold and silver, please visit our educational area.