



Gold (XAU) prices rebounded from the $4,500 region after hitting their lowest level in more than a month. The move toward $4,750 shows that buyers remain active. But the peace talks between the U.S. and Iran, dollar weakness and Fed uncertainty continue to shape the next direction. In my view, gold remains within bullish structure if the price holds above $4,400. This article provides an analysis of the key macro drivers, technical levels and related market signals that may define the next major move in gold.
Macro Drivers: Gold Rebounds as Peace Talks Weaken Dollar Pressure
US-Iran Peace Hopes Lift Gold but Keep Traders Cautious
After hitting its lowest price point in over a month, gold has rallied sharply from $4,500. The positive shift in gold has taken the price to the $4,750 region, after three days of recovery. The bounce indicates that the buyers are still active despite the high energy crisis during the past 2 months.
The most important driver of the gold price is the US-Iran peace prospects. President Trump indicated that the negotiations have advanced and that he thinks an agreement with Iran is feasible. It was also reported that the two sides were about to ink a deal. This news has made the US dollar weaker. A soft dollar is a positive for gold as it makes gold more affordable for foreign buyers.
But the prospects for peace are uncertain. Iranian state controlled media pushed back against the claims of broader agreement. Tehran is also looking at a memorandum which could ease the closure of the Strait of Hormuz and the blockade of Iranian ports by the Americans in stages. Meanwhile, Trump said that Iran may be subjected to more escalation if they do not accept the deal. These mixed signals have traders on their toes. If peace deal can be negotiated, it may take geopolitical fear out of gold. But if that fails to materialize, it can return the safe-haven demand to gold very quickly.
Fed Uncertainty and Jobs Data Limit Gold’s Upside
The Federal Reserve projection is also important. The employment in the private sector jumped 109,000 in April after a downward revision to 61,000 in March, according to the US ADP report. This implies that the labour market is still tight. The employers are hiring. A tight job market can keep inflation pressures alive and limit the potential for a quick Fed cut. That puts a cap on the upside prospects for gold.
Gold Price Forecast
Every new Gold analysis as it publishes, today's technical signal and key levels, live price — on one page.
See all Gold forecasts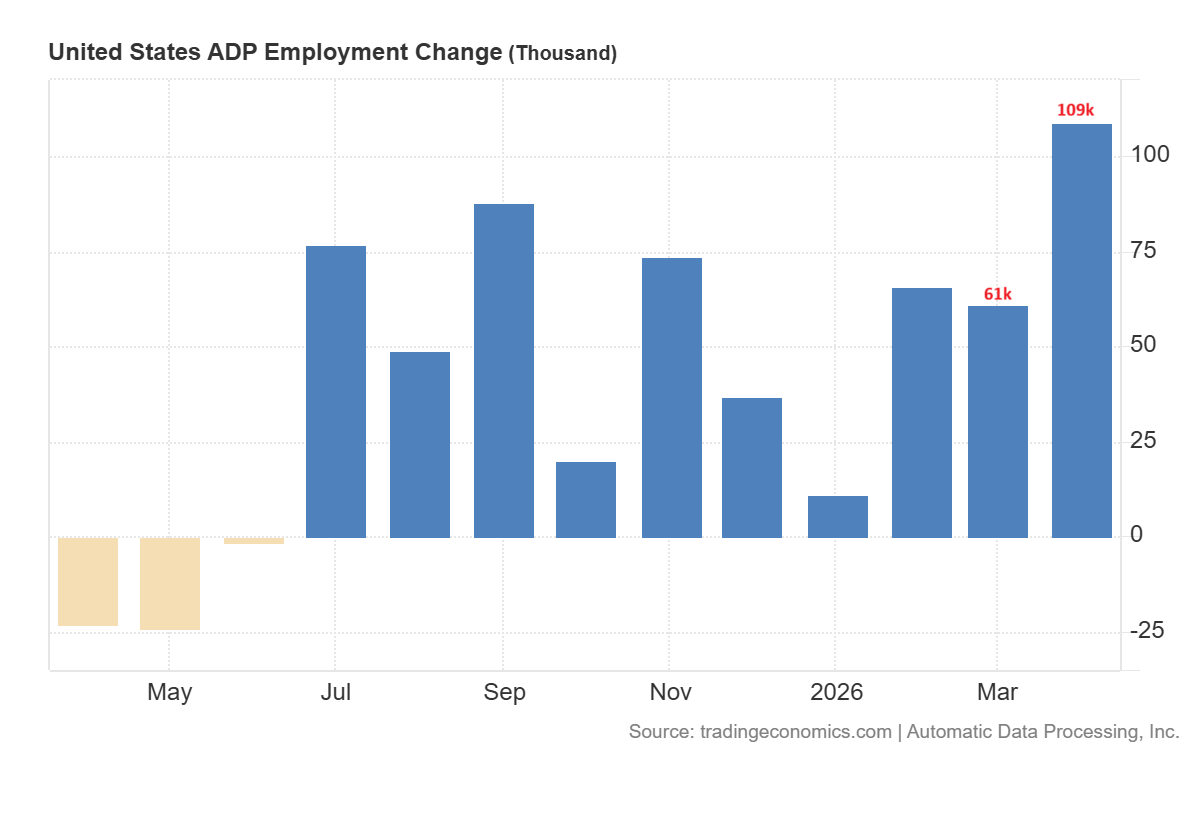
Dollar weakness and waning hawkish Fed sentiment are currently propping up gold. But the market is still uncertain as traders are waiting for US-Iran deal news and new US labour data. Jobless claims, Fed speeches and the Nonfarm Payrolls report will likely lead the next step in the gold and silver prices. Gold has a chance to continue its bounce if the data weakens and the dollar doesn’t rally. However, if the situation improves with data, it could dampen the rally in the short run.
Gold Technical Analysis: Bullish Structure Points to $6,000 Target
Long-Term Gold Trend Holds Above Key Channel Support
The gold price has been trading within a bullish trend since the 2024 breakout. This bullish trend is defined by the ascending channel pattern that was broken in September 2025. After the breakout from the ascending channel, the price reached a high of $5,600 by forming the extension line above the channel.
The sharp drop from $5,600 to form a low at $4,100 in March 2026 has sustained the strong bullish trend. Now, the price is trending higher from the support of the ascending channel pattern, which indicates a sustained move higher as long as $4,400 remains the key support.
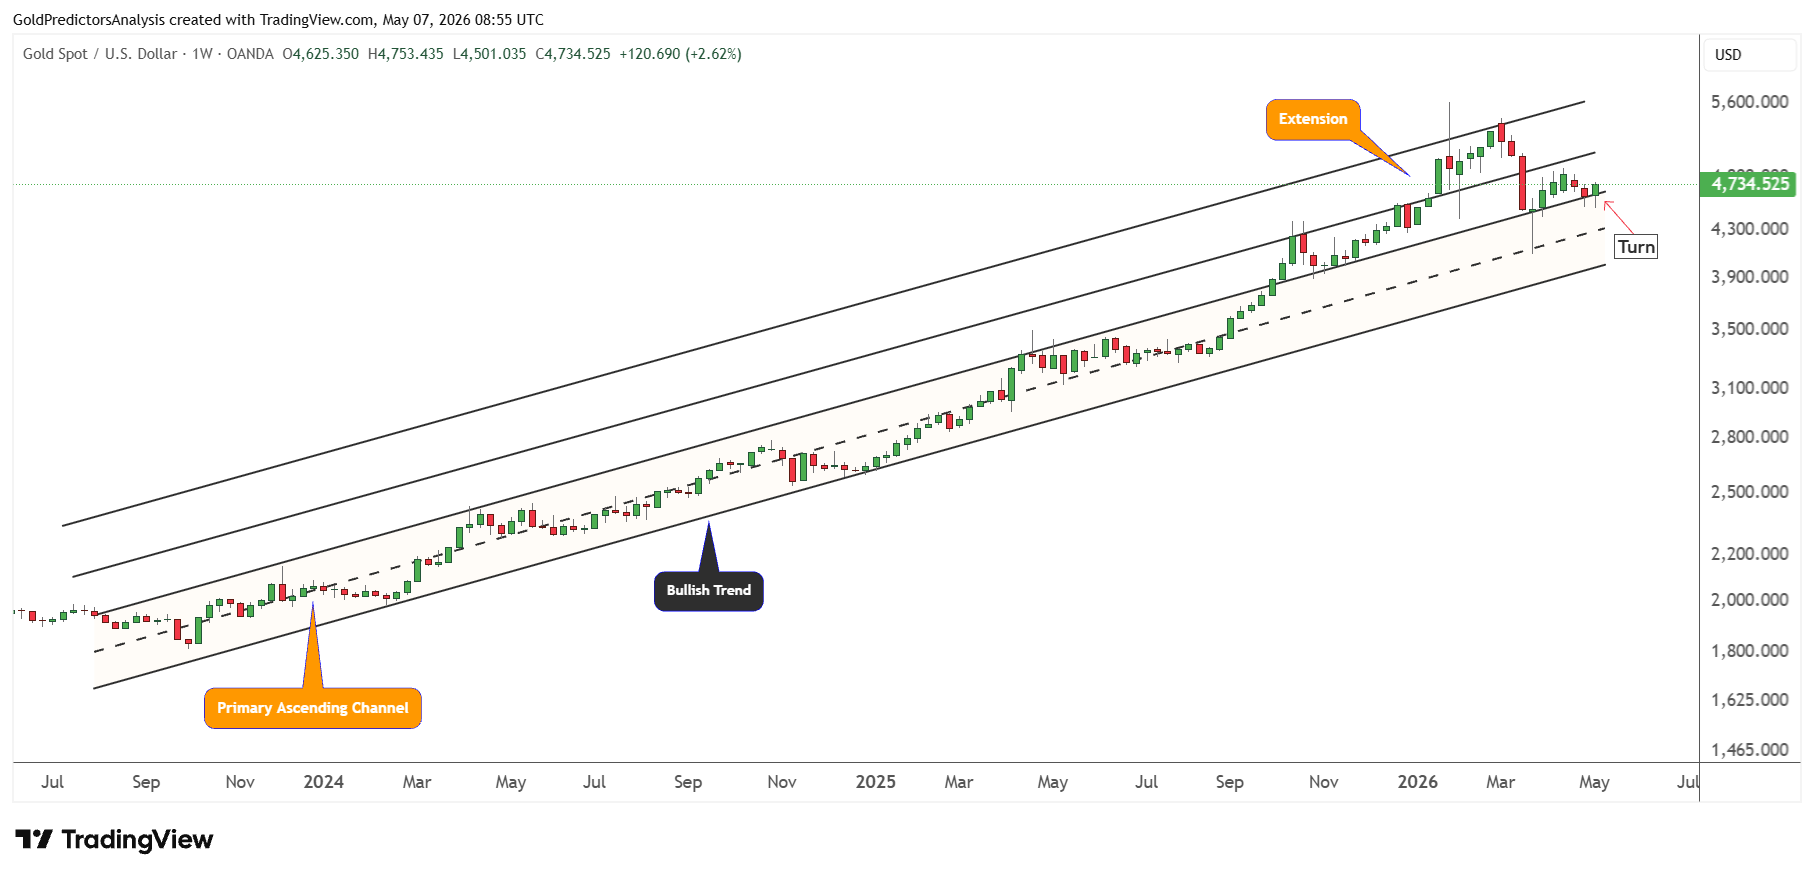
The turn higher in the gold market due to peace optimism between the US and Iran suggests that the immediate resistance will likely be the $5,000 area, which is defined by the ascending channel trend line.
A break above $5,000 will open the door for another rally towards the $6,000 area, which is the resistance of the extension of the ascending channel pattern.
The strong bullish trend in the gold market with heavy volatility is also observed using the ascending broadening wedge pattern that is formed from the lows of June 2024 to the highs of January 2026.
The emergence of the ascending broadening wedge pattern indicates heavy volatility. The immediate trend from the lows of December 2024 also remains strong and is defined by the blue dotted trend line in the chart below.
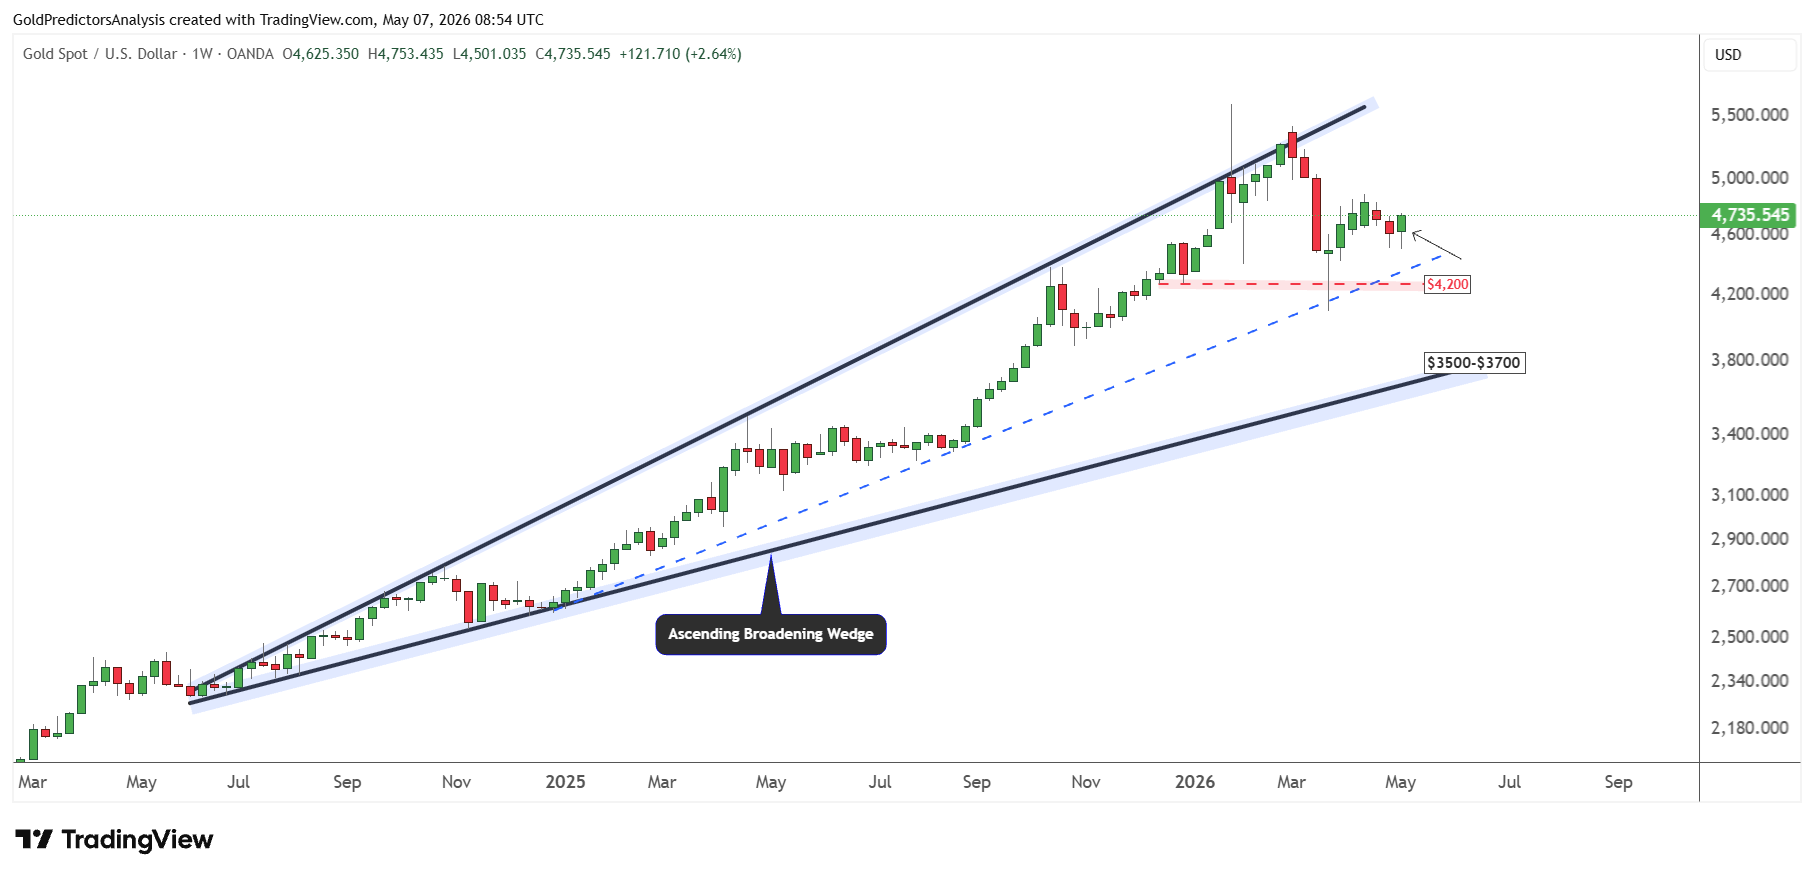
The price is turning higher and will mark a weekly reversal candle if it closes above $4,700 this week. This reversal will indicate a strong and sustained move towards $6,000.
However, before moving higher, the gold price may remain in the consolidation zone above $4,500. As long as the $3,500-$3,700 long-term support zone holds, the price structure for gold remains strongly bullish.
Short-Term Triangle Setup Builds Breakout Pressure
The short-term price structure for the gold price also remains strongly bullish, as defined by the triangle pattern. This triangle is formed from the October 2025 lows towards the January 2026 highs. The rejection of the price at the 50-day SMA at $4,891 on 17 April 2026 has formed a bottom on 4 May 2026 at the $4,500 region, which is defined by the support of the triangle pattern.
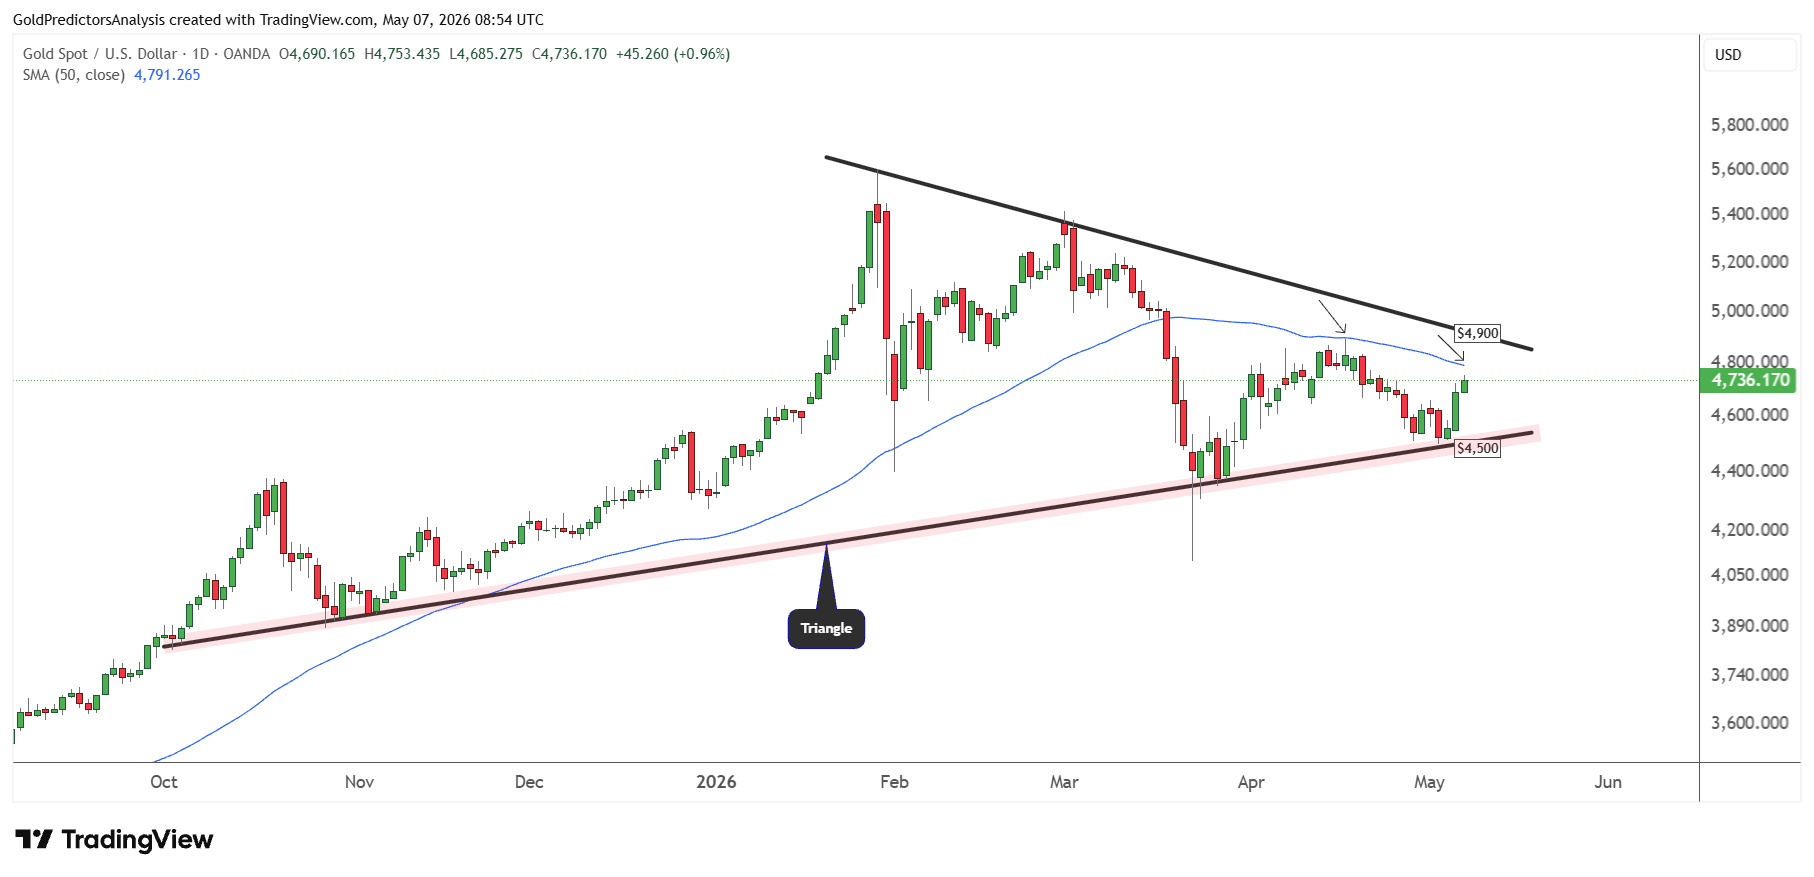
The price is now rebounding towards the 50-day SMA at $4,800. Next, a break above the $4,800 area, and then the break above $4,900 will break the triangle pattern and indicate further upside towards $5,600.
Moreover, the breakout from $5,000 will also confirm the double bottom pattern with the lows formed at the $4,400 and $4,500 regions within this triangle.
Related Markets: Silver Strength Confirms the Precious Metals Bull Market
Ratio Breakdown Signals a Trend Shift
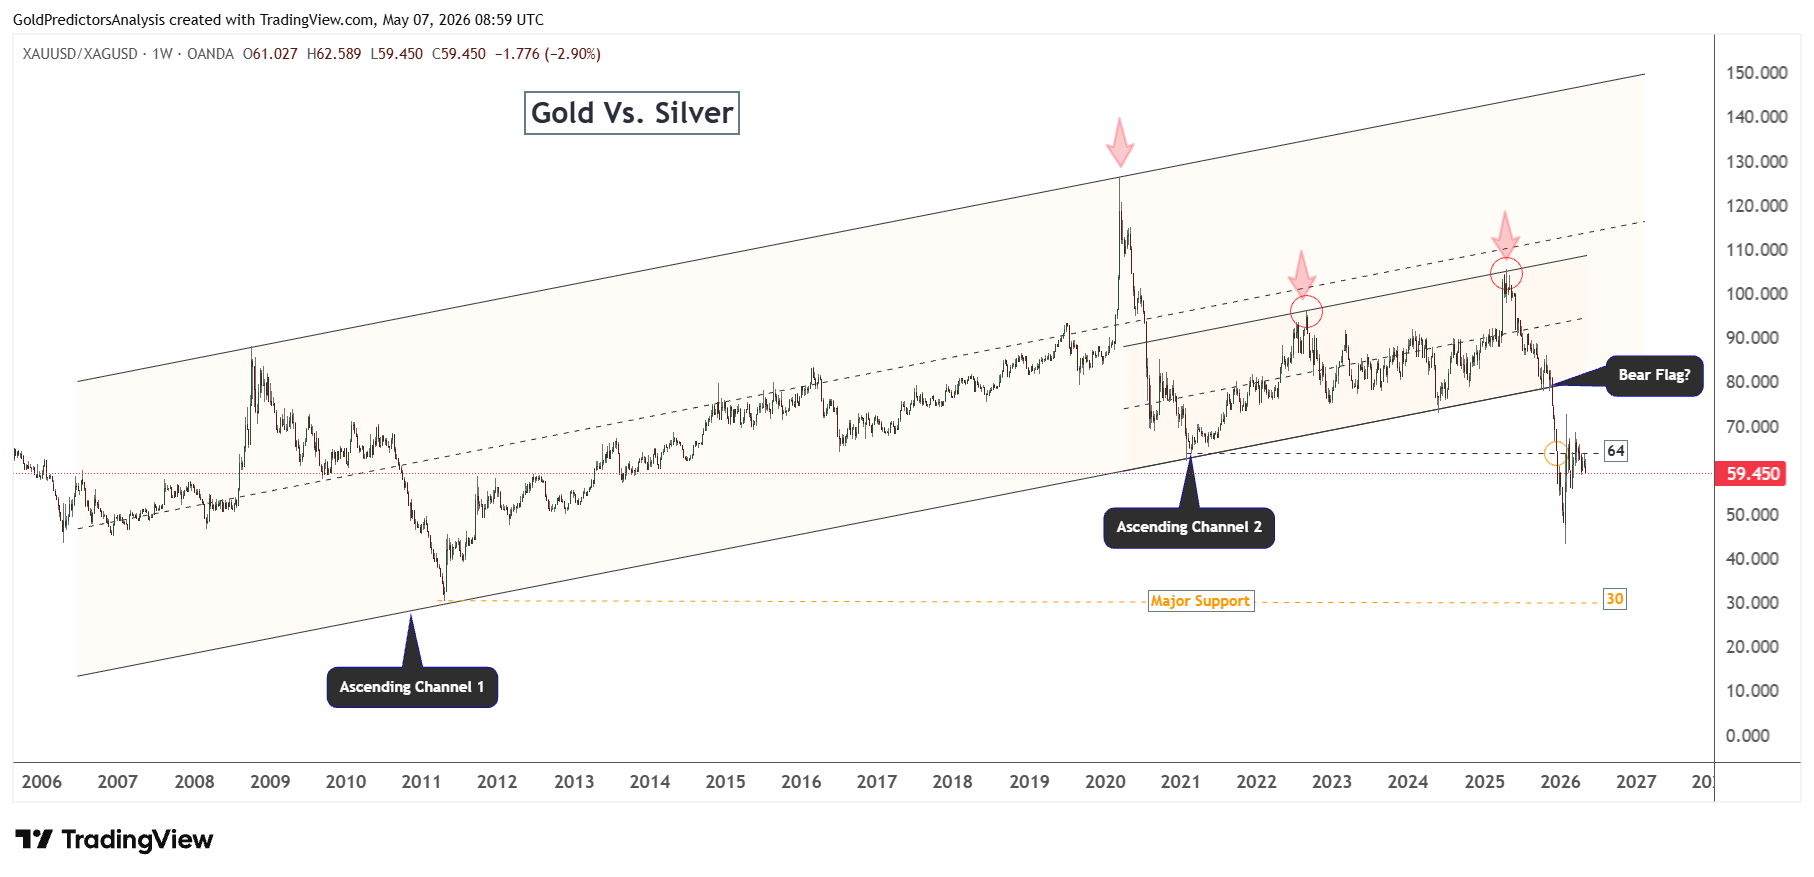
The gold-to-silver ratio is a very important tool to define the trend shifts in the gold and silver markets. The weekly chart for the gold-to-silver ratio shows that the strong upward trend in the ratio was broken in November 2025 at the support of 78. This breakout has triggered a strong drop in the ratio towards 44.
The breakout in the ratio in 2025 has also broken the bear flag pattern, which indicates a strong negative trend in the ratio. This negative trend indicates that the silver (XAG) price will likely lead gold due to strong industrial and renewable energy demand.
Resistance at 64 Keeps Silver in the Lead
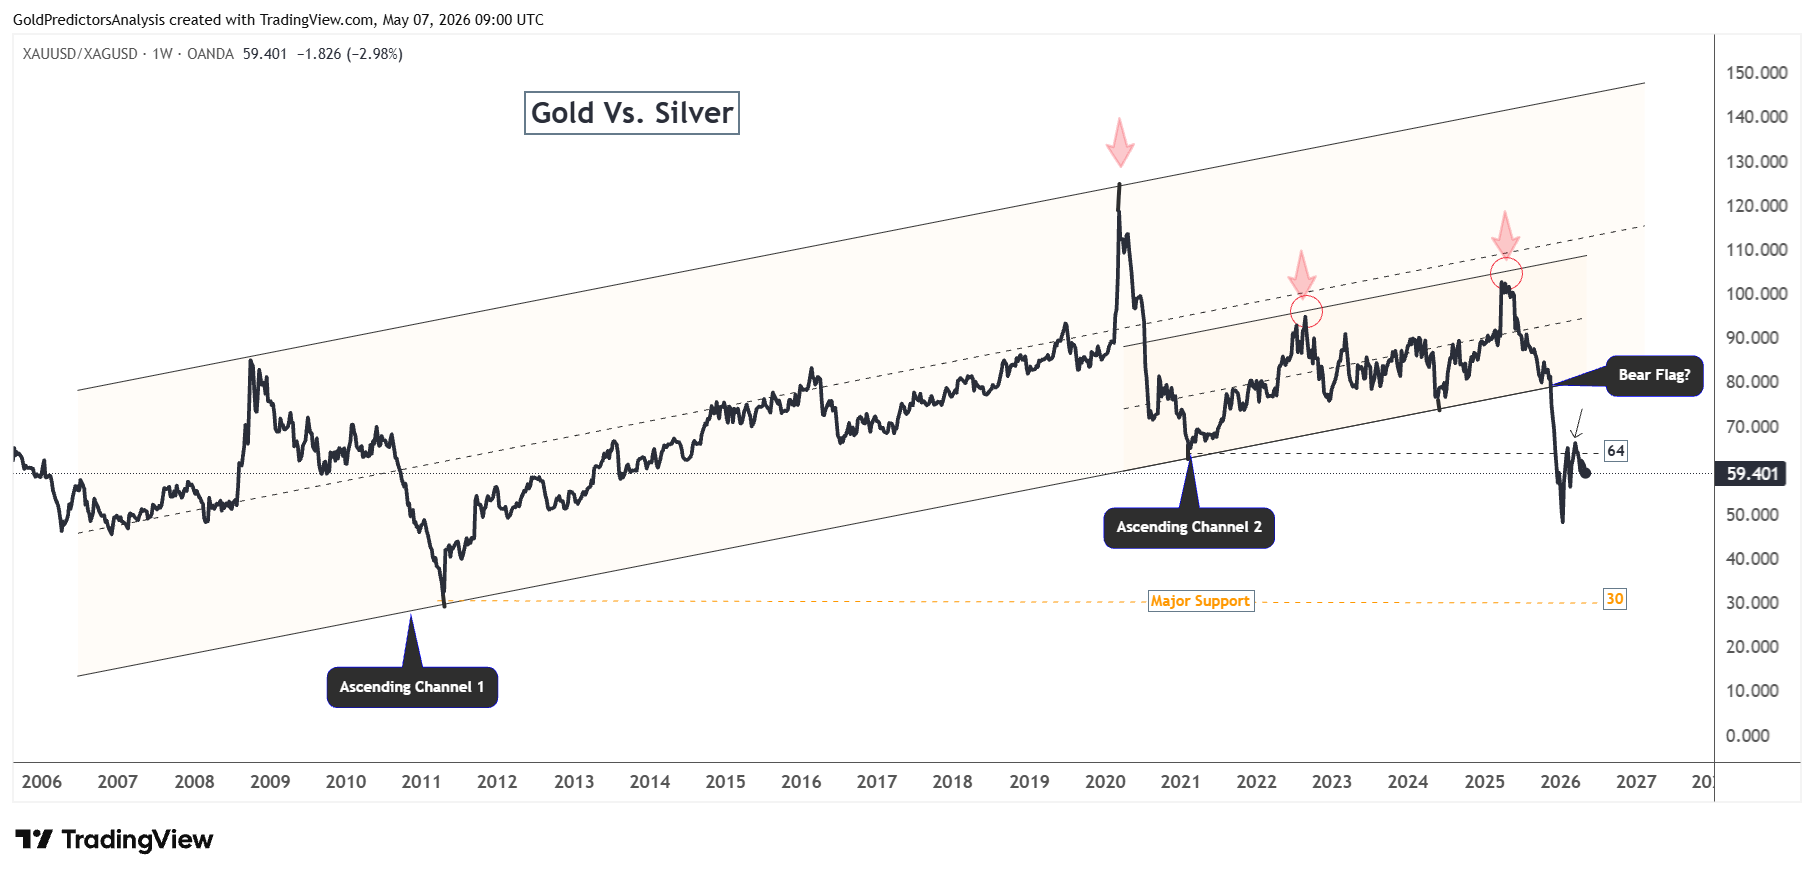
The strong rebound in the ratio towards the 72 level in the first quarter of 2026 has formed resistance at the 64 level and continues to trade lower.
The index remains in the negative trend and is targeting the 30 level as the major target of this breakout of the ascending channel. This means that the silver price will likely be stronger than the gold market and break the record level of $120 once this correction is over.
The negative trend in the ratio also suggests that both metals will likely be trading in a bull market. By looking at the ratio on the line chart, the resistance of the 64 level is very important. It shows that the ratio rejected the 64 level and continues to trade lower, which indicates a healthy trend in the gold and silver markets.
Broadening Wedge Points to Deeper Ratio Decline
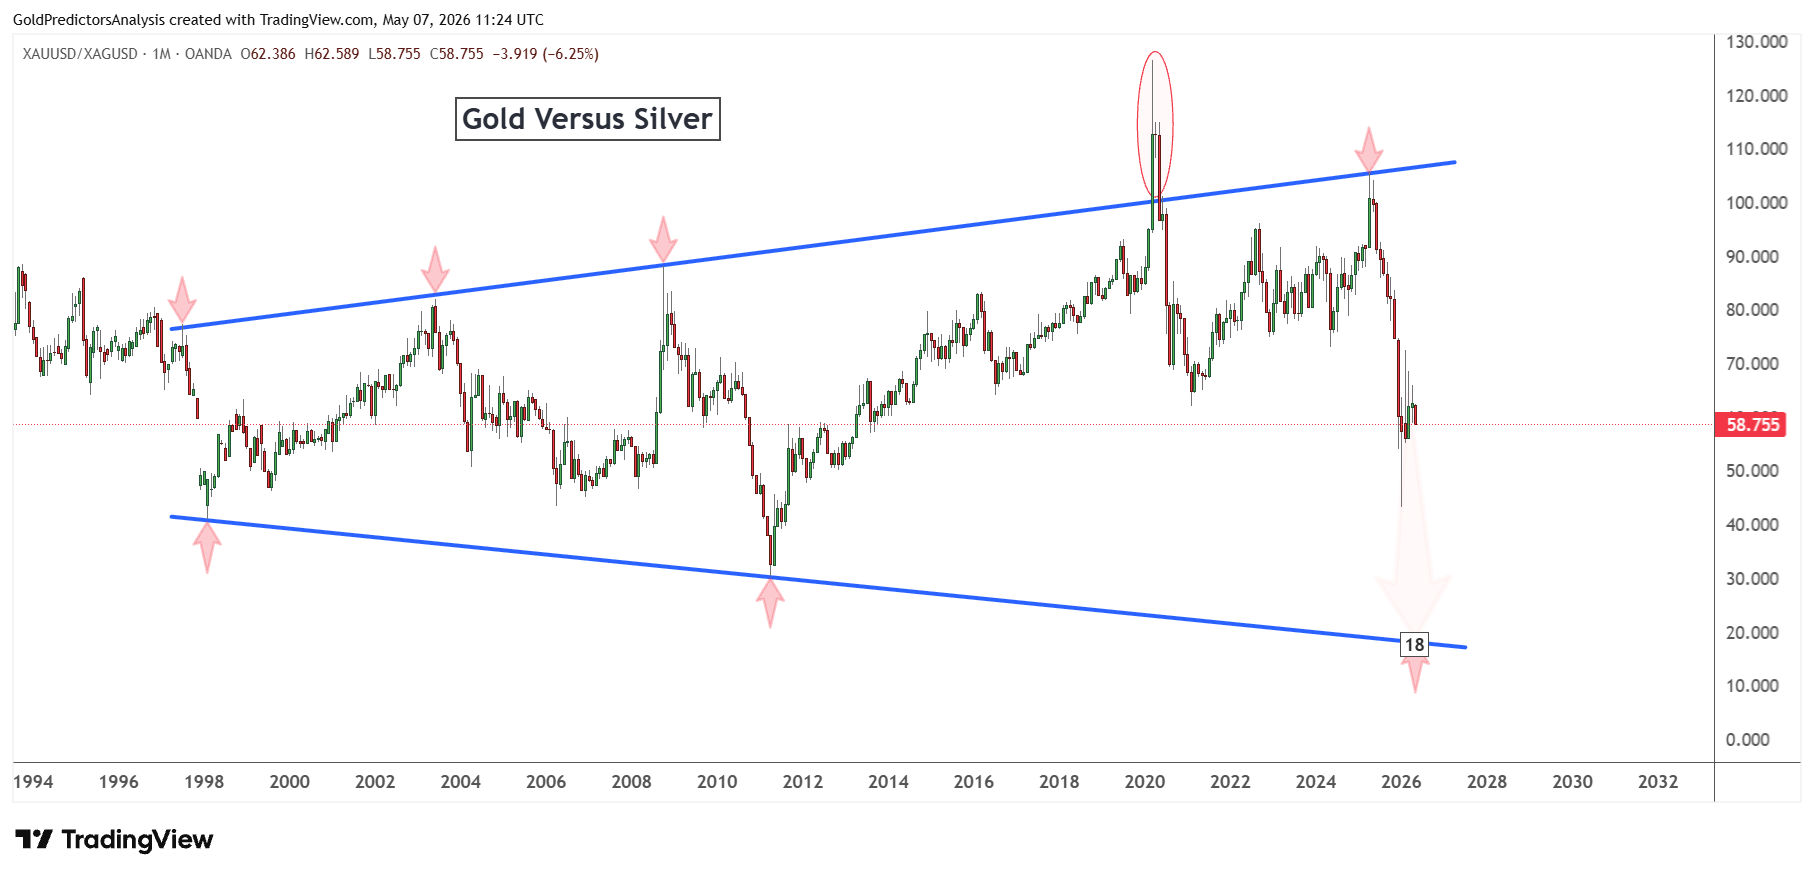
This negative trend is also observed by using the broadening wedge pattern, which indicates that the ratio is pointing even lower below the 30 level. The support line of the broadening wedge pattern points to the 18 level in the long term. If the ratio continues to trade lower from current levels and fails to break higher above the 64 level, it will likely trade first towards the 30 level. A break below the 30 level will open the door for the 18 level.
This indicates that the silver has entered a strong bullish trend after breaking the historical key level of 50 in 2025. Therefore, the breakout in silver at $50 will likely push the prices to $300 in the next few years.
Gold and Silver Rebound From Support as War-Level Resistance Nears
The short-term price action in both gold and silver shows that the prices are rebounding from the strong support zone. Despite this rebound, gold and silver remain below the war level. These levels stand at $5,300 in gold and $92 in silver.
After dropping from the war level, gold and silver produced strong key reversal candles on 23 March 2026. The prices have been pushing higher from this date towards the war level.
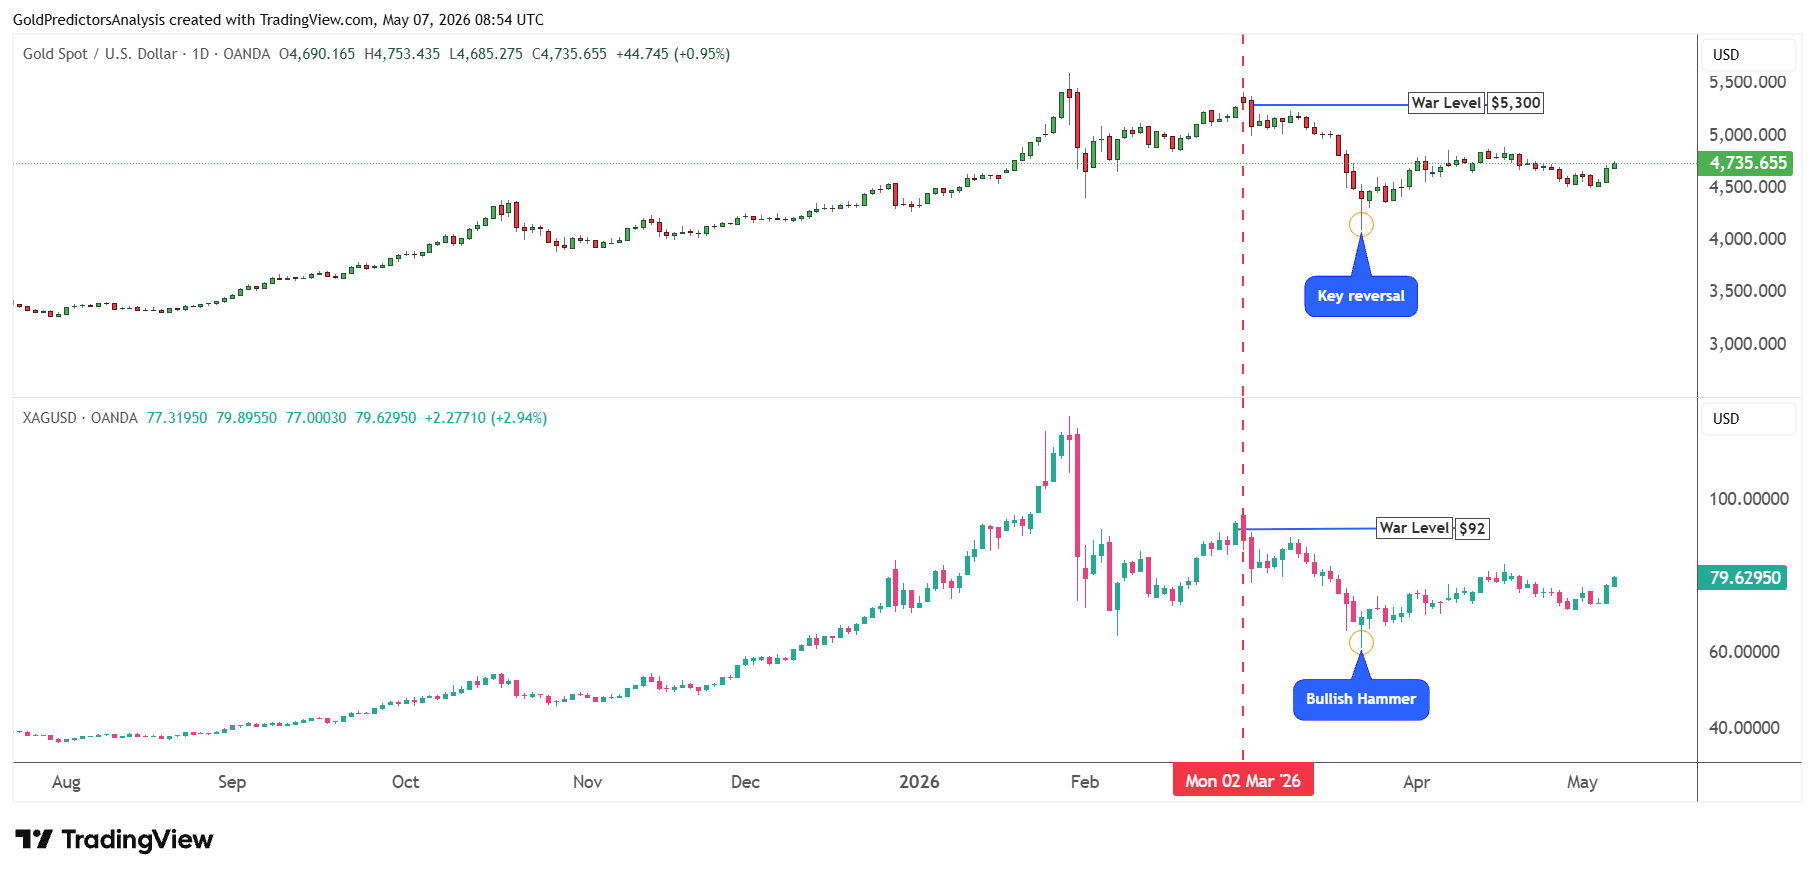
This indicates that despite the war between the U.S. and Iran, the main trend in the gold market remains bullish, and this is just the consolidation that is strengthening the bullish trend for the next move higher.
A break above the level where the U.S.-Iran war started will indicate that gold and silver are ready to surge higher for the next leg.
Final Thoughts
The price of gold rebounded from the $4,500 area, which highlights the continued support for the overall bull market. Peace negotiations between the U.S. and Iran have also eroded the dollar, while aiding gold’s rebound to $4,750. But there is still confirmation required in the market. If a peace deal is reached, this will likely unwind some of the safe haven buying.
But if the talks fail, gold will likely consolidate again. The upcoming labour data and Fed uncertainty will likely be the impetus for the next move. If the US dollar continues to be weak and jobs data continue to disappoint, gold has a chance to make further gains toward the $5.600 resistance zone.
From the technical perspective, the price remains bullish above the $4,400. A move above $5,000 will indicate greater momentum and will pave the way to $5,600, and ultimately $6,000. On the other hand, the silver will likely lead the rally during this trend as the gold to silver ratio is trending down. But a break below $4,400 would indicate a deeper correction. Overall, the gold trend remains strongly bullish and the current consolidation appears to be a preparation for the next step up to $6,000.
If you’d like to know more about how to trade gold and silver, please visit our educational area.