



Gold (XAU) prices continue to drop after breaking the $4,500 as the rising US Treasury yields, strong US dollar and tight Fed policy expectations continue to pressure the market. In my view, this breakdown opens the path toward the $4,000 region before a long term bottom can form within the broader bullish trend. This article discusses the Fed policy risk, bond market pressure, key price levels and the conditions that may trigger the next major rebound.
Fed Policy and Treasury Yields Pressure Gold Price
Kevin Warsh Faces First Fed Test as Inflation Risk Rises
The macro backdrop has become difficult for the gold price. The strong jobs data, higher inflation concerns and rising US Treasury yields indicate higher interest rates for longer.
The BLS reported three straight months of solid employment gains. The strong employment data indicate that Fed might not cut rates. This is because the strong labour market supports spending, wages and credit demand. It also makes inflation harder to bring down.
Kevin Warsh is the new Fed chair. He is viewed as a conservative policymaker. He is also expected to focus on reducing the Fed’s balance sheet. This is important for gold because the tighter policy can lift real yields and pressure on precious metals.
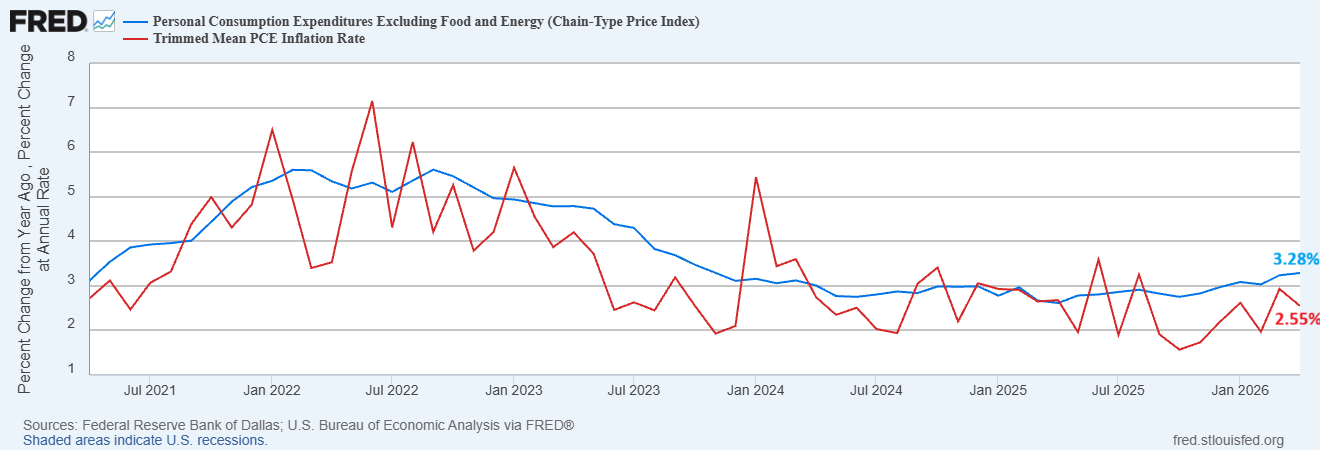
But the situation is complicated. Core PCE inflation remains in a strong positive trend but Warsh focuses more on the Dallas Fed Trimmed Mean measure. The Trimmed mean measure still shows a softer trend as seen in the chart below. The softer trend in Trimmed Mean gives him some room to argue that the underlying inflation remains contained.
But that argument does not justify the current market conditions. The credit growth is accelerating. The chart below shows that the bank loans and leases surged strongly over the past year. But the real GDP growth remains at 2.54%. This indicates that the credit is expanding faster than the output. This is another sign of growing inflation as the debt grows faster than the real economy.
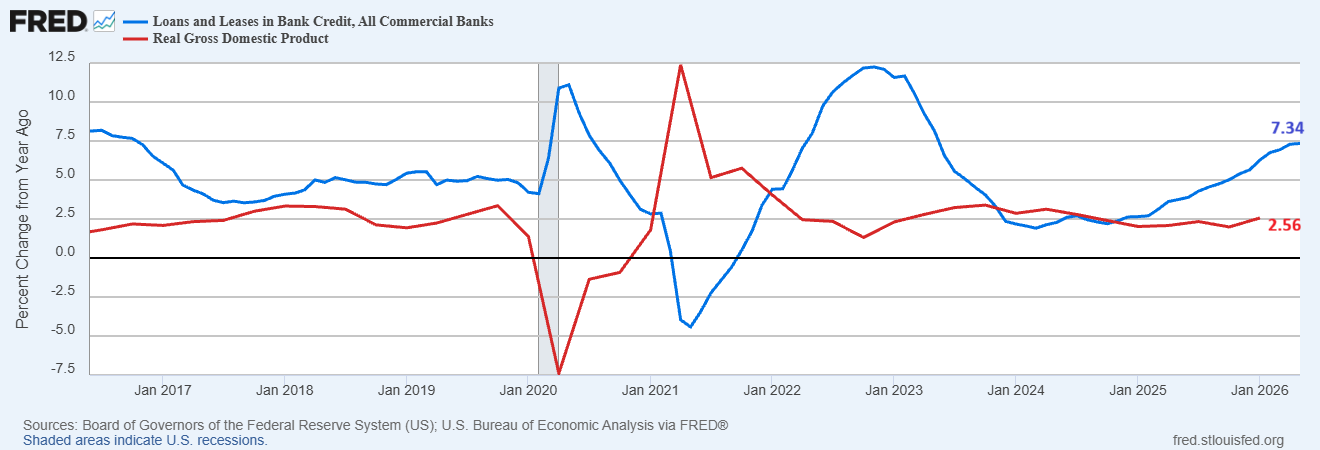
Now the main risk comes from the Fed. If the credit growth continues to expand during the current oil crisis, the inflation may move above the 5%. In that case, Warsh may focus on keeping the tight policy to protect the bond markets.
Gold Price Forecast
Every new Gold analysis as it publishes, today's technical signal and key levels, live price — on one page.
See all Gold forecastsGold Price Outlook Depends on Treasury Yields and U.S. Dollar
The next major move in the gold market now depends on the movement of the bond market. If Warsh holds interest rates steady and shrinks the balance sheet, then liquidity may stay tight and this would support U.S. Treasury yields and the U.S. dollar.
But if the Fed cuts rates in this high inflation and rising credit growth environment, then U.S. Treasury yields could surge above 5% as investors demand more compensation for inflation risk.
If this scenario develops, the Fed will need to manage long term yields directly. The Fed can slow balance sheet reduction, ease bank capital rules for Treasuries or move toward yield control tools. These actions would increase liquidity and weaken confidence in real returns from the bonds.
But the base case remains that Warsh will remain cautious and he will avoid a rate cut because inflation and credit growth are moving in the same direction.
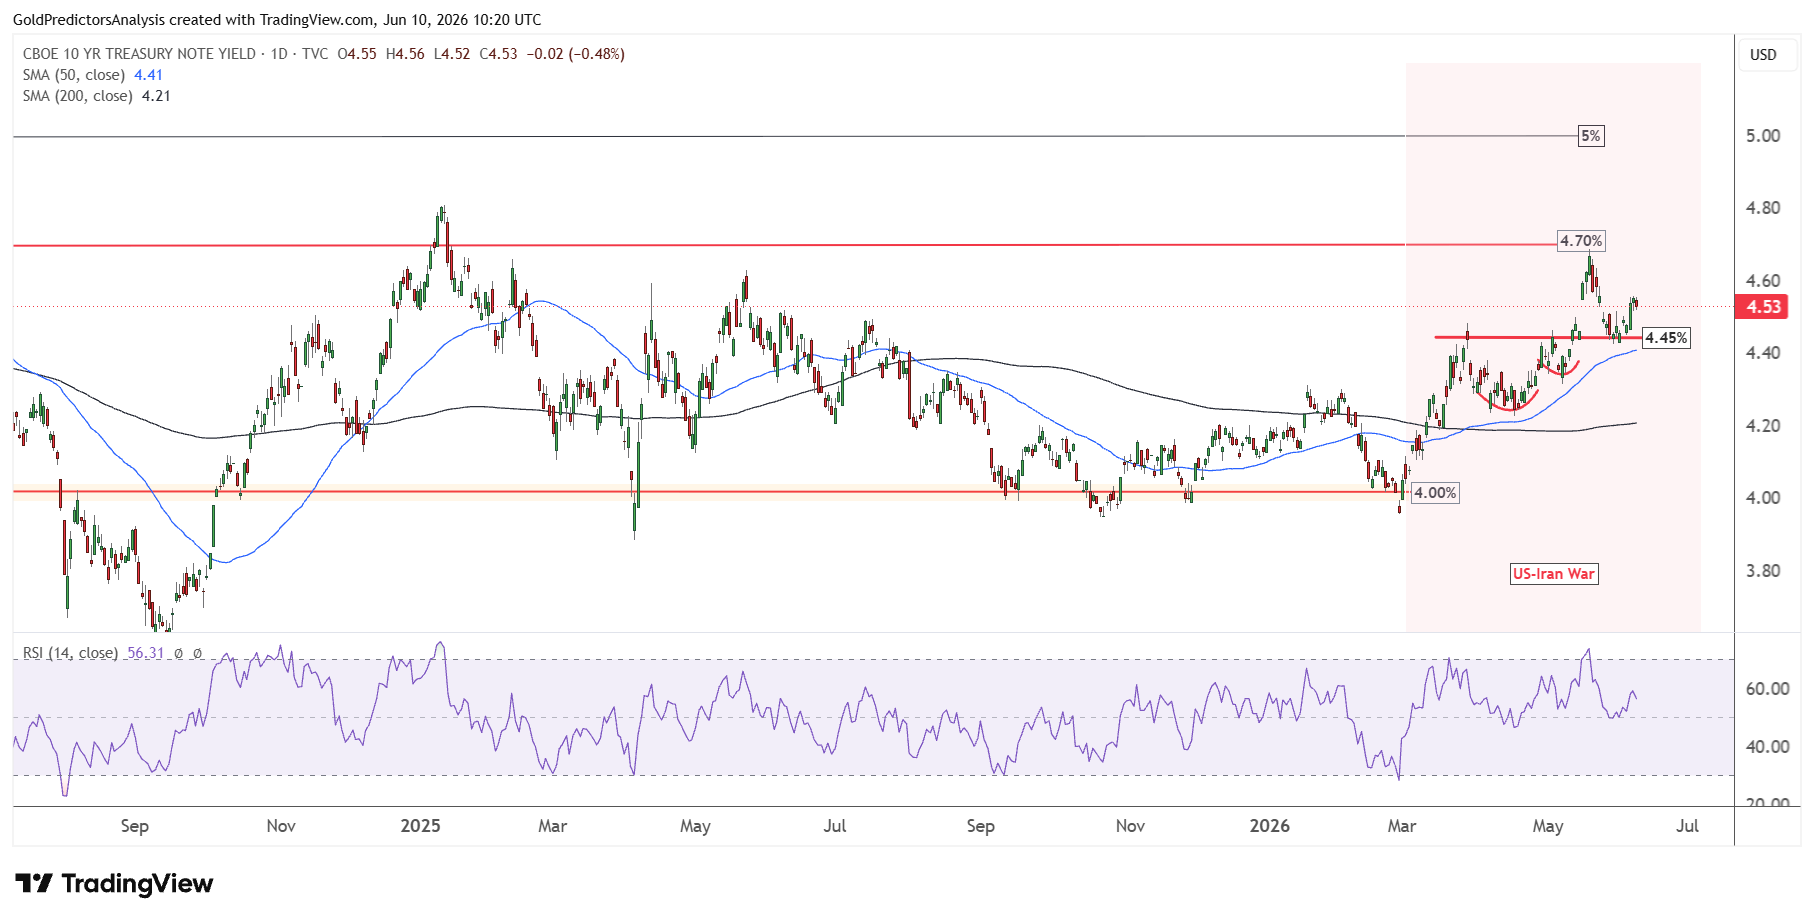
The chart below shows that U.S. Treasury yields have broken above 4.45% after forming a cup-and-handle pattern above the 4.20% level. A rebound from 4.45% indicates that U.S. Treasury yields have a positive trajectory toward 4.70% again.
At this time, Treasury yields may break above 4.70% due to the strong bullish formation. A break above 4.70% will likely push U.S. Treasury yields toward the 5% area. The RSI is also rebounding from the mid-level, which indicates positive strength in U.S. Treasury yields.
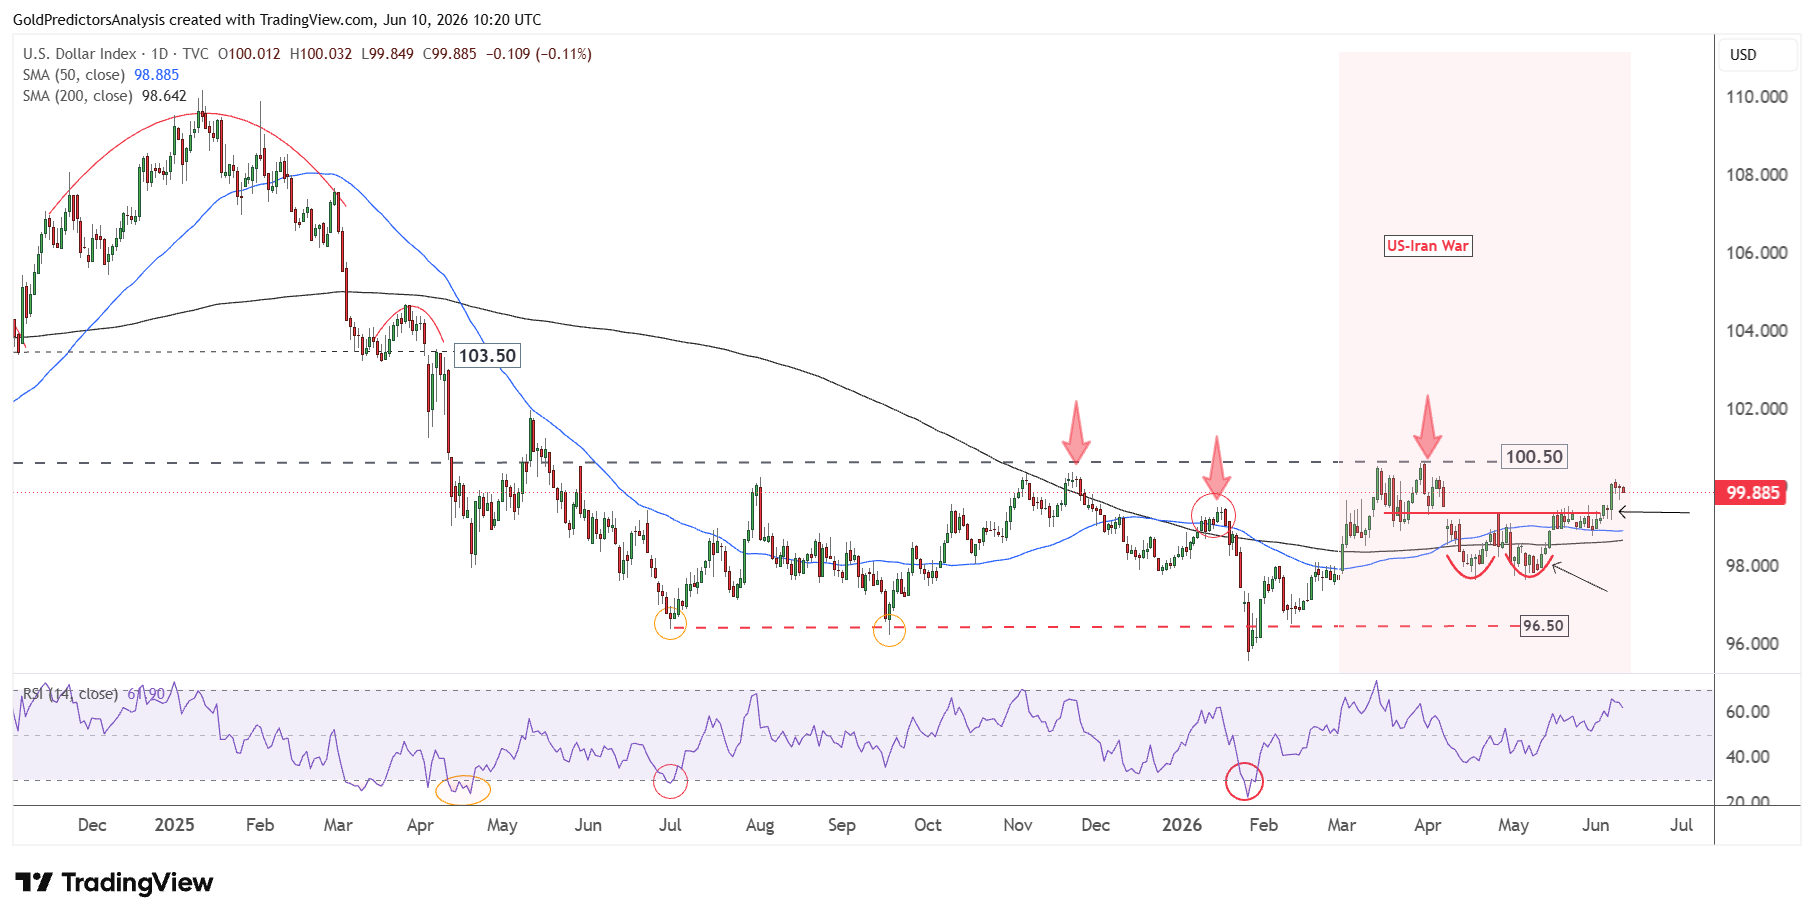
Similarly, the U.S. Dollar Index also produced a double bottom pattern above 97.70 and broke above 99.40. The immediate resistance remains 100.50 and a break above this level will likely push the U.S. Dollar Index further higher. As long as the U.S. Dollar Index and U.S. Treasury yields remain positive, gold prices may face pressure.
Gold Breakdown below $4,500 Opens Path to $4,000
The weekly chart below shows that the gold price has broken from the pivotal $4,500 level and triggered a strong downside move toward the $4,000 area. This pivotal support at $4,500 is defined by the ascending broadening wedge pattern which has protected prices since December 2024.
The previous touch of this support in March 2026 produced strong rally toward the $5,000 region. But the price failed to break above the $5,000 region, which is the main reason gold prices failed at this level and triggered the downside.
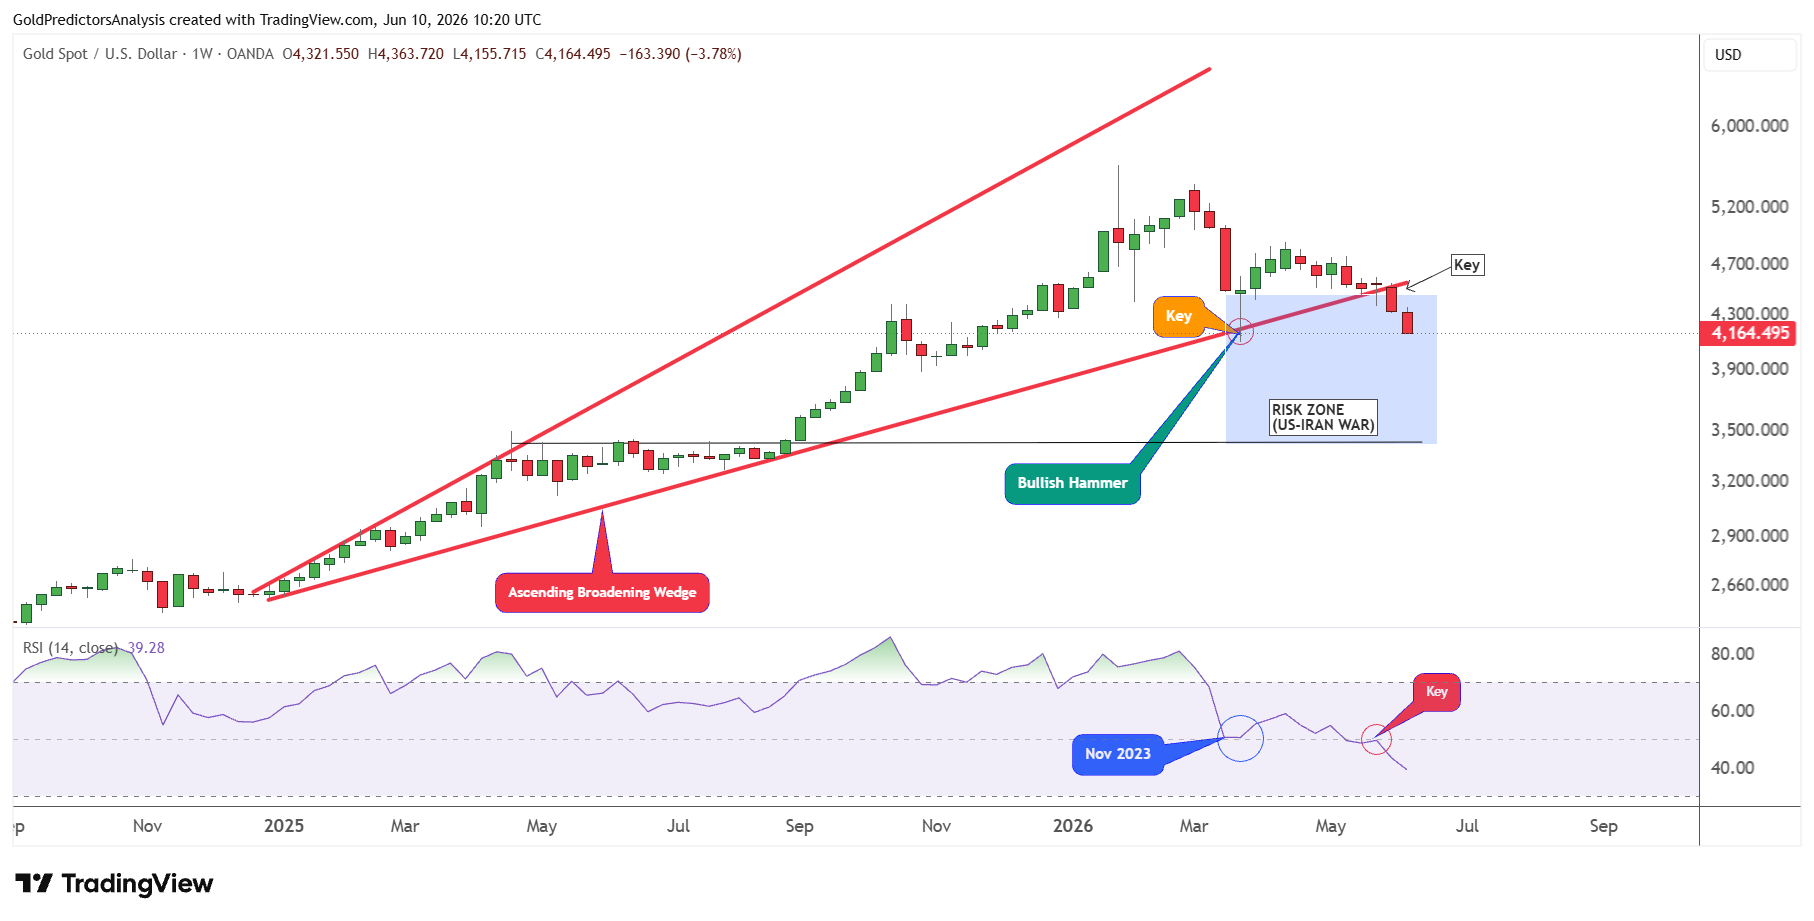
The highlighted region in the chart below shows the high risk zone. This zone is considered a highly volatile region due to the inflation crisis triggered by the U.S.-Iran war. Therefore, prices may trigger a sharp decline in this region to form a bottom.
As long as gold prices remain below $4,500, the risk of further decline remains high. The RSI has also moved below the mid-level as the gold price broke below the $4,500 region. This RSI breakdown suggests that prices may continue to decline over the next few days.
If gold prices continue lower and the RSI moves toward the lower level (20-30), it will likely form a long-term bottom and trigger the next upside rally toward the $7,000 to $8,000 area.
The first support in the gold market is seen near the $4,000 region as shown by the ascending trend line stretched from the October 2023 lows. A break below the $4,000 to $3,900 region is unlikely at the moment. But if this breakdown develops, it will likely trigger an intense drop toward the $3,500 level.
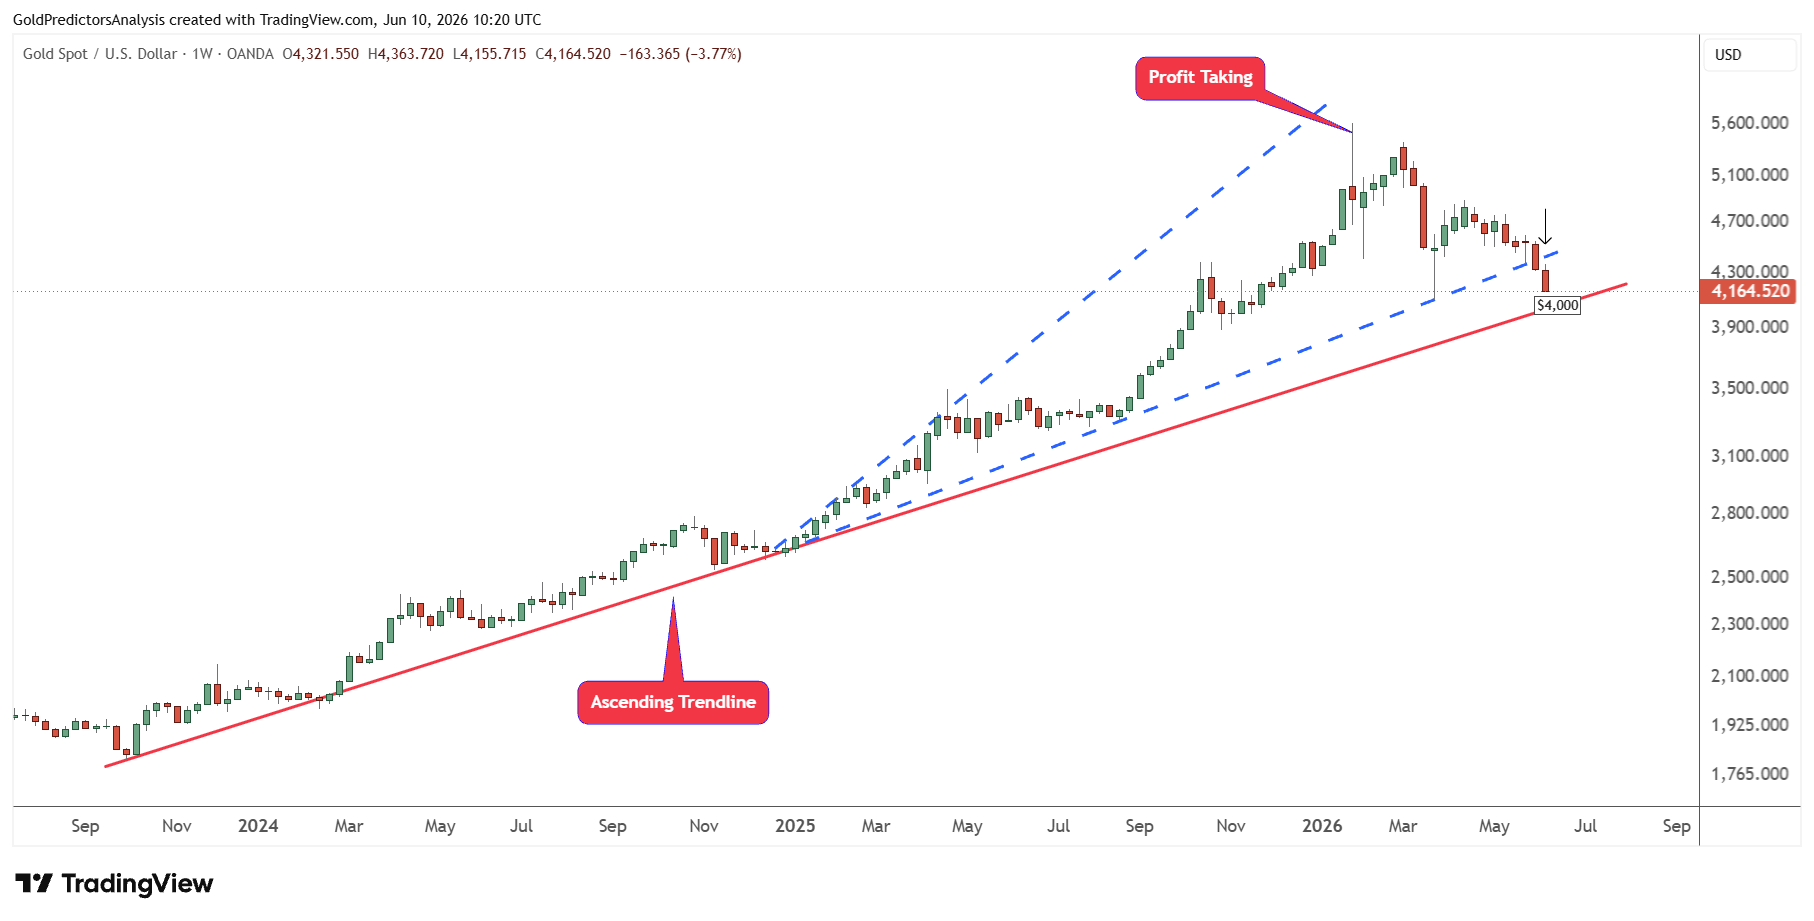
This correction in gold looks healthy within the broader bullish trend and will offer strong buying opportunities for long-term investors.
Key Market Risks
The biggest risk in the gold market now comes from the bond markets. If U.S. Treasury yields continue to rise and the U.S. dollar remains above 97, then gold prices may face short term pressure. If U.S. Treasury yields move toward 4.75%, then gold prices may continue to drop toward $4,000.
But if U.S. Treasury yields break above 4.75% and move toward the 5% region, then gold prices may break below the $4,000 area which will increase further market uncertainty.
The U.S. Dollar Index remains within a strong long-term consolidation between 96 and 100.50. If U.S. Treasury yields remain positive and the U.S. Dollar Index breaks above 100.50, it will likely exert strong pressure on gold and silver prices.
The second risk comes from Fed policy. If Warsh keeps policy tight and continues to shrink the Fed’s balance sheet, then liquidity may stay tight for longer. This would further support U.S. dollar and delay the next strong rebound in gold demand. If the Fed continues to hike interest rates, it may keep the U.S. Dollar Index stronger and put further pressure on gold prices.
Bottom Line
Gold remains under short term pressure from the positive U.S. Treasury yields and the U.S. dollar. The break below $4,500 has opened the door for a strong drop towards $4,000. But this correction was required to keep the gold market healthy. If the spot price forms a strong bottom near major support, then the next move in gold may target the $7,000 to $8,000 area over the longer term. The key risk remains Fed policy. If Warsh keeps policy tight and yields move toward 5%, gold may face more downside before the next major rebound begins. The upcoming inflation data in the next few hours will further provide the next signal for gold prices. This data may decide whether the market extends the decline or starts forming a bottom near major support.
Read more: Fed Rate Fears Drive Gold Breakdown