



Gold (XAU) price remains supported despite several macro signals suggesting risk-on. The yield curve has turned positive, S&P 500 remains above the long-term trend and the Fed has not delivered another rate cut for more than 180 days. These signals reduce the immediate recession fears and support the risk assets. But this does not remove the case for gold. The equity valuations remain extremely stretched, while some real economy indicators still show weakness. This results in a mixed market backdrop. Investors can use gold as safe haven to guard against valuation risk, policy errors and a shift in risk sentiment.
Risk-On Signals Ease Recession Fears but Support Gold
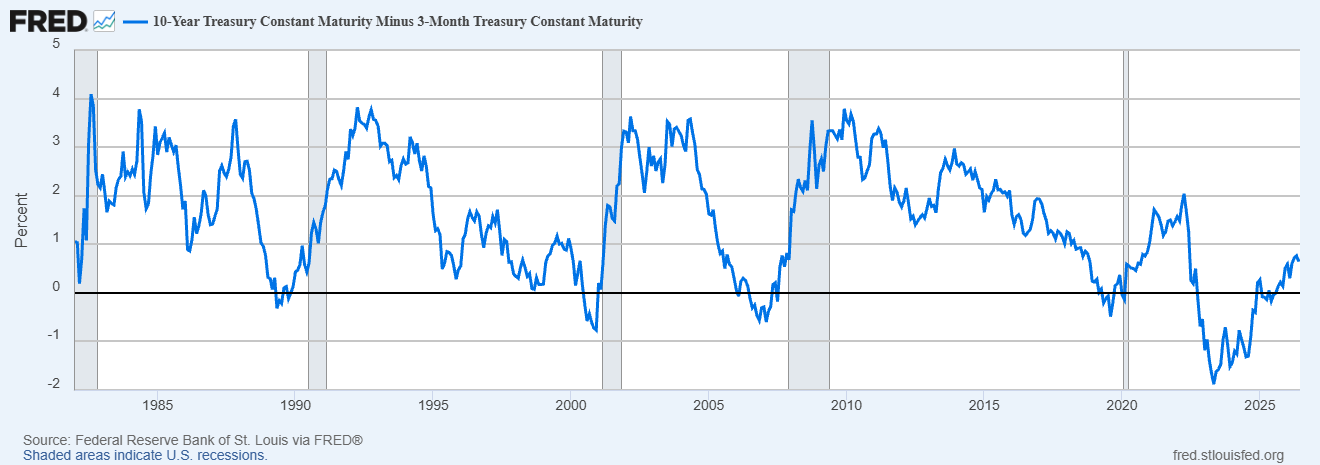
The 10-year/3-month Treasury yield spread has been positive for over 180 days as seen in the chart below. This is significant as yield curve has been one of the best recession indicators in the past. A positive spread indicates that there is less recession pressure at the moment. It also indicates that markets have removed the same amount of stress that was observed in the previous inversion.
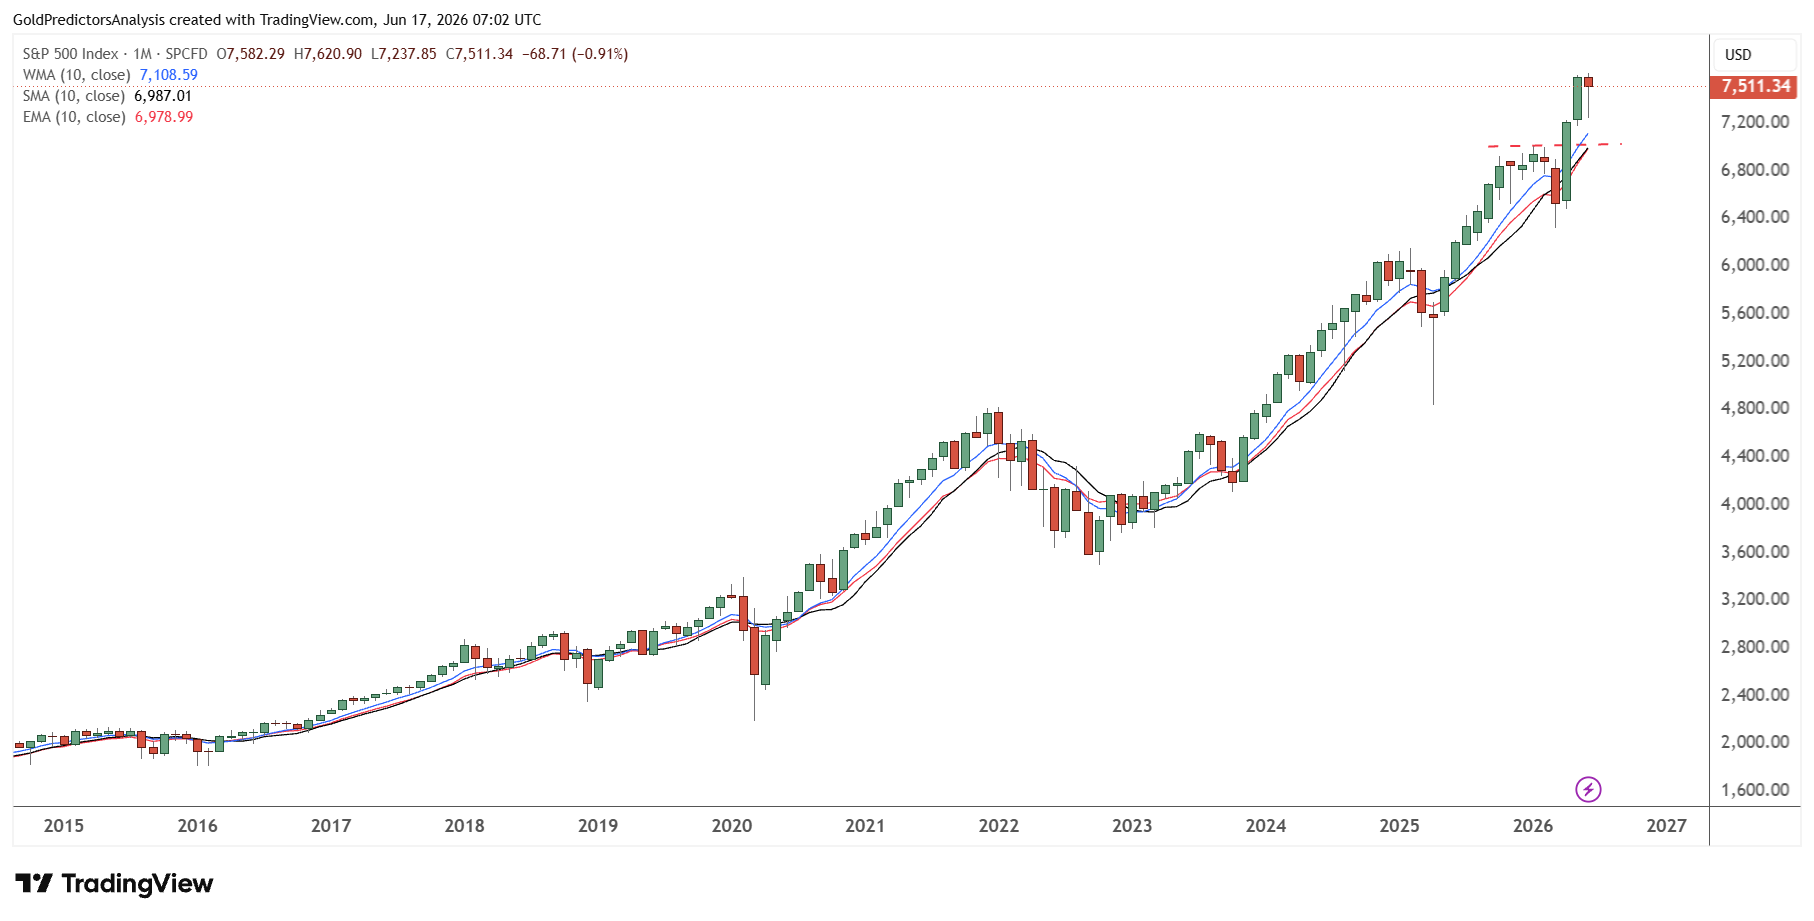
The S&P 500 is also in positive territory above its 10-month weighted and exponential moving averages. This is validating a risk-on scenario in financial markets. The investor community tends to have more positive outlook on growth assets when stocks are above their long term trend. This can help to lower defensive asset requirements in the short term. In the case of gold, it may not be a recession driven safe haven alone.
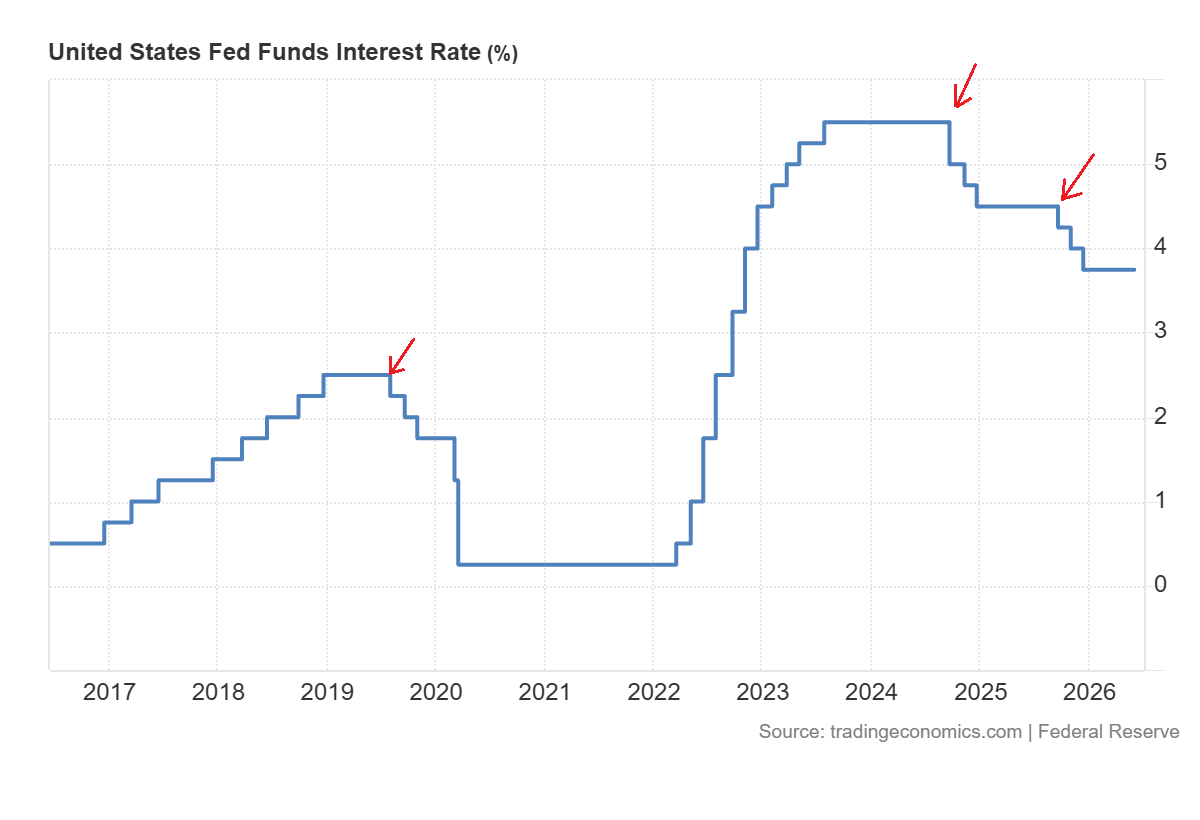
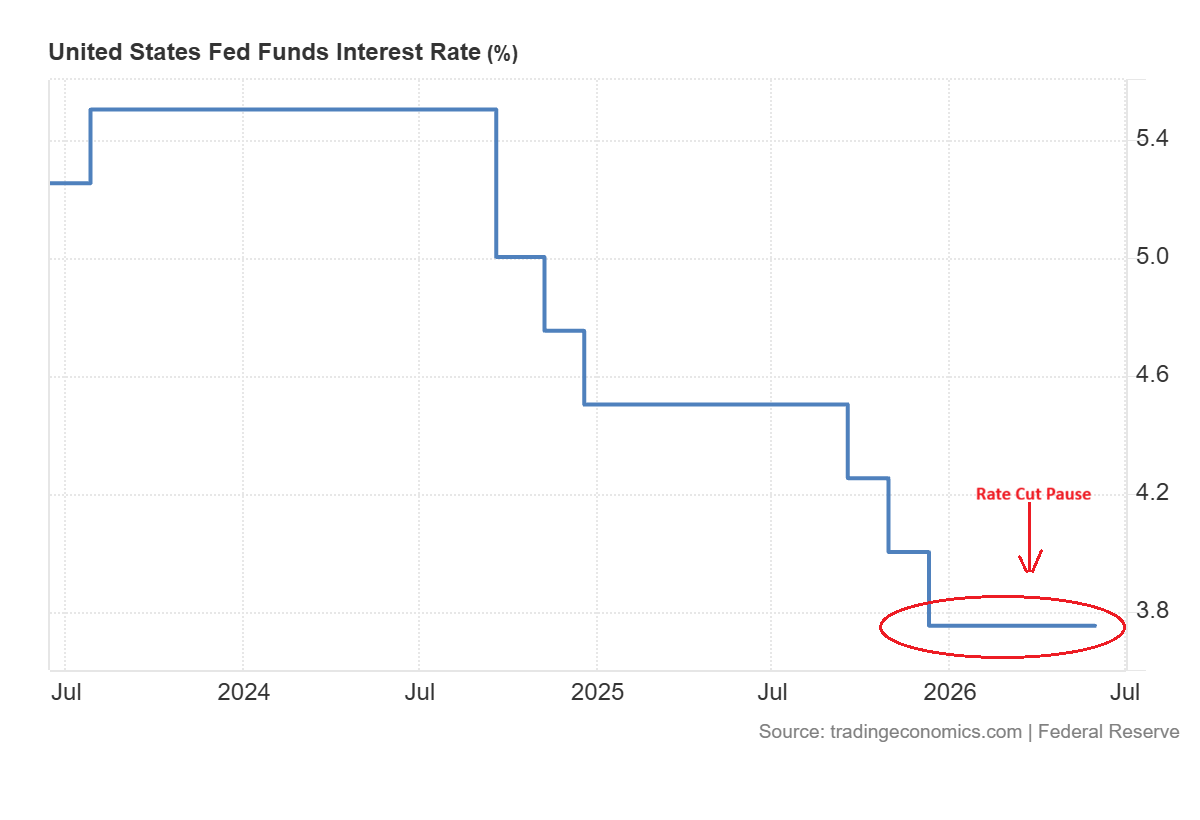
The risk-on sentiment is also supported by the Fed rate cut cycle. The Fed has not announced any new rate cuts for the past six months. It signals that the central bank believes that there is not enough stress to keep easing policy aggressively. When interest rates are not lowered, it can be an indicator that the economy is stable. It could also boost stocks as investors think the economy can handle current policies.
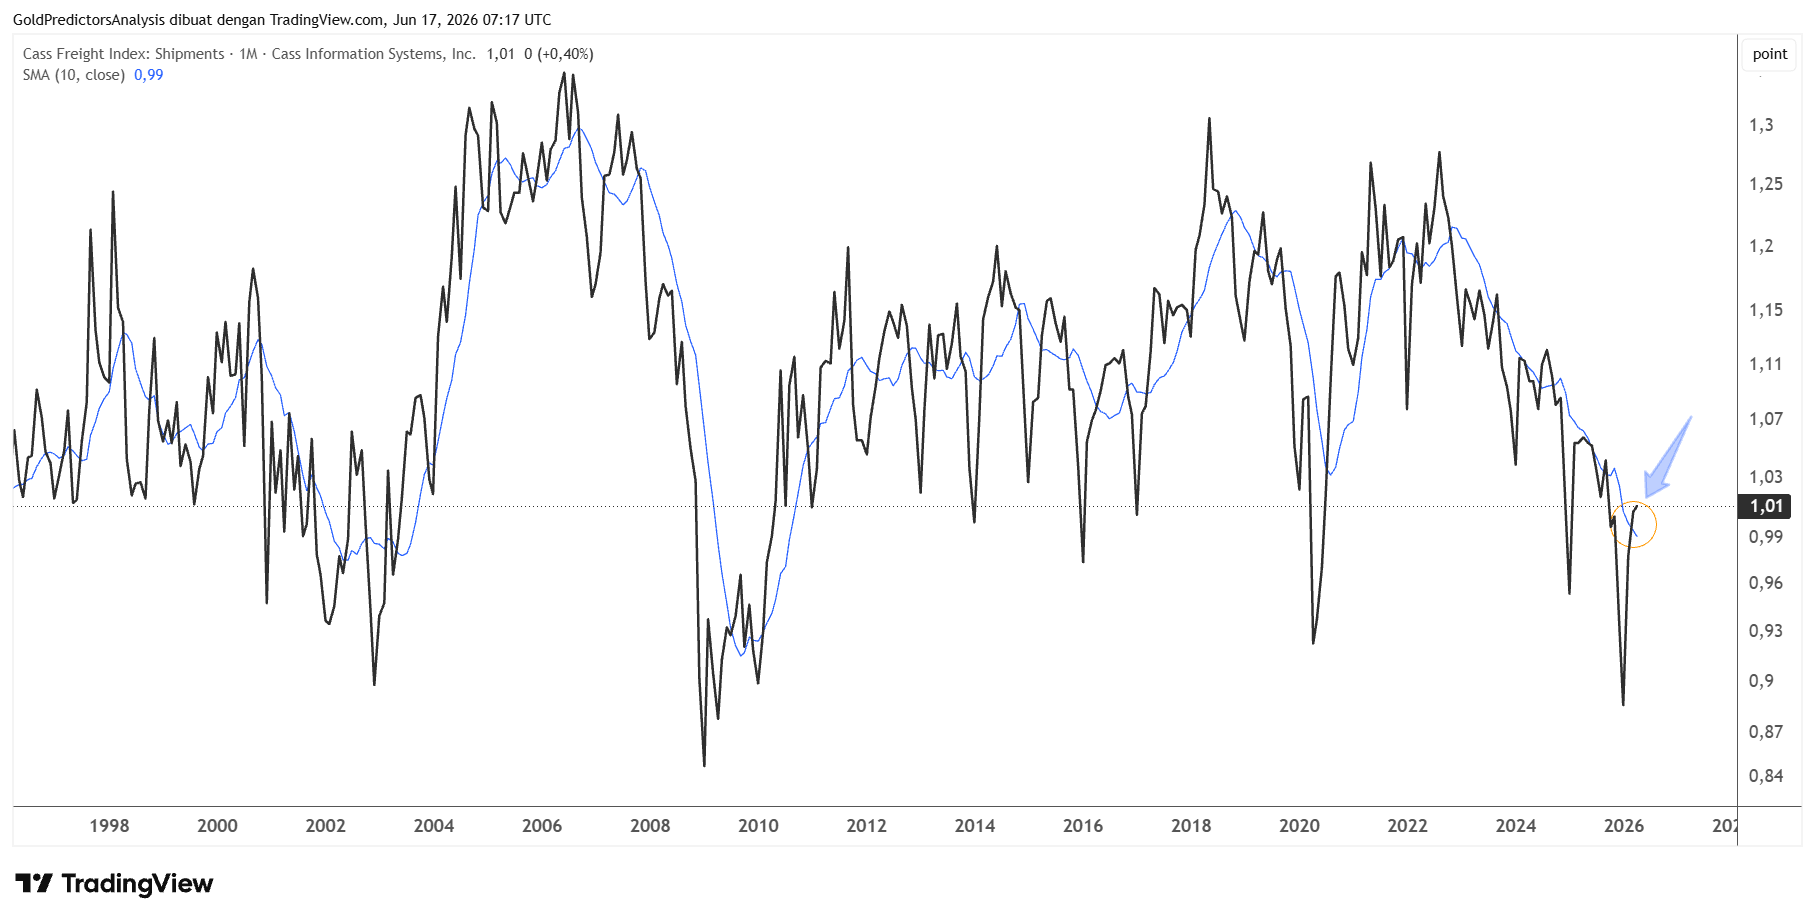
But the risk-on message is not that clear. The freight transport activity has remained weak despite the recent rebound. The cass shipments index rebounds but remains below the 10-month moving average as seen in the chart below. This indicates that the financial market is in better shape than the real economy. This gap can benefit gold as investors may seek protection if market optimism moves too far ahead of the economic times.
Gold Price Forecast
Every new Gold analysis as it publishes, today's technical signal and key levels, live price — on one page.
See all Gold forecastsExtreme Stock Valuations Keep Gold Demand Alive
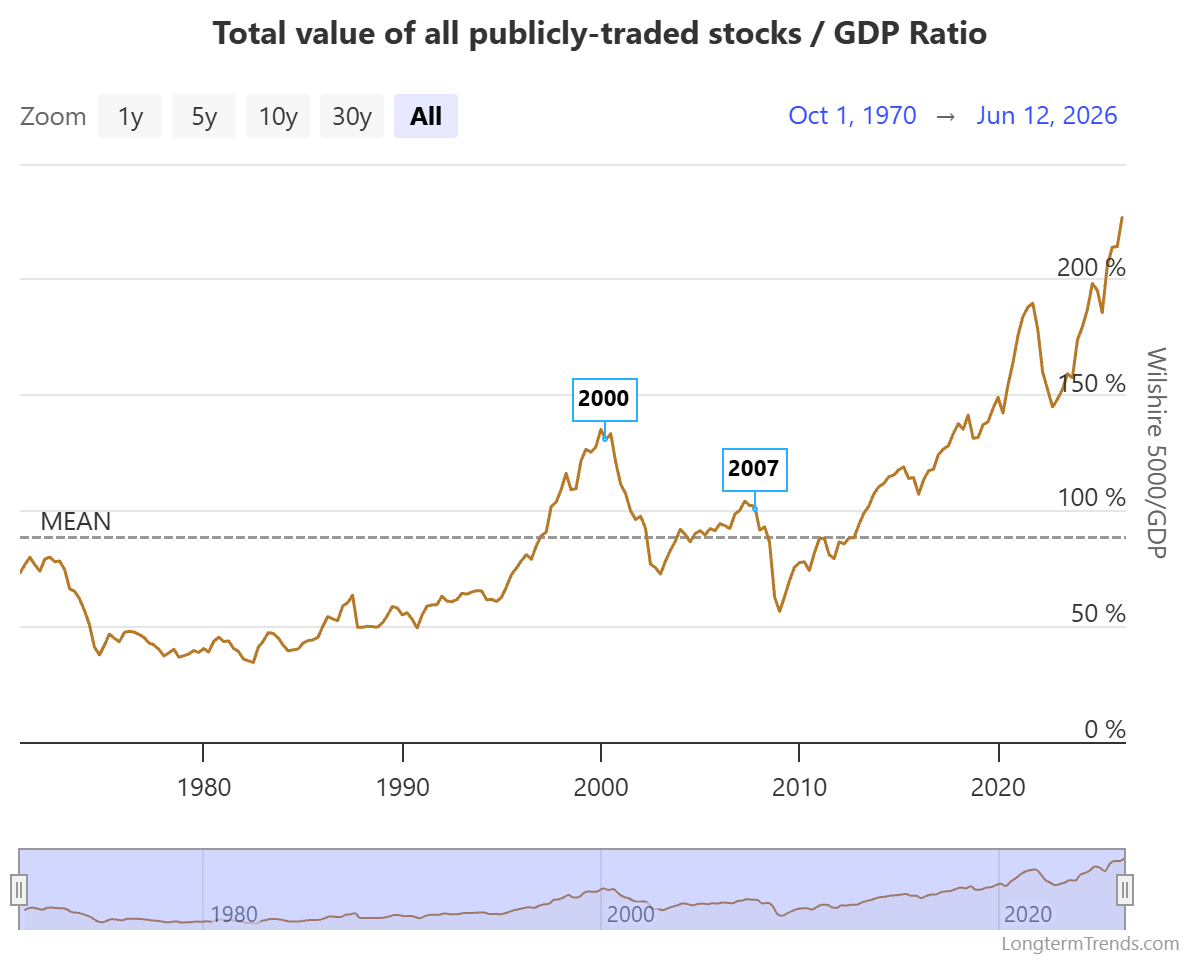
The strong support in gold comes from the extreme equity valuations. The market cap to GDP continues to be much higher than its long-term average. The ratio has surged above 220%. This indicates a high market value of all stocks relative to the economy. If this ratio increases too much, future returns can be more affected by earnings risk, policy changes and the liquidity squeeze.
The Dow Jones price to sales ratio also remains elevated. It is important because sales cannot be as easily manipulated as earnings. A high P/S ratio indicates that the investors are willing to pay a premium amount for every dollar of sales. When profit margins become weak and growth slows, stocks become vulnerable. A demand for gold can form in such an environment, as it does not depend on corporate profits.
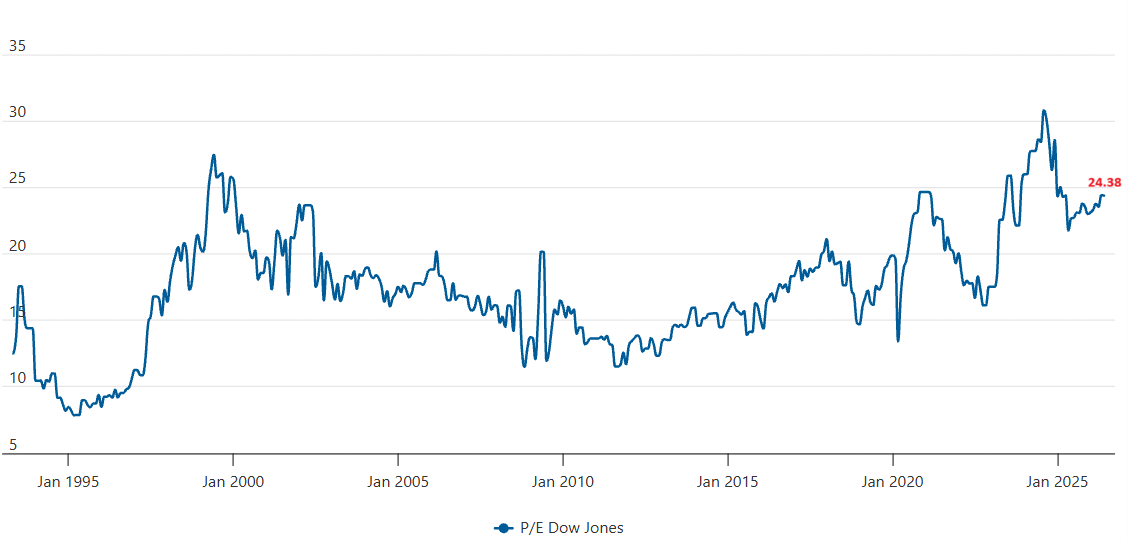
The Dow Jones PE ratio remains close to the previous high. This indicates that investors are still looking forward to robust future earnings. However, when the markets are priced for perfection, high expectations can be dangerous. If earnings disappoint slightly, expensive stocks can correct quickly. Gold can serve as a protection from such repricing.
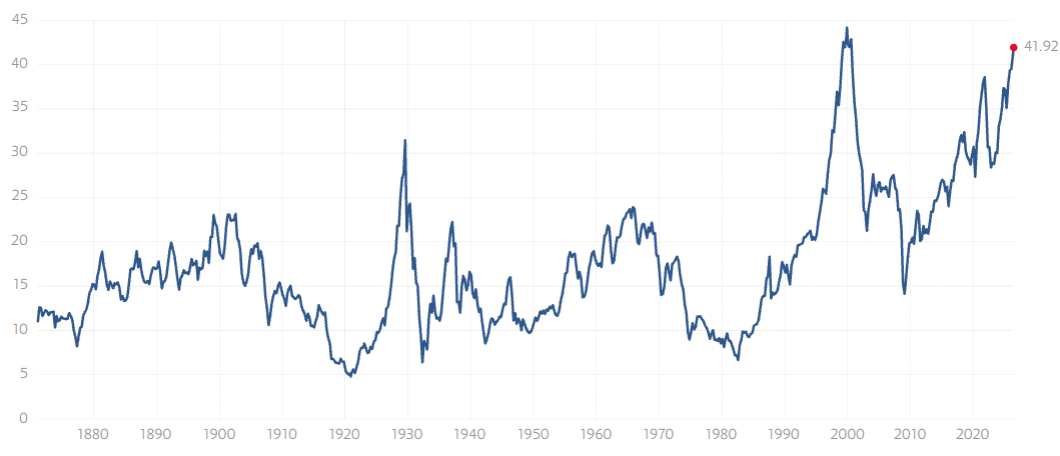
The Shiller CAPE also shows the valuation risk. It is still close to historically high levels and well above its long term average. This is not necessarily an indication that stocks will drop right away. High-priced markets can remain high priced for a prolonged period. But it does imply that there is little margin for error. This helps gold as investors seek refuge in it when stock prices hit highs and lows.
Hedge Demand Supports the Bullish Setup in Gold
Gold price may find support even when the markets are risk-on. The reason is that simple. Investors are not just buying gold due to the fact that they fear a recession. They are also buying it to protect against over priced stocks, policy risk and an eventual liquidity shock. This makes gold a safe haven not just in economic weakness, but in financial market excess.
The current configuration definitely makes for a strong portfolio hedging. Stocks are trending higher, but are reaching valuation extremes. The yield curve has turned positive, but freight data still indicate that the real economy is not fully validating the strength in financial markets. All of this can help to sustain the demand for gold. Investors can keep investing in stocks and keep gold as a safeguard.
But uncertainty around the Fed regarding the Fed decision is good for gold. While a pause in rate cuts might lend support to risk-on signal, it also ensures that the policy remains sufficiently tight to bear down on parts of the economy. If Fed waits too long, the growth may slow. If the Fed could end up dovish quickly, the inflation worries could resurface. Both are good for gold as both add uncertainty.
Gold is overall in an excellent position in this mixed market environment. Risk-on signals could be beneficial for equities in the short term, but extreme valuations still keep the hedge demand alive. Investors may be willing to use gold as a protection as long as stocks are rich and the signals from the real economy are mixed. This helps to maintain the bull market formation without a signal of recession.
S&P 500 to Gold Ratio Shows Capital Rotation Risk
The SPX-to-Gold ratio chart clearly explains the historical capital rotation events. The chart shows that major rotations occurred in 1931, 1970, 2002 and 2024. These rotations triggered a strong surge in gold during the next few years.
But the recent rotation into the gold market in 2024 was impacted by the U.S.-Iran war, whereby the SPX-to-Gold ratio bottomed at 1.25 and recovered above 1.60.
Despite the rebound in the ratio, the quarterly candle is likely to close in June. This final close of Q2 2026 will likely provide some clues about the movements in gold and US stocks. But if the S&P 500 index remains elevated and the stock market continues to perform well, then the ratio may remain elevated above 1.60.
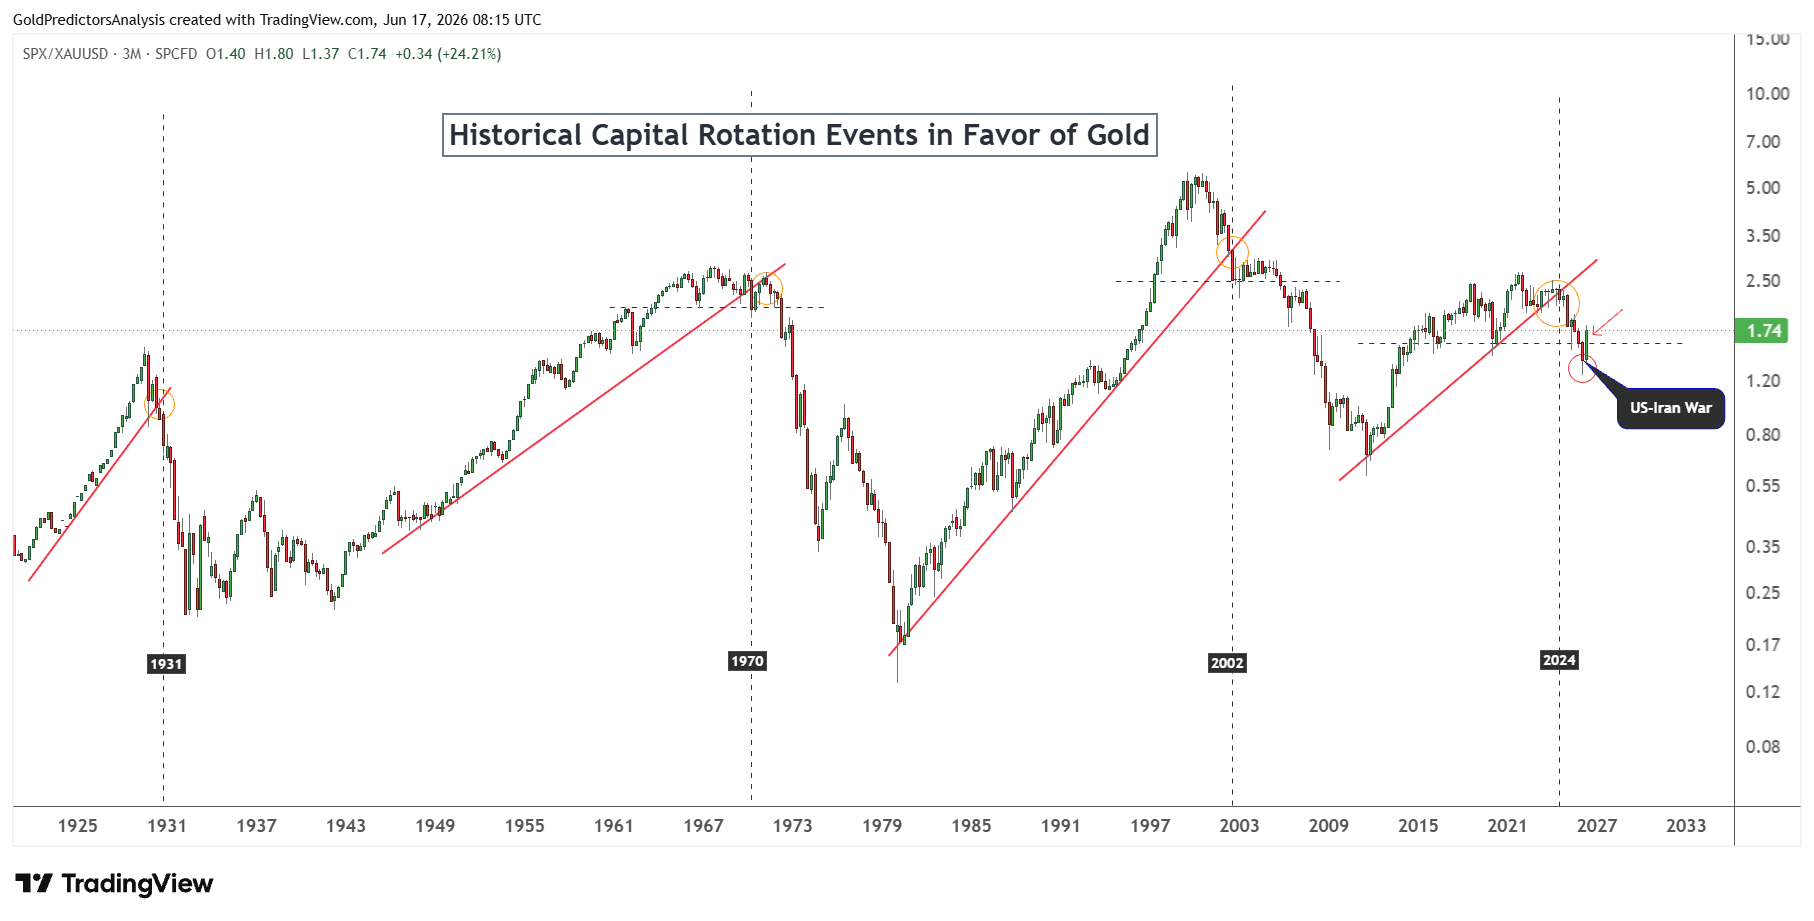
But if gold prices confirm the bottom and start the next leg higher, it may bring the ratio down within the long-term negative trend. From a historical perspective, the ratio remains bearish. This indicates that gold remains a defensive hedge and supports bullish outlook.
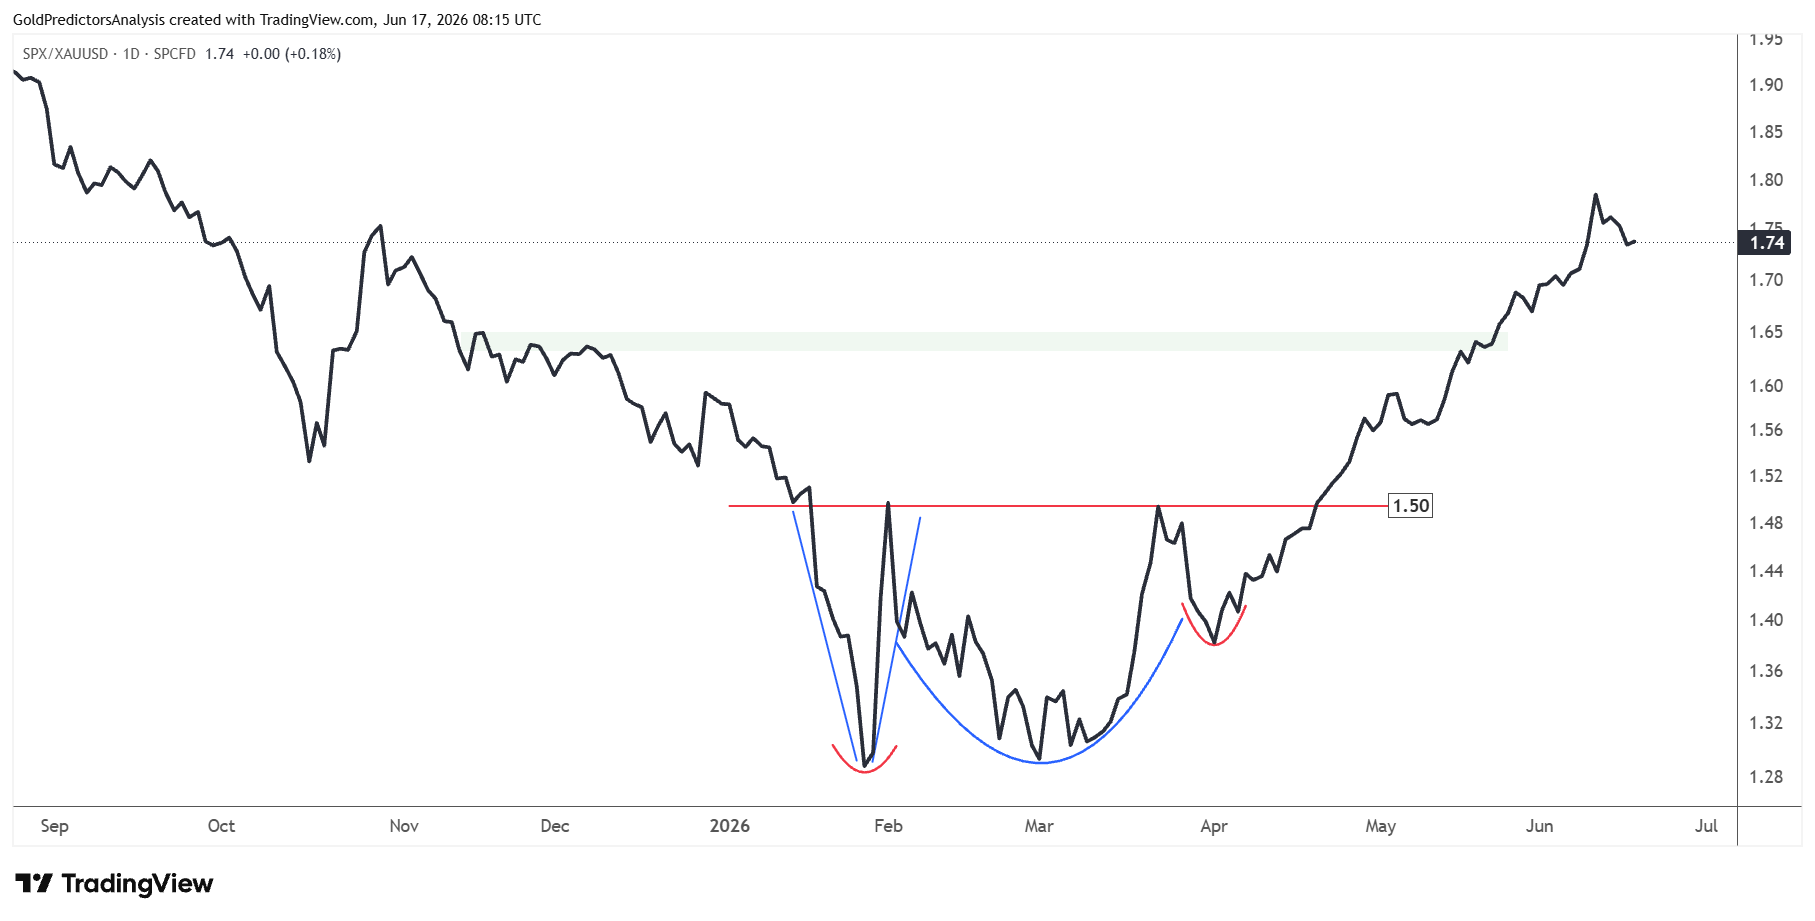
The recent rebound in the ratio in 2026 has produced strong short-term bottom patterns as seen in the chart below. This has pushed the ratio above the key level of 1.60 and hit the high of 1.80. But now it all depends on the next possible move after the resolution of the U.S.-Iran war that may impact the Fed rate decision.
Gold Price Outlook Depends on $4,000 Support
The overall price structure remains strongly bullish in the long-term chart. This chart was previously discussed, where I noted the possibility of a strong drop towards the long-term support of $4,000. The gold price bottomed at $4,000 in June 2026 as expected. The price has since recovered to the short term resistance of $4,350.
The green highlighted region in the chart shows a strong buying opportunity for long-term investors that may push prices higher. This is due to the formation of a historical inverted head and shoulders pattern from 2020 to 2024. This pattern supports a strong bullish outlook.
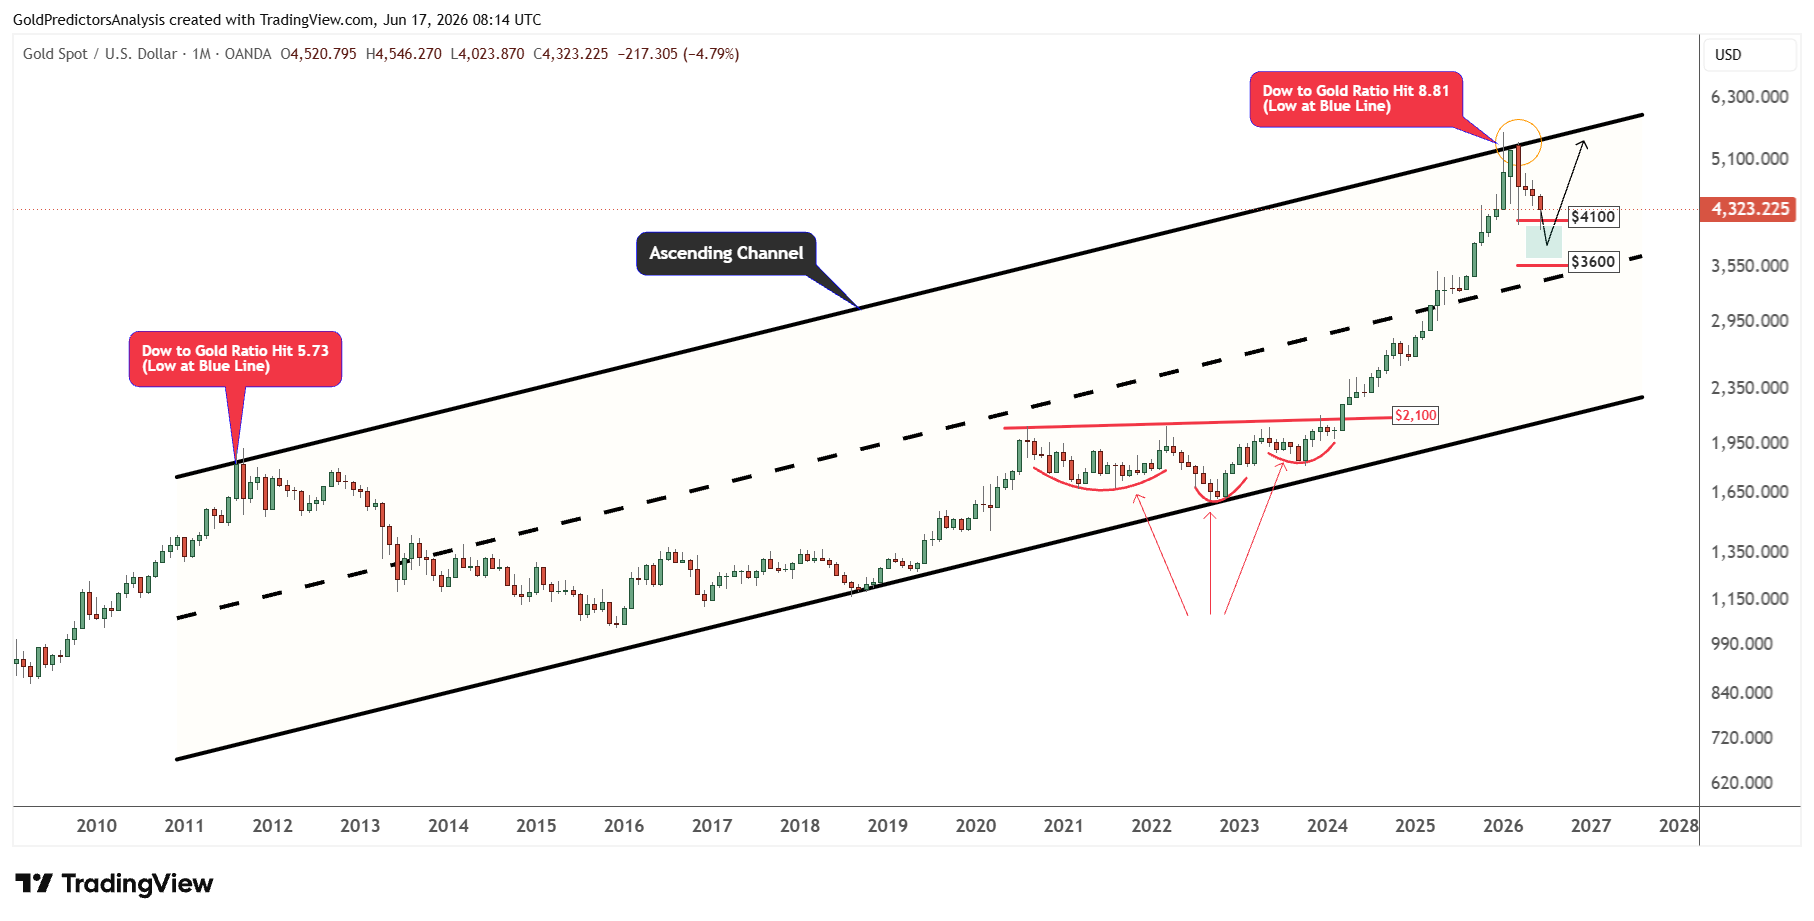
This indicates that if the $4,000 level holds, then prices will likely rally higher towards $5,000. A break above $5,000 will open the door to $5,600.
But a break below $4,000 will likely push the gold price towards the important long term buy zone, which remains between $3,600 and $4,000.
Final Thoughts
Gold remains well-positioned as risk-on signals reduce recession fears but fail to reduce the need for protection. Stocks continue to rise but there are still extreme valuations and weak real-economy signals which keep hedge demand alive. The positive yield curve and Fed pause could have a positive short-term impact on equities, but also put investors at risk if growth slows or policy expectations change.
The S&P 500 to gold ratio suggests that stocks have recently performed better than gold, but the longer-term picture remains in favour of gold as a defensive investment. The spot gold price has found support at the upper band of the long-term support range of $3,600-$4,100. The price must hold the $4,000 in the short term to protect the rally. If the gold price breaks the $5,000, it will open the door for another push to record levels. But a failure to hold $4,000 will push prices to the long-term support zone of $3,600-$4,100, which might be the zone to accumulate the gold positions.
Read more: Fed Decision Looms as Peace Hopes Lift Gold and Silver