


Gold (XAU) prices remain under pressure near the $4,000 support area as the U.S. Dollar Index breaks above the key 100.50 level. The expectations of Fed rate hikes have supported the dollar and pushed short-term traders away from gold. But the long-term picture remains constructive because gold continues to show strength against the dollar in real terms. Moreover, China’s strong gold imports suggest that strategic buyers are using this correction to accumulate. This article presents the macro drivers, dollar breakout, gold-to-dollar ratio and key price levels to determine whether gold may rebound from support or extend its correction.
Macro Drivers
Dollar Breakout Creates Short-Term Pressure
Gold is caught between the short-term strength in the US dollar and the long-term physical demand. The U.S. dollar index has broken the significant level at 100.50 and is currently trading above 101.30. This breakout puts downward pressure on gold as stronger dollar makes bullion more expensive for foreigners. But the dollar’s move is not just about the strength of the U.S. The Japanese yen has reached its lowest level against the dollar in over 40 years and traders are eyeing the possibility of Japanese intervention. This suggests high volatility in the currency market that supports the hard asset demand amid stressful market conditions.
Sticky PCE Inflation Supports Fed Rate-Hike Bets
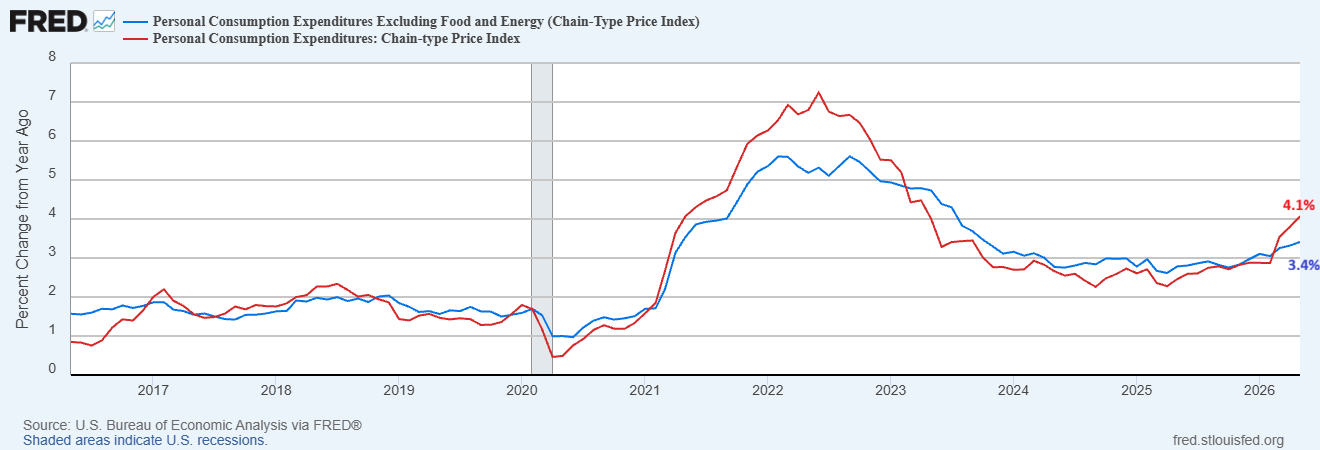
Inflation remains the key factor in the Fed outlook. The headline PCE inflation rate increased to 4.1% for the month of May. The core PCE inflation rate ticked up to 3.4%. This demonstrates that inflation is not a purely energy story.
Service inflation for May is also strong, which suggests that the price pressure is spreading across the economy. This data increases expectations of interest rate hikes in September.
Gold Price Forecast
Every new Gold analysis as it publishes, today's technical signal and key levels, live price — on one page.
See all Gold forecasts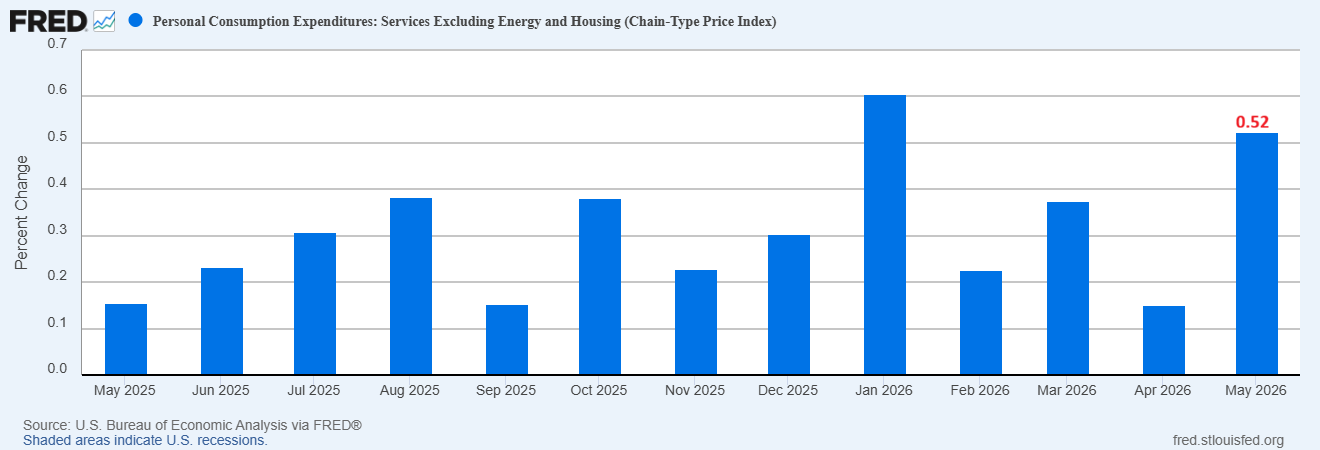
The expectations of higher interest rates have strengthened the US dollar and pushed gold to $4,000. The market is now looking for the US jobs data release today that will drive the next move for the Fed. The strong jobs data could give Fed more room to maintain restrictive policy.
China Buying Supports the Long-Term Gold Case
The bigger support for gold comes from physical demand. China imported approximately 163 tons of gold in May which is the highest since March 2024. In the first 5 months of 2026, approximately 692 tons were imported, an increase of approximately 76% compared to the same period in 2025.
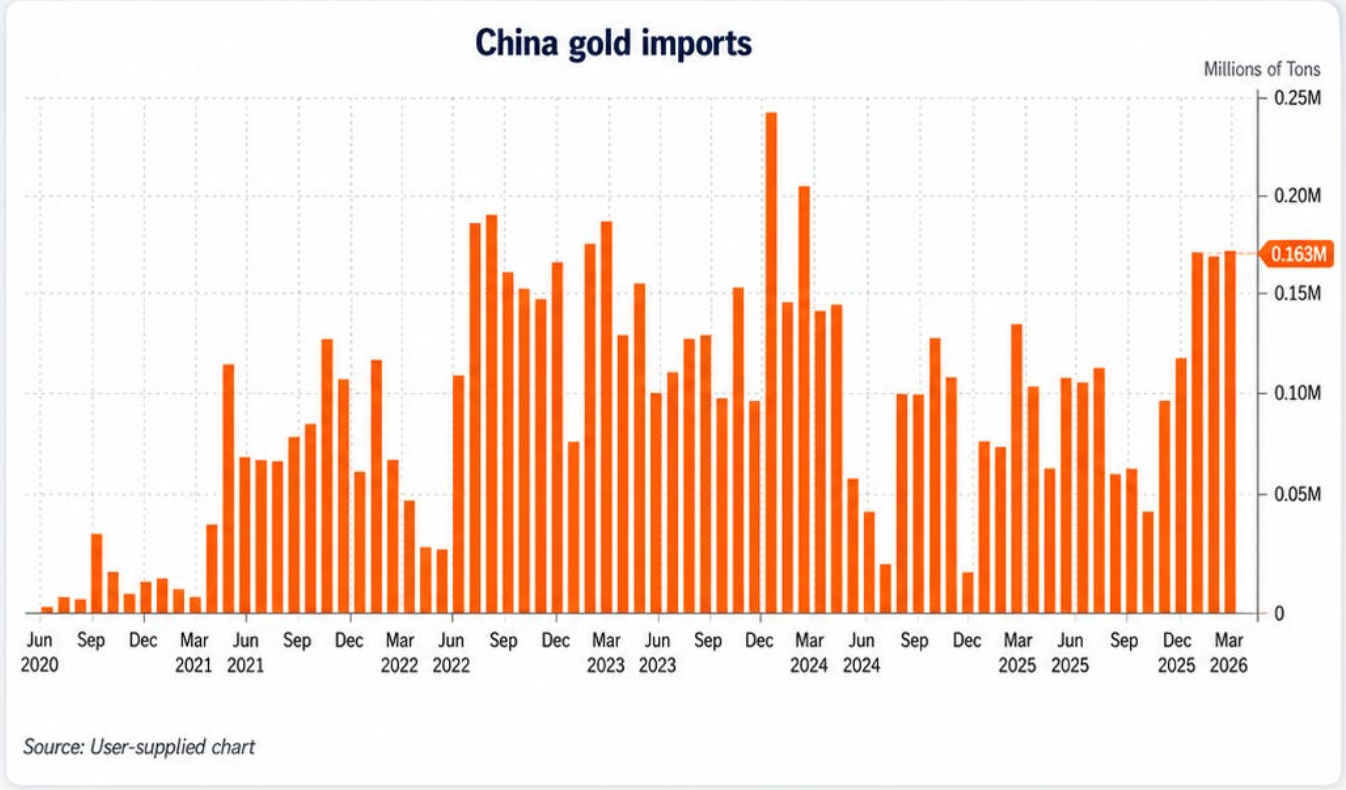
This is significant because speculators are losing interest in the gold futures market while long-term gold buyers are taking advantage of the gold correction to accumulate gold. That creates a split market. The short-term traders are selling due to the strength of the US dollar and strategic buyers are buying as gold continues to maintain its strength in real terms.
This creates pressure on gold in the short term but it does not damage the long-term bull case. While the dollar may appear strong in terms of currencies, gold is still strong on the long cycle against the dollar. Since China keeps buying on weakness, the ongoing correction could turn out to be a part of a larger accumulation process before gold’s next major trend reversal begins.
U.S. Dollar Index Breakout Puts Gold Support in Focus
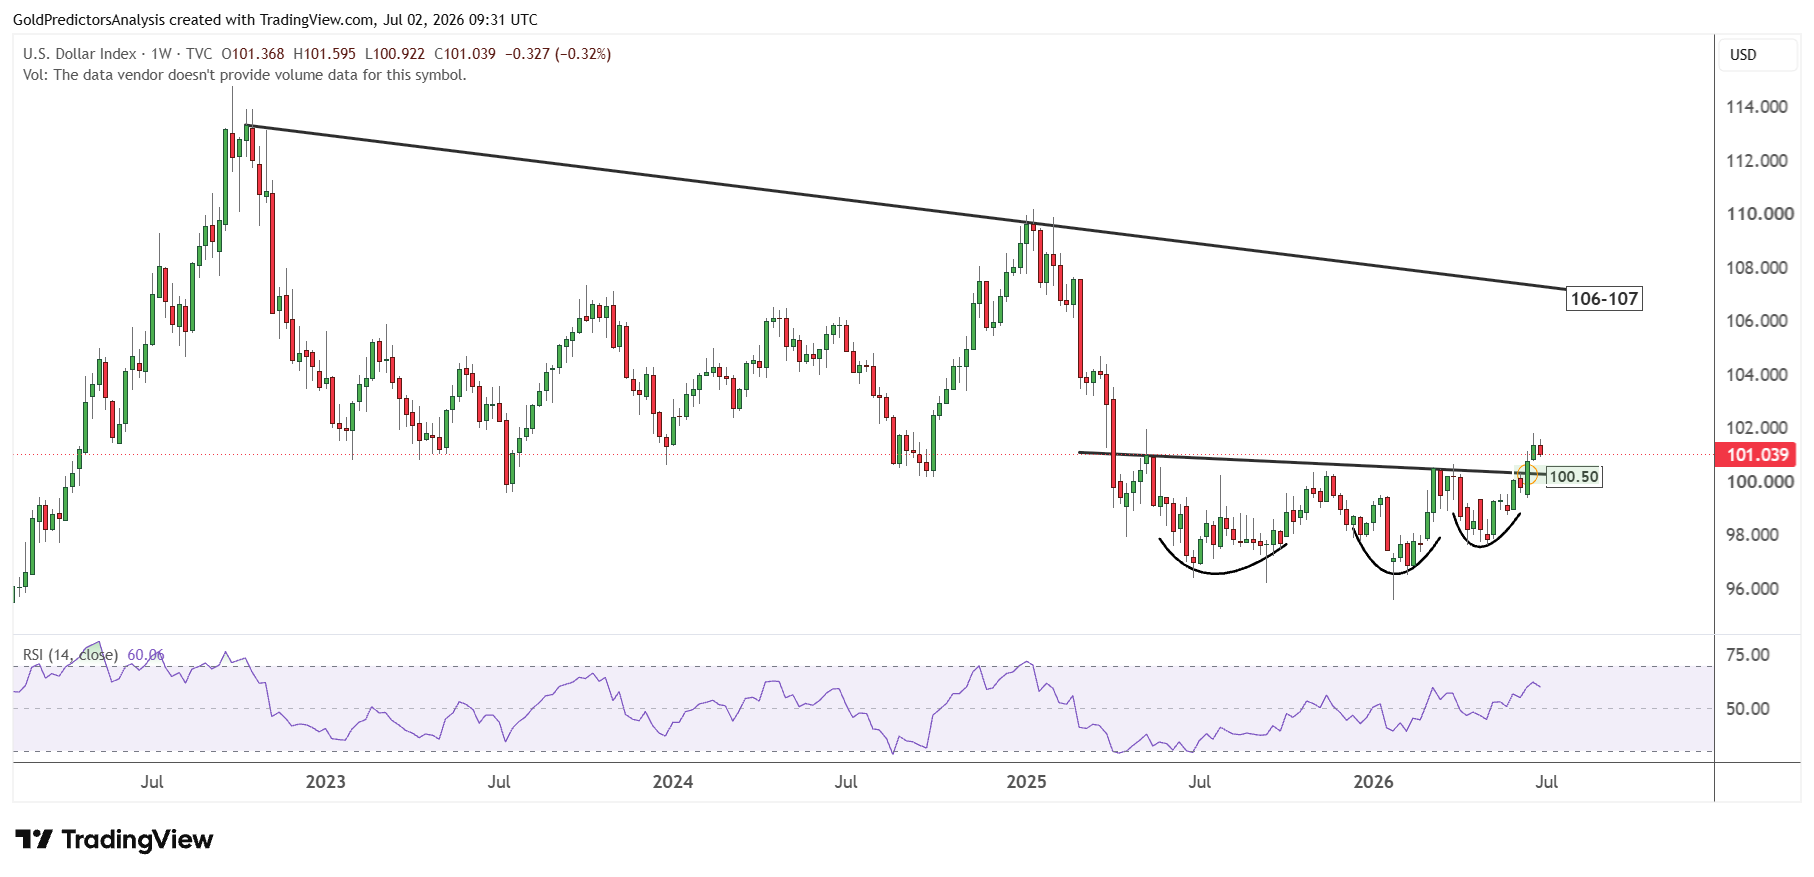
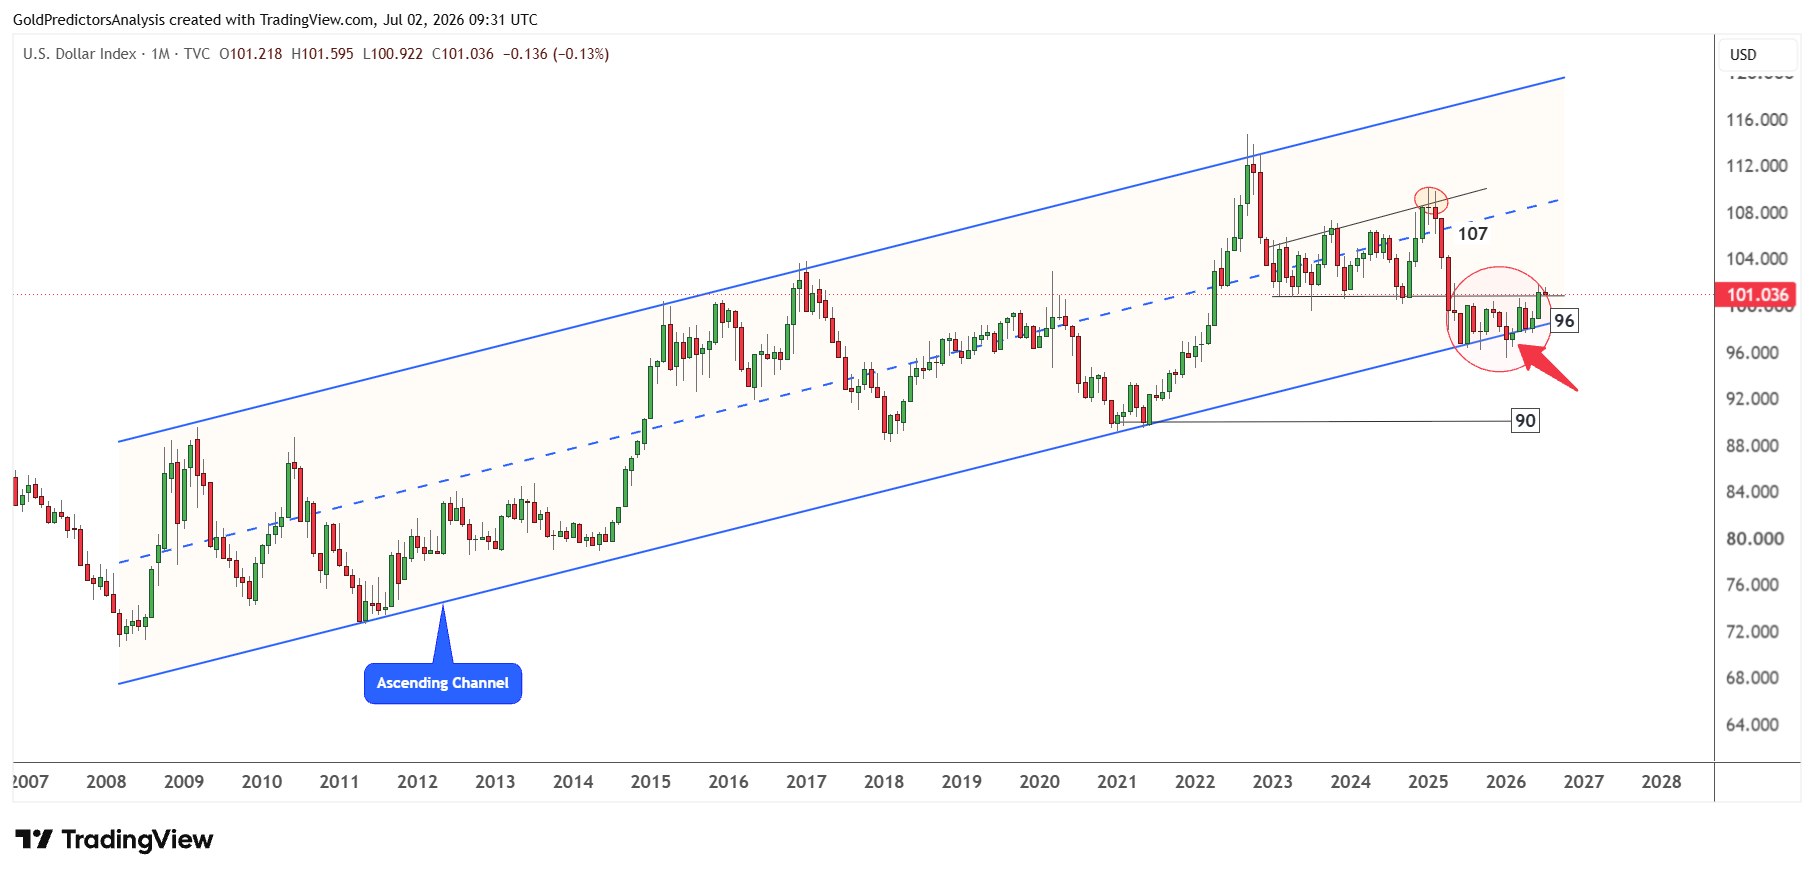
The U.S. Dollar Index has broken the 100.50 level after forming a strong basing pattern from May 2025 to June 2026. This basing pattern suggests that the U.S. dollar has been consolidating and compressing within a structure. This breakout indicates that the dollar can move towards the 103 level in the short term.
But the U.S. Dollar Index must remain above the 100 level in the short term to keep this breakout open. If the index remains above the 100 level, then the next move in the dollar may develop towards the 104 level in the short term.
It is interesting to note that the monthly chart for the U.S. Dollar Index shows strong consolidation from June 2025 to June 2026. This consolidation happened at the edge of the ascending channel where the low was formed at 95.55. After forming this low within the ascending channel, the index recovered above the 100.50 level in June 2026. This suggests that the dollar may remain strong in the short term which may keep spot gold prices under pressure.
The chart below shows a strong inverse correlation between gold and the U.S. dollar, even in the short term. The gold price reached a high of $5,602 in January 2026 when the U.S. Dollar Index hit a low of 95.55. The U.S. Dollar Index broke the 100.50 level in June 2026 when gold prices broke below $4,100.
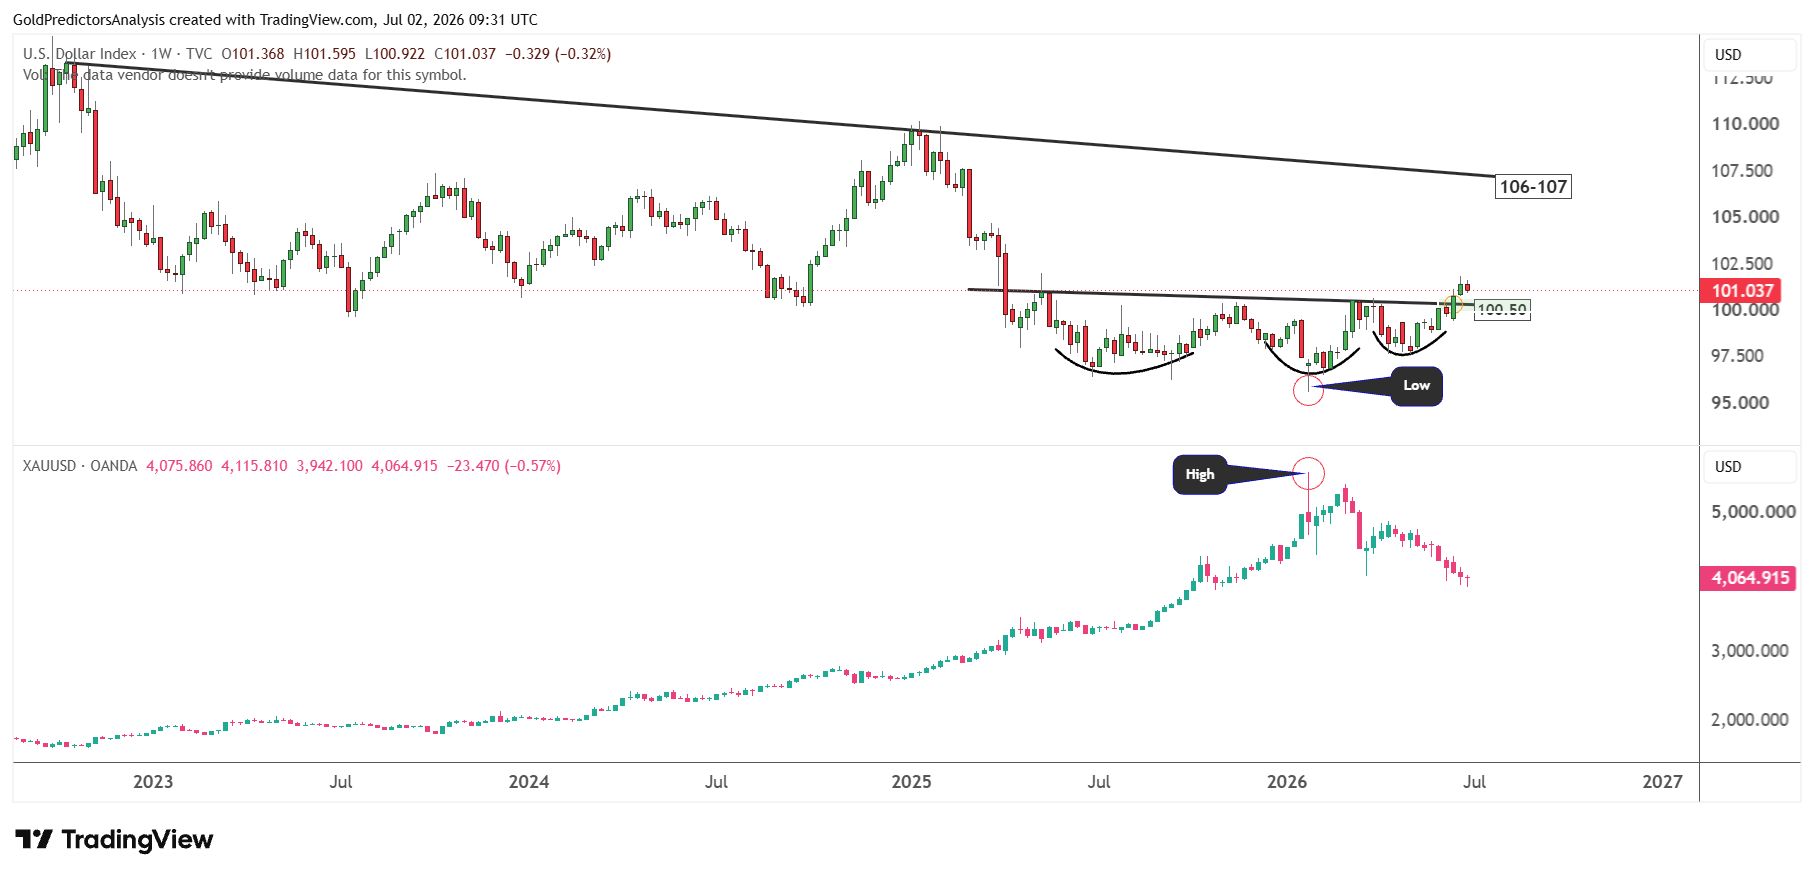
Therefore, if the U.S. Dollar Index continues to move higher from here after forming support at the 100 level, it may likely keep gold prices under pressure.
Gold to Dollar Ratio Shows Gold Strength in Real Terms
Despite the strong breakout, the U.S. dollar remains relatively weak against gold. This weakness is highlighted in the gold to U.S. Dollar Index chart which shows that the ratio has been trending higher historically.
The consolidation from 1980 to 2003 in the gold-to-U.S. Dollar Index ratio kept the spot gold market under a consolidation pattern. However, a breakout in the ratio in 2003 pushed the spot gold market towards record highs in 2011.
Then again, the consolidation from 2011 to 2023 in the gold-to-U.S. Dollar Index ratio kept the gold market under a consolidation pattern, and the breakout above the 20 level in 2023 has pushed the ratio to new record highs.
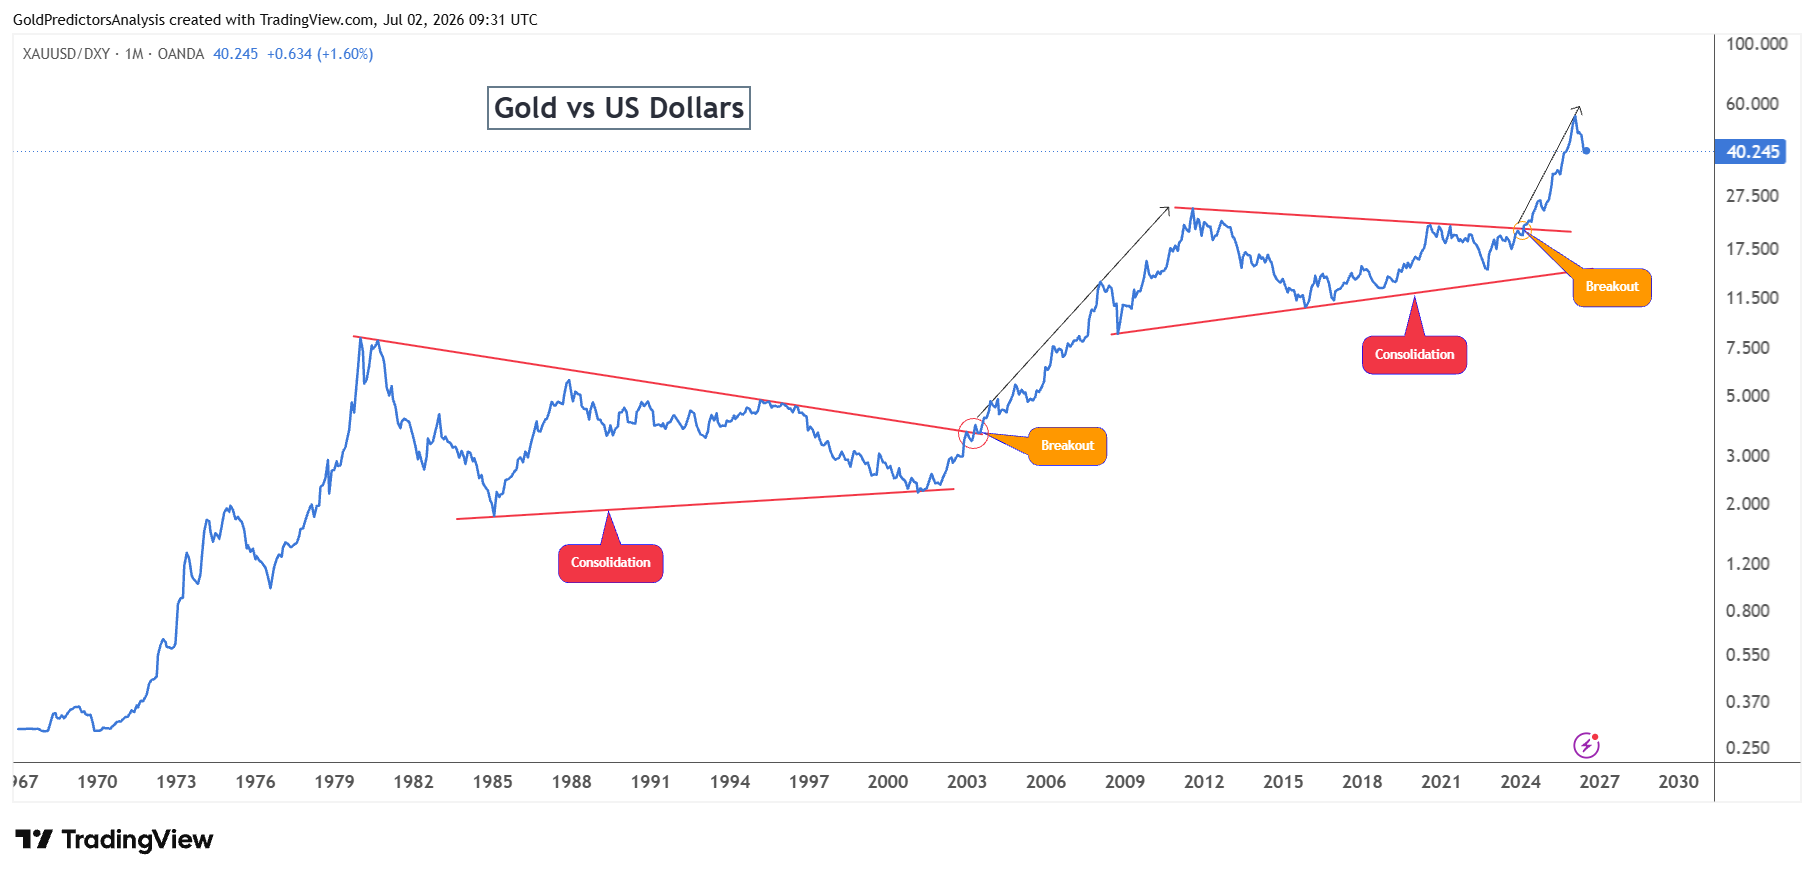
Now, the ratio is correcting lower, which is pushing the gold market towards the support zones. But the gold market will likely find support again due to the constructive price action.
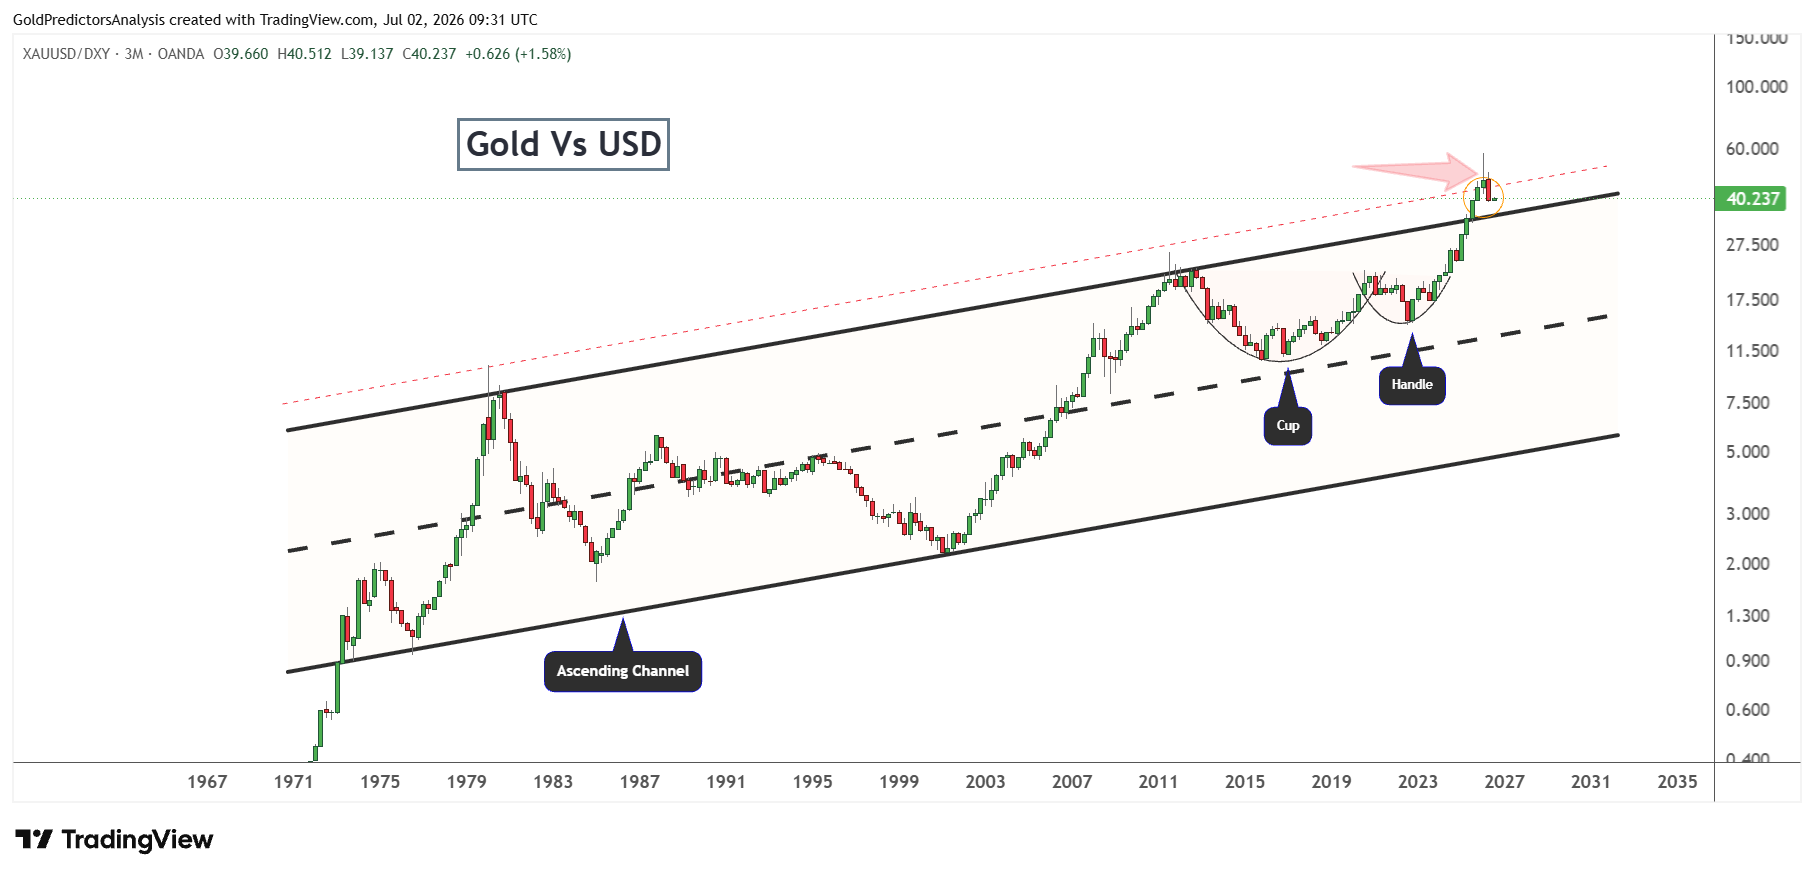
The recent correction in gold is also due to the extension in the gold-to-U.S. Dollar Index ratio above the 20 level. The breakout above the 20 level triggered a correction back towards the breakout of the ascending channel pattern. However, the emergence of a cup-and-handle pattern within the ascending channel indicates a constructive rally in the ratio. This rally in the ratio supports the strong bull market in gold.
Gold Tests $4,000 Support as Speculators Step Back
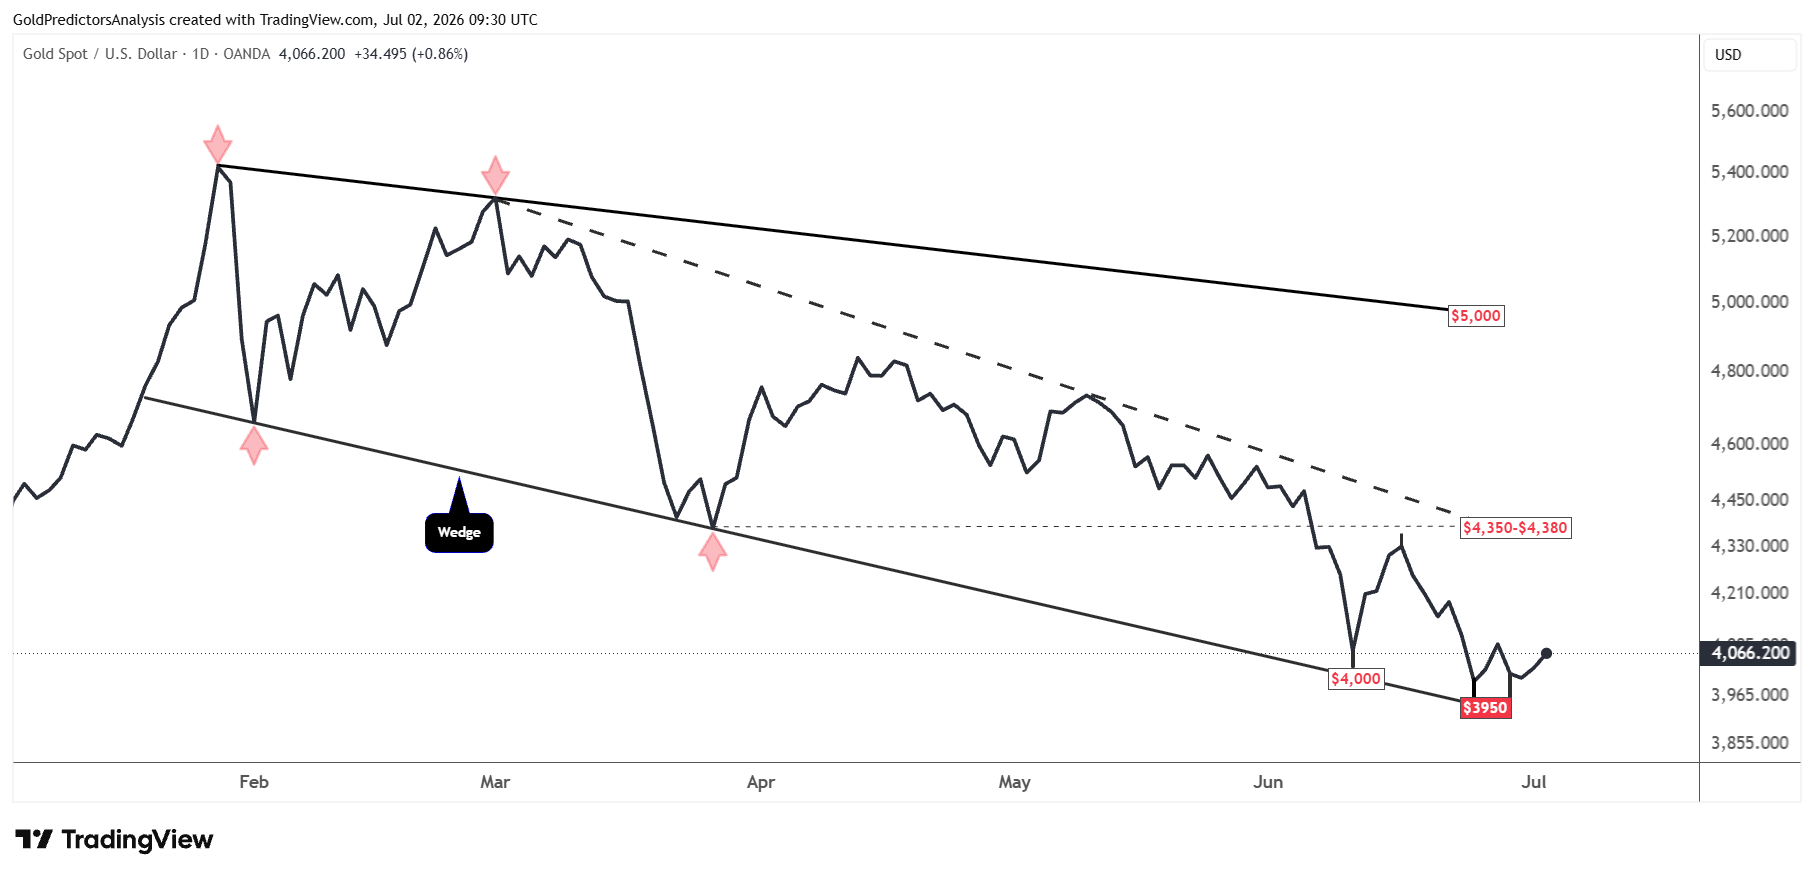
The spot gold price has reached a strong support region at $3,950 as discussed in the previous analysis. This support zone is quite important in the short term, and there might be a rebound towards $4,200.
As long as the gold price remains above $3,950, there is a possibility of a rebound in the gold market. A break below $3,950 will likely put further pressure on the gold market towards the $3,850 level. On the other hand, a break above $4,350 will likely put positive momentum in gold towards $5,000. The US employment data today will likely drive the next move in the gold market.
Market Risks for Gold Prices
The biggest risk for gold is the U.S. dollar. The strong jobs data could increase the expectations of Fed rate hikes. This would keep the US dollar above 100.50 and push it to 103-104. This rally may keep the gold prices under pressure below $4,000. A break below $3,950 may push the spot gold further down to $3,850.
But the downside risk may be limited as long as long-term buyers keep buying gold. Physical demand remains strong during the correction, as seen by China’s huge gold imports. If the US dollar fails to hold the 100 level, the gold price could rally quickly from the support zone. A recovery above $4,350 could push the gold price back to $5,000.
Bottom Line
Gold remains under short-term pressure as the U.S. dollar index holds above the 100.50 breakout level. The strong PCE inflation figures and possible Fed rate hike expectations continue to support the US dollar, keeping gold near the $4,000 support level. The next step will be determined by the US nonfarm payrolls data and the ability of the dollar to continue its rally to the 103-104 area.
But the gold outlook remains bullish in the long term. While the dollar remains strong in currency terms, gold remains strong in real terms against the dollar. China’s strong gold imports also show that the long term buyers are using this correction to accumulate positions. While gold is above $3,950, it could rally to $4,200 and $4,350. A break above $4,350 will strengthen the bull case and open the door for a target of $5,000.
Read more: Debt Fears Strengthen Long-Term Bull Case for Gold and Silver