



Gold (XAUUSD) price remains under pressure as the US dollar breaks above the key 100.50 level, supported by hawkish Fed. The breakout in the US dollar has strengthened the bearish case for gold while the rise in the 2-year Treasury yield shows markets are pricing a tighter Fed path. Kevin Warsh kept rates unchanged but he focused on price stability. This article discusses the US dollar outlook after the breakout, Fed rate signals, technical levels and market risks that may define the next major move in gold
US Dollar Breakout Puts Gold Under Pressure
The US dollar index broke the 100.50 key level, which is the neckline of the bottom formation process. If the US dollar index successfully closes above this level on Friday, it will likely trigger a positive shift toward 102. If the US dollar index continues to support the 100.50 level after the breakout, it can likely push toward the long-term resistance of the 106 to 107 area. This resistance stemmed from the descending trend line from the September 2022 high.
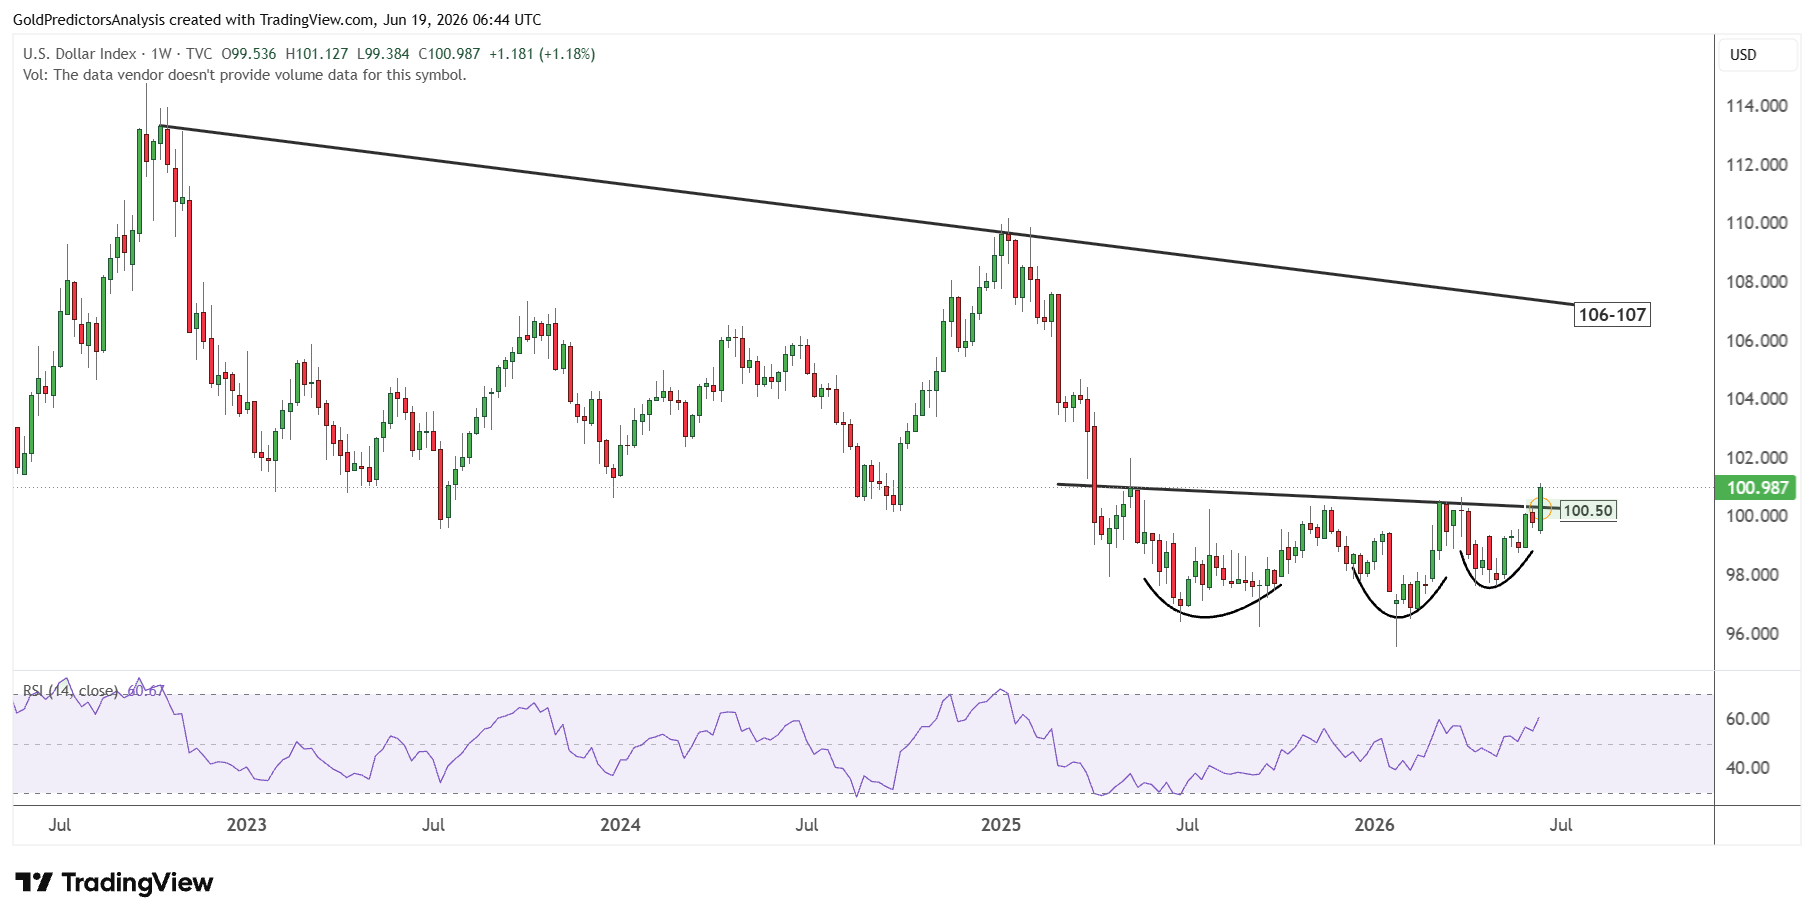
The formation of constructive price action since May 2025 and strong consolidation above 96 indicate bullish momentum in the US dollar index. Moreover, the emergence of the US-Iran war and inflationary pressure has triggered a positive shift in the US dollar index. This shift can push the US dollar higher in the near term.
The daily chart of the US dollar index also shows a double bottom above 97.70. This pattern indicates constructive price action in the US dollar index. The neckline of this double bottom pattern was broken at the 99.40 level. This breakout created a short term rally in the US dollar index.
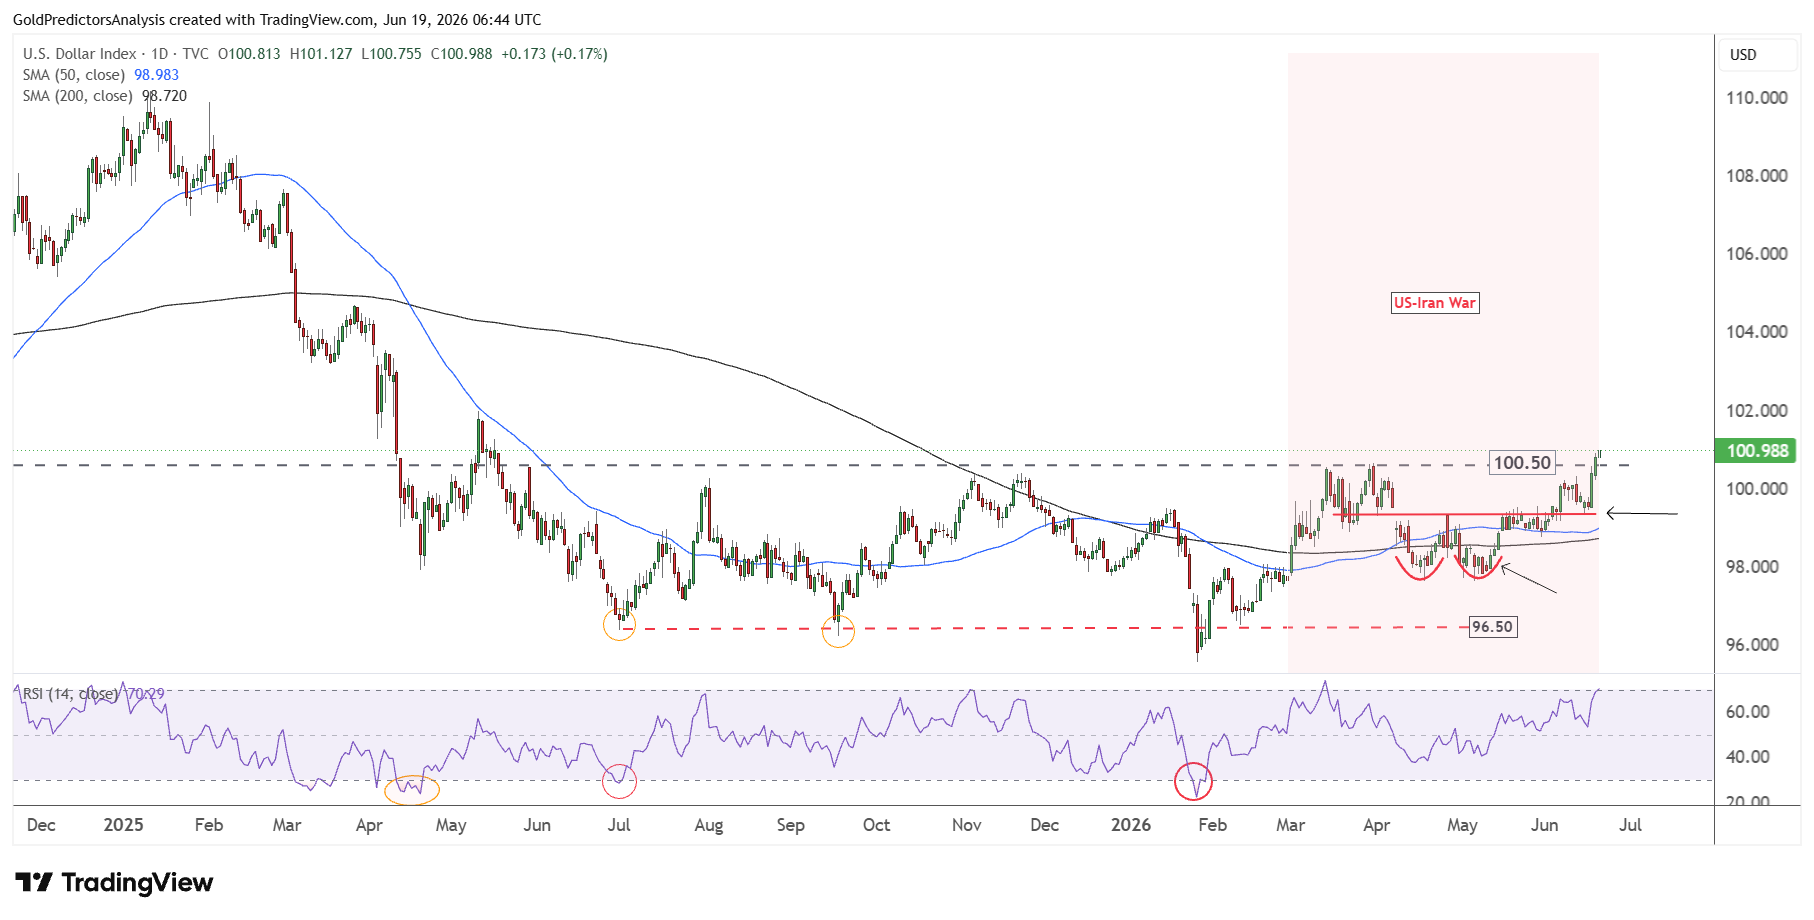
But traders must keep a close eye on the index if the US dollar reverses from here and forms a fake breakout. A break below 99.40 will indicate a reversal in the rally and push the index back into the consolidation zone of 96 and 100.50.
Gold Price Forecast
Every new Gold analysis as it publishes, today's technical signal and key levels, live price — on one page.
See all Gold forecastsFed Rate Bets and Treasury Yields Strengthen Bearish Case for XAUUSD
The breakout in the US dollar was further supported by the Federal Reserve’s announcement. Fed Chair Kevin Warsh left the Fed funds target range unchanged at 3.5% to 3.75% in his first FOMC meeting. The announcement was expected but the tone of the statements and the press conference had surprised the market.
Warsh focused strongly on price stability. He used this term several times and clearly announced his intention to keep the Fed on the path to control the inflation. This was important because markets expected softer tone from him due to easing tensions between the US and Iran. But his comments indicated that the Fed is not pressing for rate cuts now as inflation is above target.
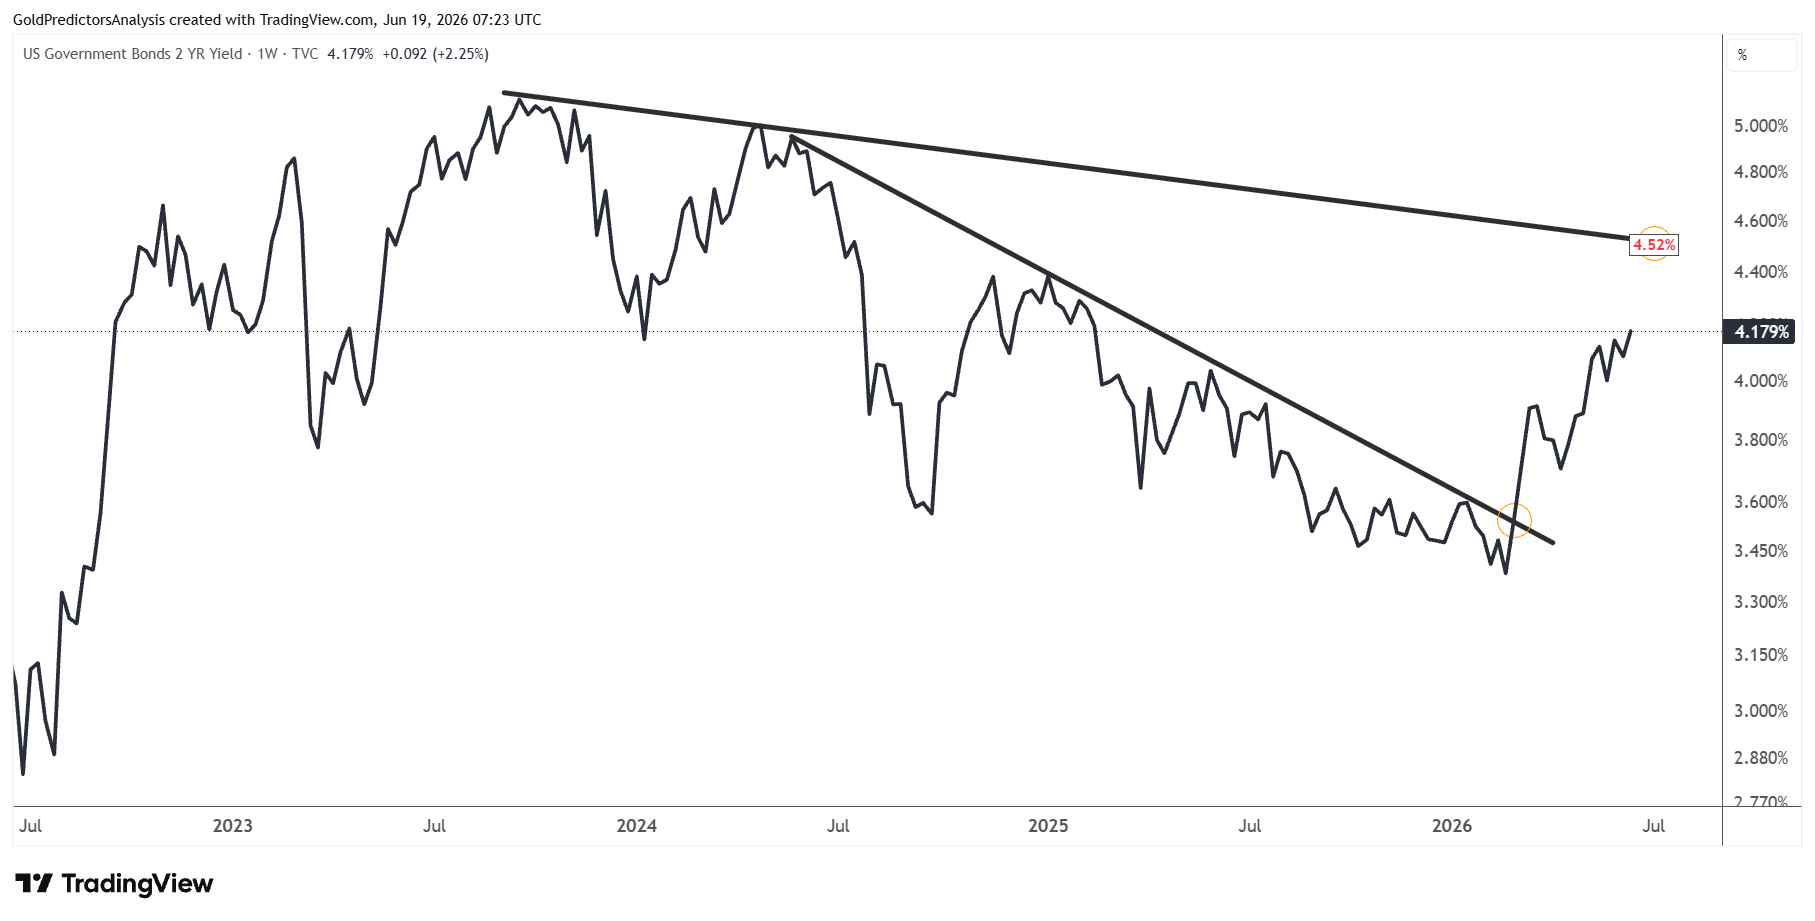
The markets took immediate action to the change. The 2-year Treasury rate rose to 4.17%, indicating a more hawkish policy stance among traders. The short-term trend in the 2-year Treasury yield remains bullish and points to 4.52% as seen in the chart below.
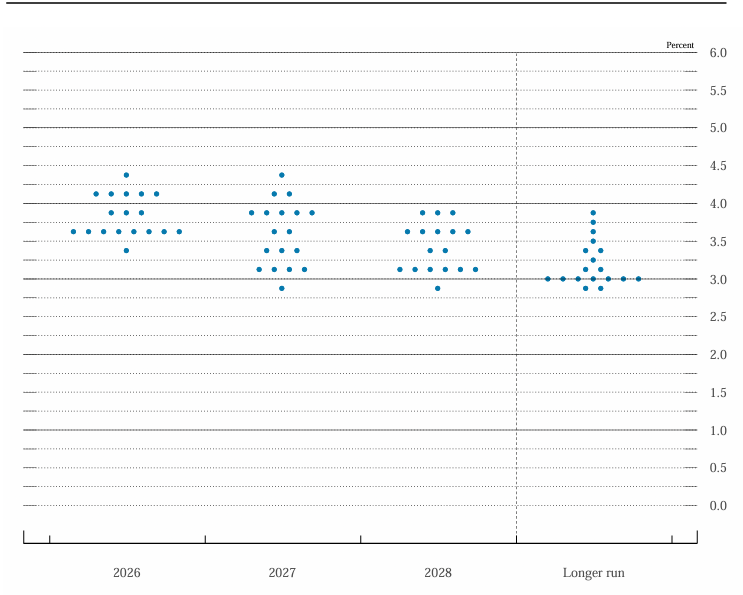
The dot plot also suggests that the odds of a rate hike this year have increased. This increases the demand for the US dollar as it makes assets in dollars more attractive.
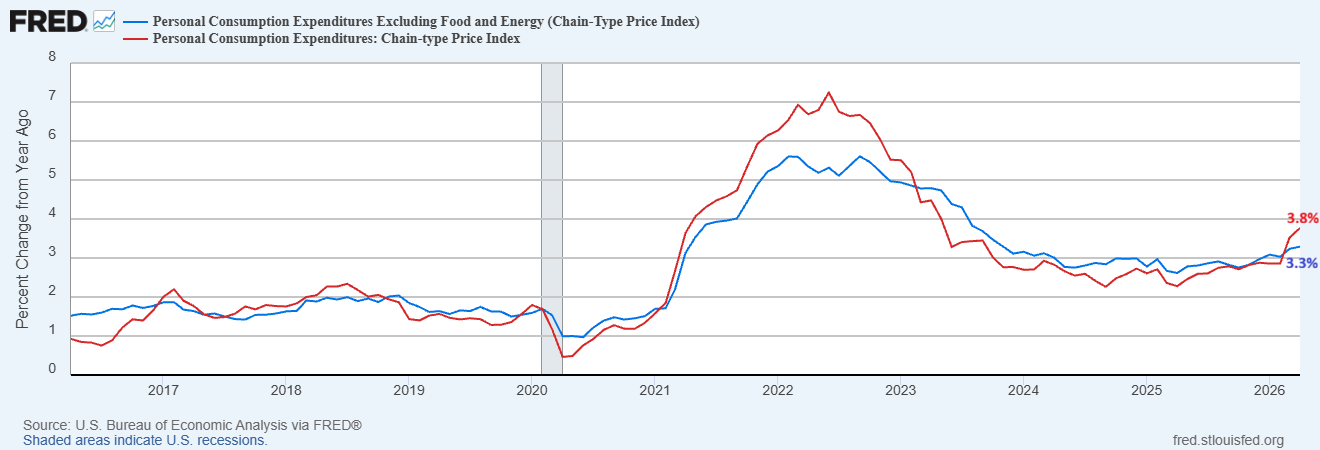
But the inflation remains elevated. The chart below shows that core PCE inflation has remained above the Fed’s 2.0% target for over 5 years and is now increasing once again.
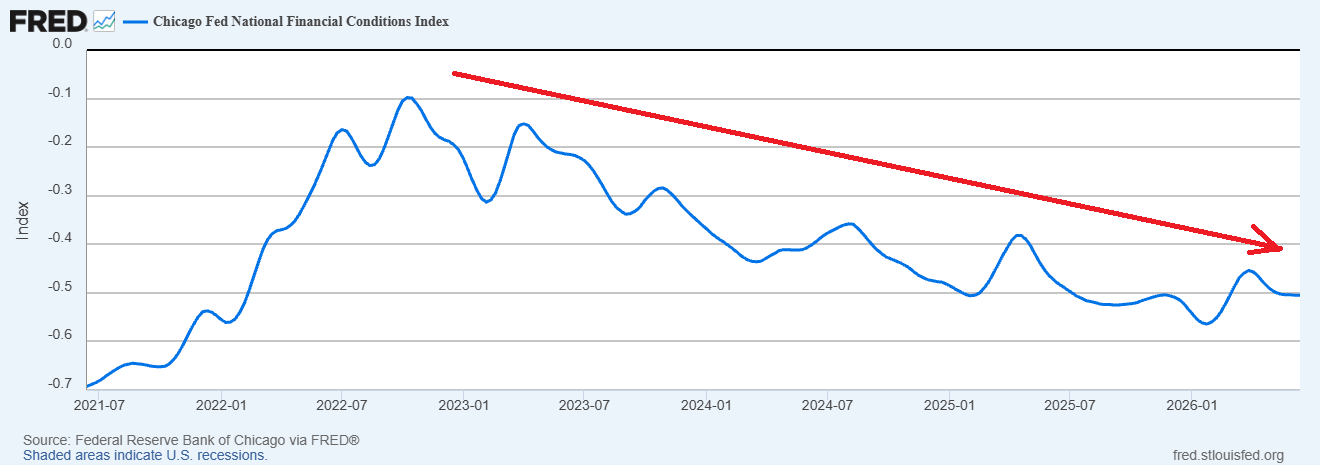
Meanwhile, the Chicago Fed National Financial Conditions Index is very negative. This indicates that the financial conditions remain easy despite the Fed’s hawkish message. The easy conditions are expected to sustain strong credit growth and make it easier to keep inflation under control.
This does not change the long-term bull market for gold but it can weaken the short-term demand support.
Gold Price Fails at $4,350 as $4,000 Support Comes Back
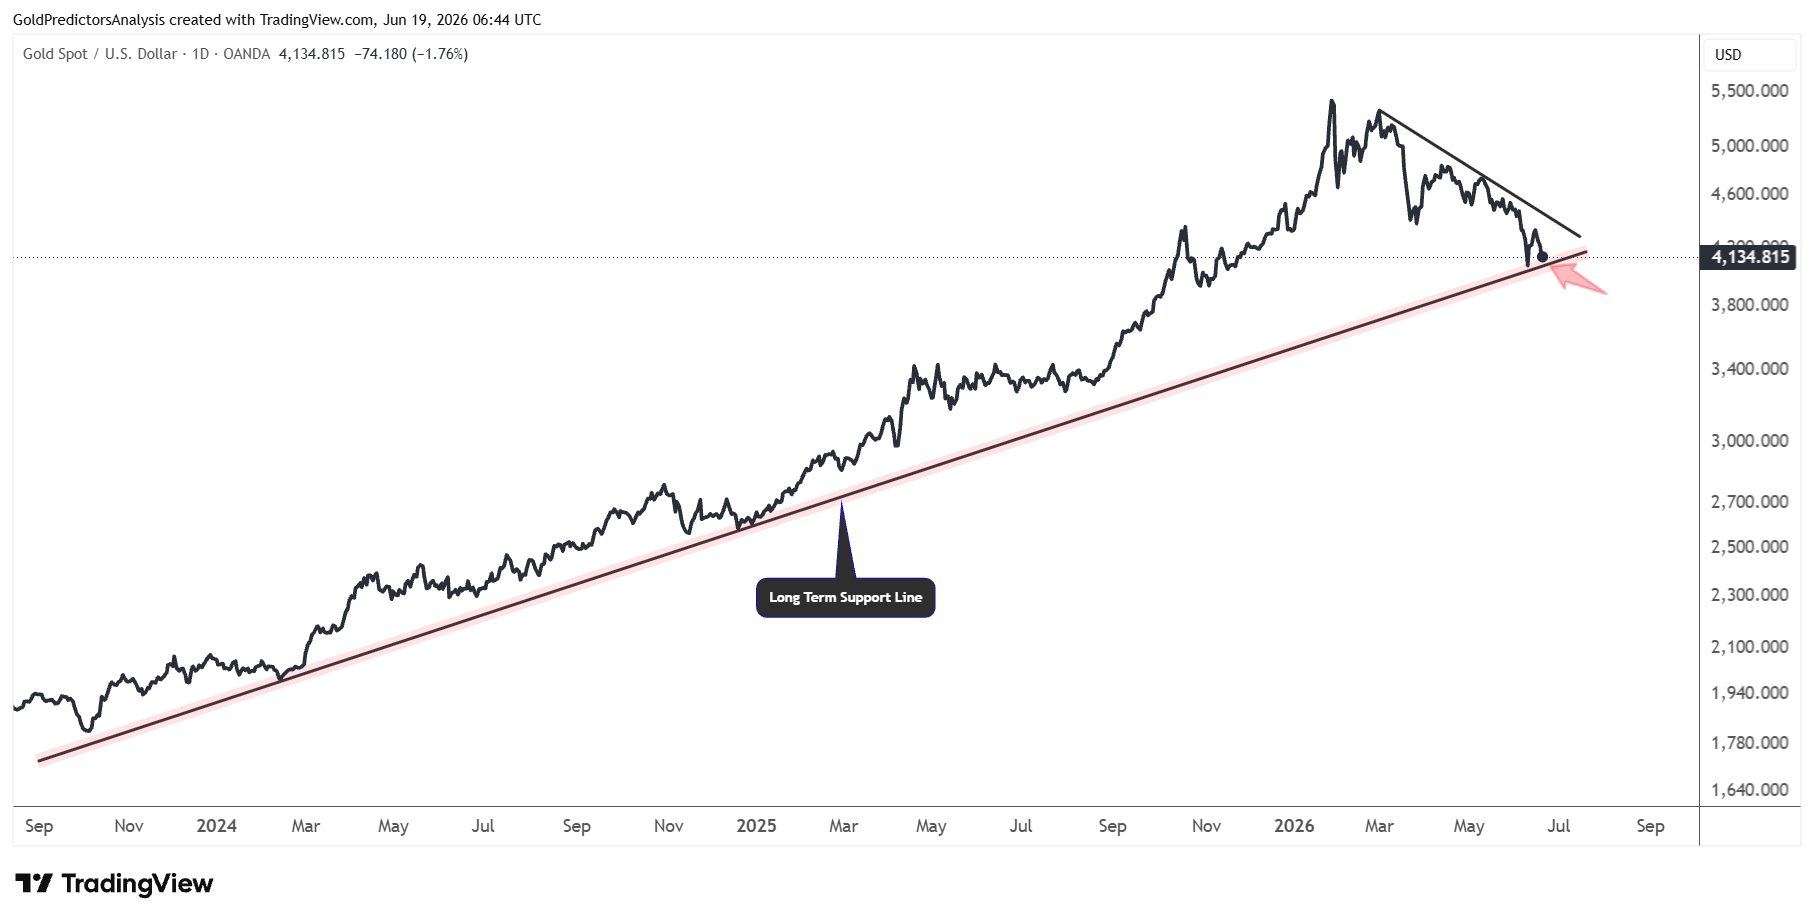
The gold price is again approaching the important support zone. This support is defined by the rising trend line from October 2023. This is the second touch in June at the $4,000 area. This indicates that the price is looking for the next move. A break below $4,000 will likely trigger a deeper correction. But a break above $4,500 will push the gold price to $5,000.
The daily chart for spot gold also shows the strong support within the wedge pattern. The rebound from $4,000 was within the lower support of the wedge at the $4,000 area. Now, the price has failed to close above the $4,350 level and continues to move lower. If the price continues to drop toward the lower support of the wedge, it will likely encounter support at $3,950.
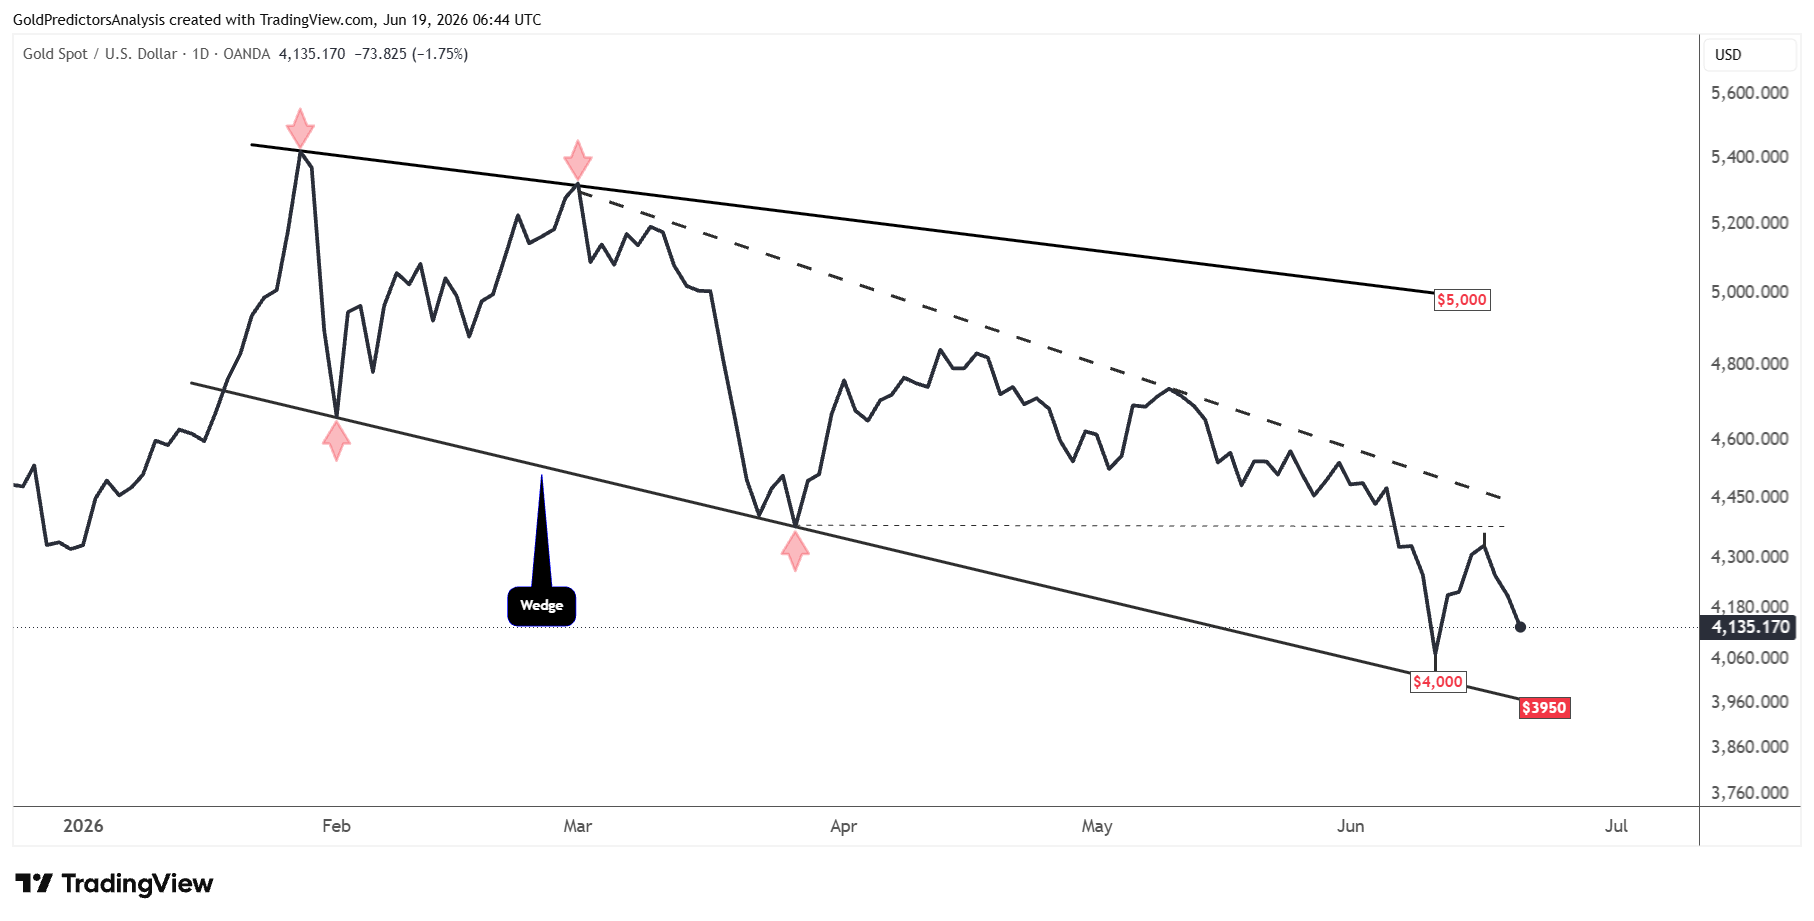
Overall, the price has been consolidating between $4,000 and $5,000 during the past few months. But the momentum since the March 2026 highs remains bearish.
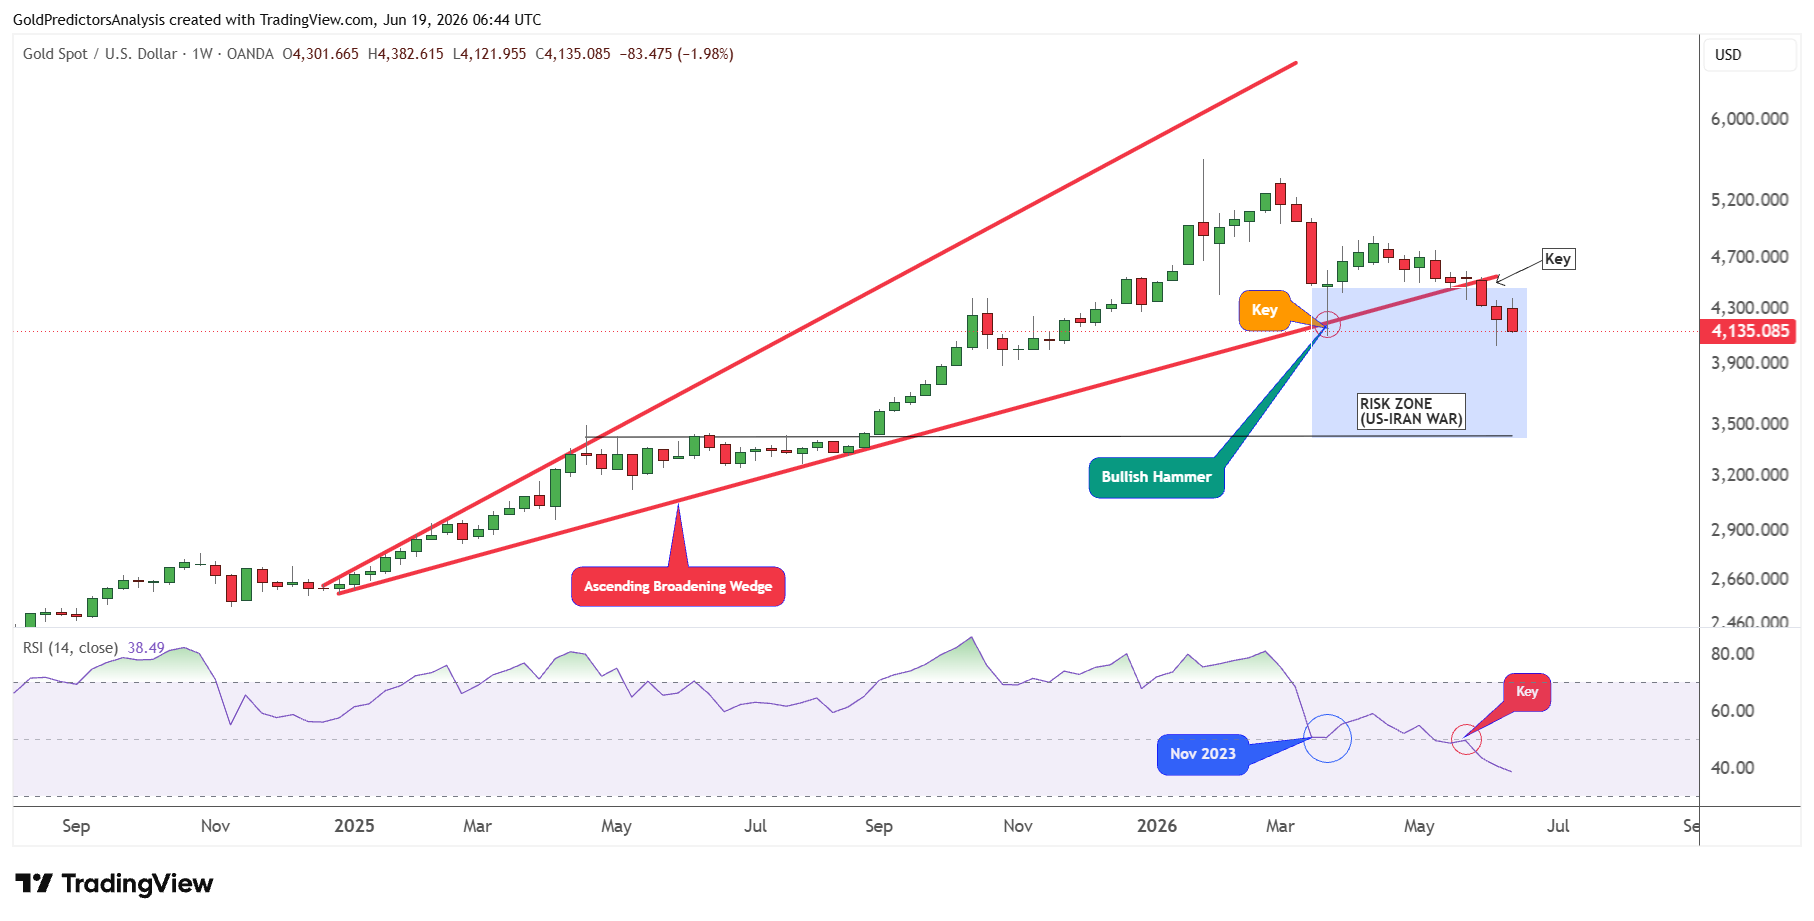
The weekly chart below shows that the spot gold price remains bearish after the breakout from the ascending broadening wedge pattern in June 2026. This analysis shows that a break below $4,500 has increased the risk of a drop toward a broader range due to strong uncertainty from the US-Iran war.
The RSI also remains below the mid-level after the breakdown below $4,500. The blue range highlighted in the chart shows that this correction may be volatile, but it will offer the final buying opportunity for gold to push prices to new record levels.
Key Risks
The biggest risk in the gold market is the strength in the US dollar and US Treasury yields. Gold could remain under selling pressure if the US dollar finds support at the breakout level of 100.50. Additionally, the higher short-term yields also make gold less attractive. This risk will be elevated if the markets continue to price in a Fed rate hike this year. If the gold price breaks the $3,950, the price may face a deeper correction.
But the bearish view also carries risks. Gold could rally back if the US dollar fails to hold the 100.50 support or the US treasury yields correct lower. The safe-haven demand can also be revived after any new stress from the US-Iran war, inflation shock or financial market weakness. The bear market pressure would ease if the spot gold breaks $4,500.
The key risk for this bearish gold view is a failed breakout in the US dollar above 100.50. The index must remain above 100.50 after the breakout. If the index fails the 100.50 level and drops below 99.40, it may trigger deeper correction in the US dollar and push gold prices higher.
Final Words
Gold remains under short term pressure with the US dollar pushing above 100.50 and Fed rate expectations rising. The sharp rise in the 2-year Treasury yield indicates that markets are no longer pricing an easy Fed path. This is bullish for the dollar and bearish for gold. A break below $3,950 in spot gold would indicate a lack of buying interest and could set the stage for deeper correction.
But the long term gold trend remains unchanged. The current weakness appears to be a part of a larger correction after the strong rally in 2025. Gold must rally above $4,500 to ease bearish pressure and restore the bull trend. Traders should monitor the $4,000 support level, Treasury yields and the US dollar’s breakout of 100.50 as major signals for gold in the near term.
Read more: Fed Hawkish Signal Pressures Metals