



Industrials are not the most beat-down sector presently; that still goes to technology. But the chart presents to me something like an opportunity, as it looks like we’ve now got confirmation that the bottom is behind us. A bounce off institutional support for industrials, especially given their current macro outlook, is a forceful bullish signal that the market hasn’t given up on the real economy despite current oil prices still being elevated. While I’ve been watching tech stocks for the bounce, industrials look set to test a new level soon and could confirm a larger breakout despite current macro headwinds.
Policy and Macro Headwinds Are Dying Down (Minus the War)
Over the last year, industrials have survived a strange macro environment. The AI side of the story looked tailor-made for them: more defense spending, more infrastructure demand, and more buildout that requires physical equipment. The policy side with tariffs was engineered to bolster domestic manufacturers.
But industrial firms were unable to pivot as quickly as tariffs were implemented, and many were stuck despite their headwinds being made in their name. For most of the year, the manufacturing PMI was below 50, a sign of contraction. Labor supply contractions, higher pricing on foreign-made inputs, and a reluctance for investment made sure that industrials spent most of 2025 flat. That has changed coming into the new year, however.
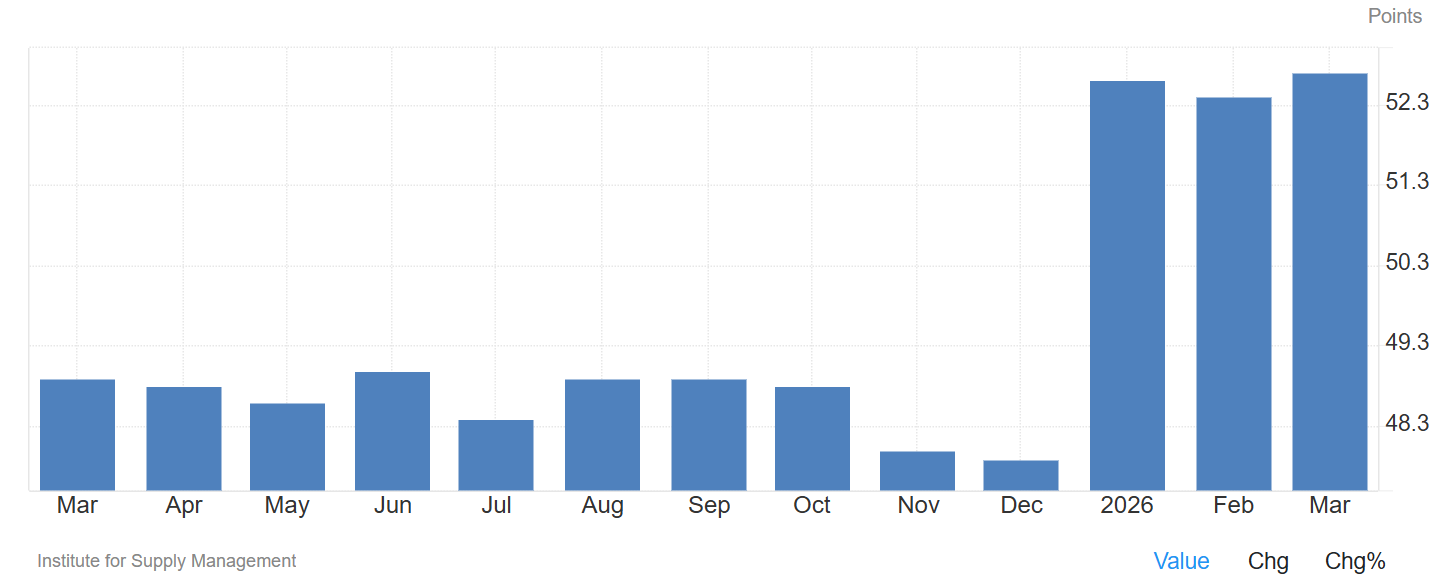
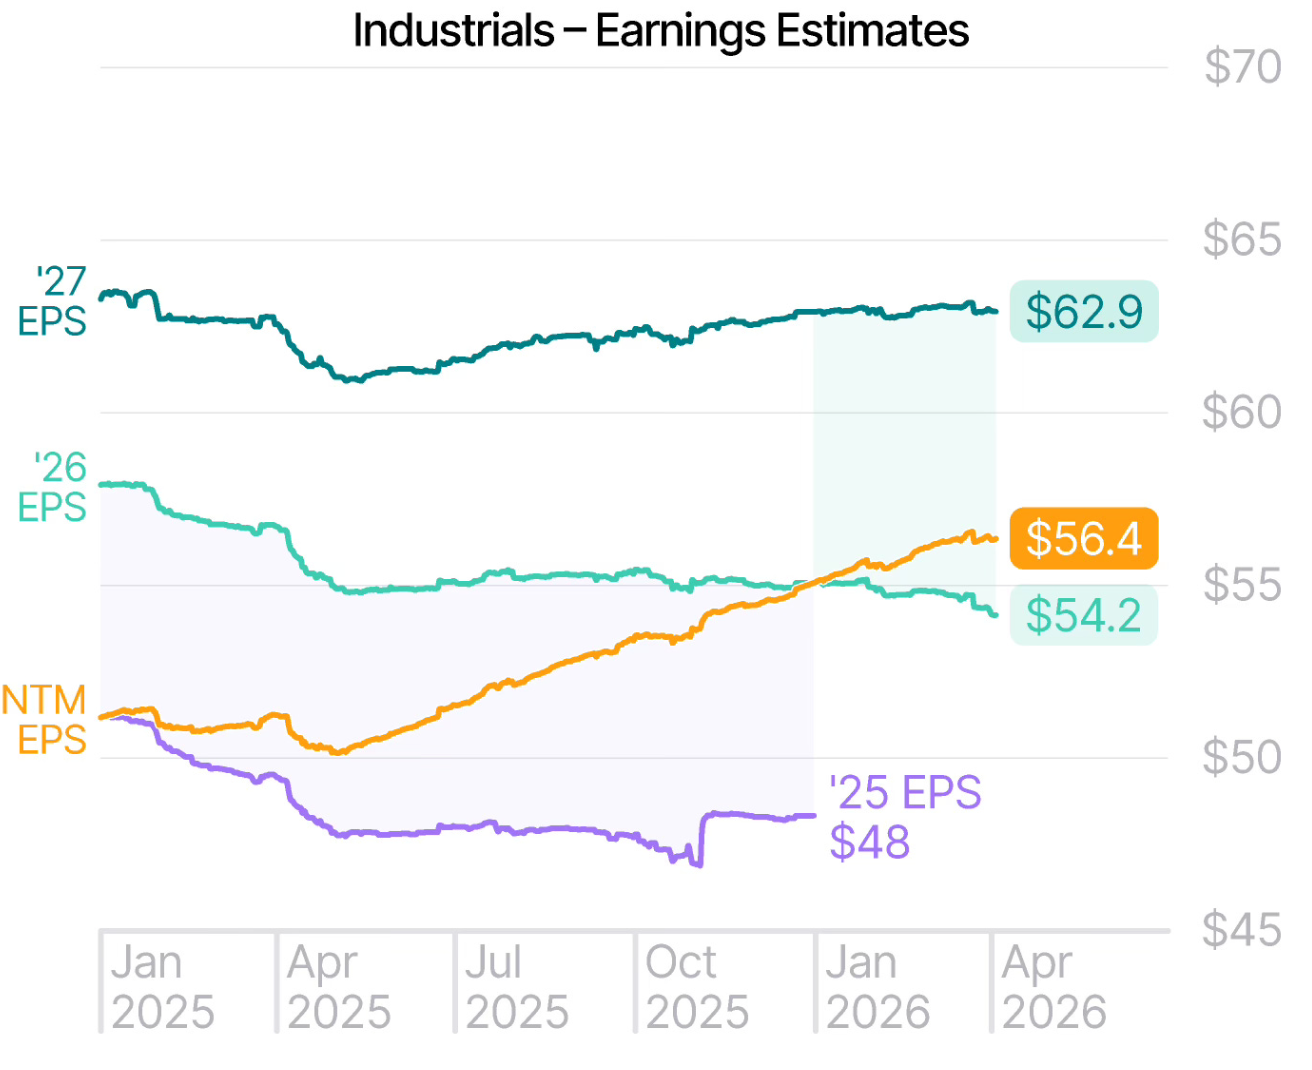
Now that industrials have survived their adjustment period, they are back to a growth cycle (above 50), registering the highest since 2022. Reindustrialization and investment efforts announced last year in response to the tariff threats are now kicking in and being put to work. Their 2027 EPS projections have meaningfully recovered, and their forward earnings are rising fast, outpacing their 2026 EPS projections. That’s a great sign that they will be able to meet or exceed their 2027 trajectory, although that is a very long-term look.
The industrials sector is heavily exposed to aerospace and defense, machinery, transportation, electrical equipment, and construction businesses, which leaves it tied to both the upside of reindustrialization and the downside of geopolitical and cost shocks. That means that when the U.S.-Iran War broke out, it snapped the upside it had made off the good news in PMI.
The bull case is that investors still see a sector with real earnings support from defense budgets, factory investment, and hard-asset spending, all of which are also strategic policy objectives in Washington (although opinions on their efficacy vary).
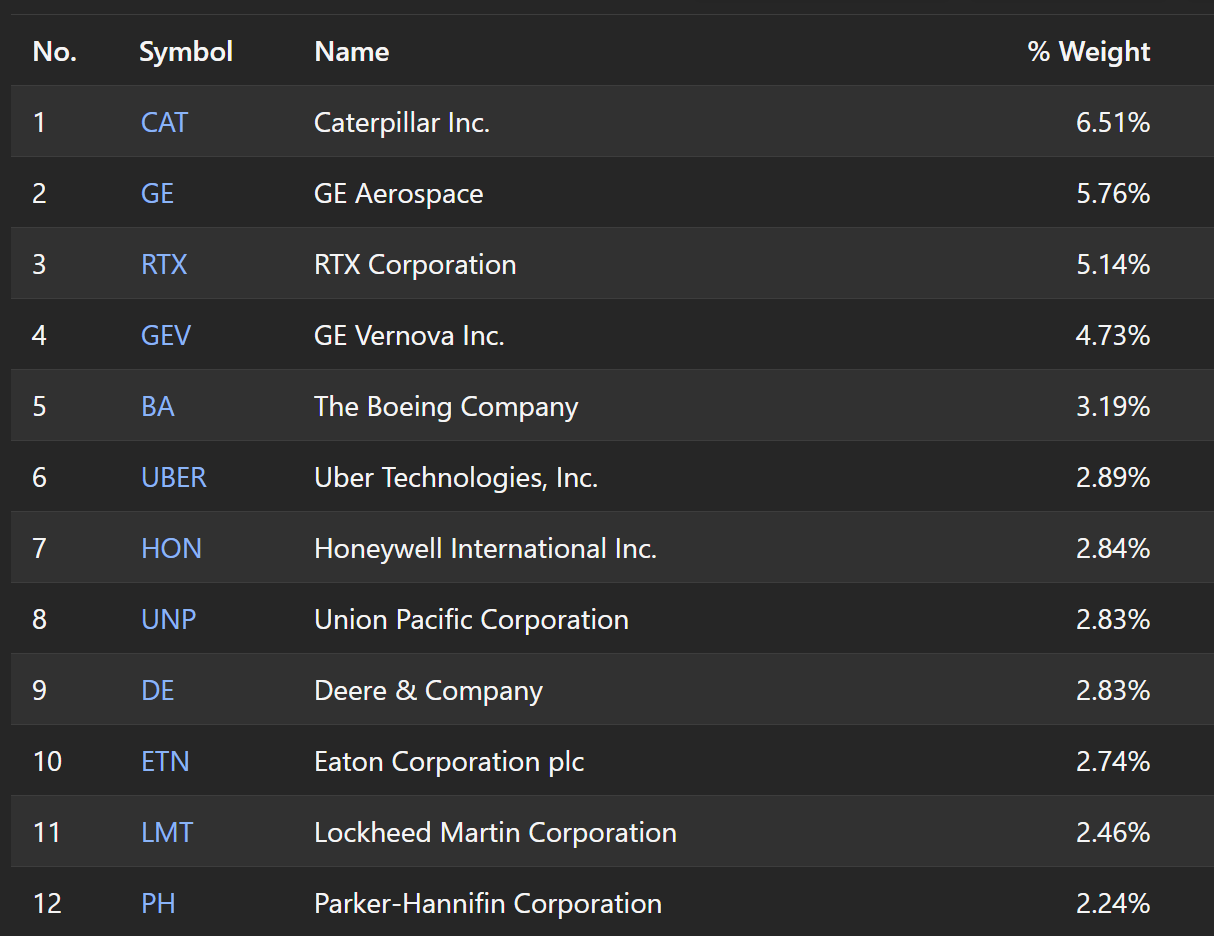
Policy is still tilting further in favor of industrials; what I’ve described is mostly 2025 news. More recently, the Trump administration proposed a $1.5 trillion fiscal 2027 defense budget. This passing Congress would certainly be a boon for the top firms in the industrials sector, which are largely military contractors like GE Aerospace (GE), RTX Corp. (RTX), and Boeing (BA) in the top 5 holdings of the SPDR State Street Industrials ETF (XLI), my preferred trading vehicle for industrials.
The bear case is that tariffs, slower orders due to a weaker consumer, and war-driven inflation strangle that story before it fully plays out. Oil staying elevated above $100 past May would begin to wreak real havoc on manufacturers that rely on cheaper crude for their margins.
XLI Technical Outlook: Bulls Defend The Trend
The 1-year daily chart for XLI still looks constructive, even after the recent war-and-energy-brought-on weakness. This is not a chart that has broken its bullish structure. It is a chart that has cooled off inside an existing uptrend. Hitting and bouncing off the 200-EMA supports this conclusion. It hit the 200-EMA, currently around 157, and bounced off cleanly, with the following candle opening and closing fully above the line.
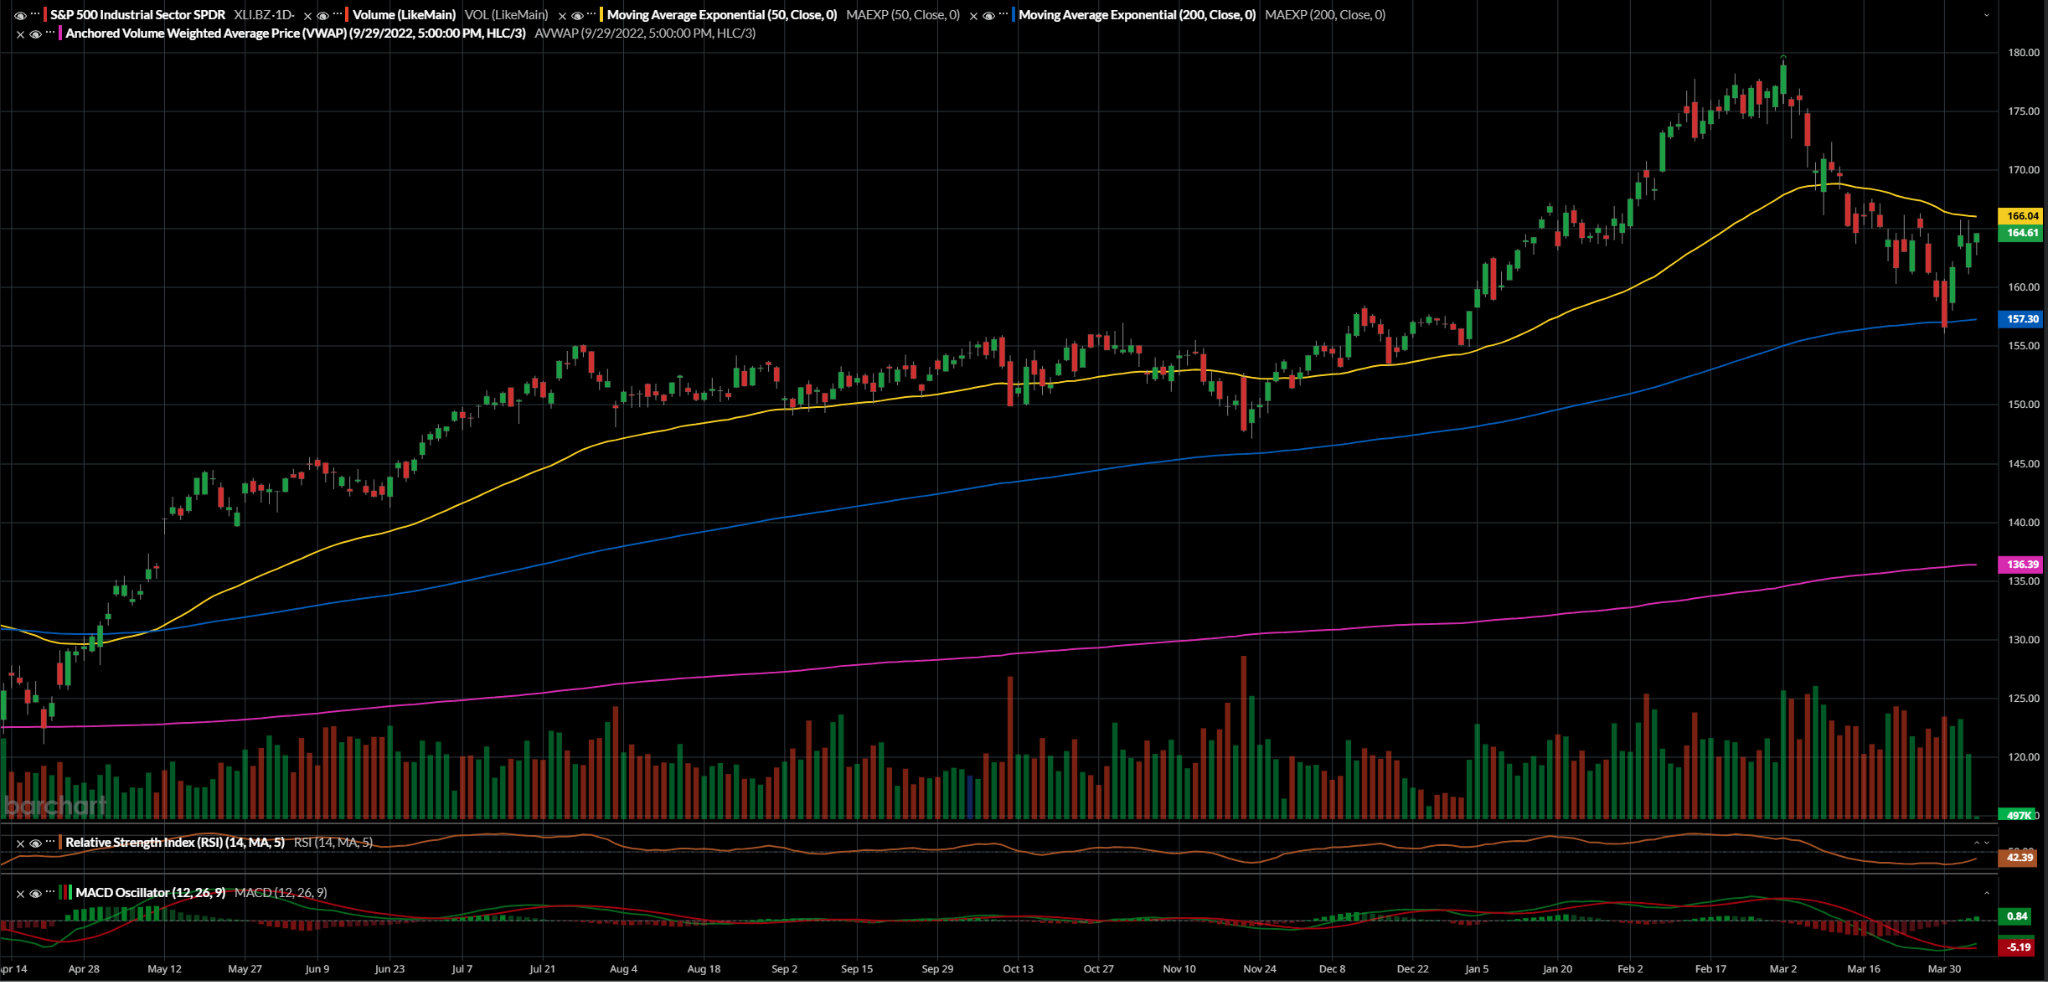
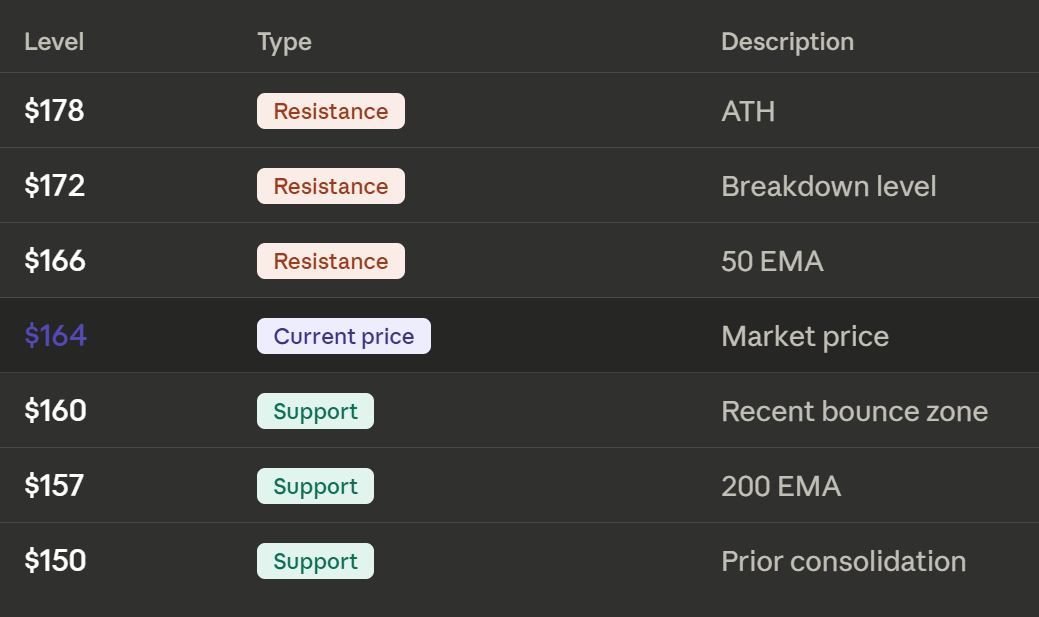
The most critical support level on my chart is the 157 area, where the 200-EMA currently sits and was recently defended by the bulls. That is the line that tells us whether this is still a healthy pullback or the start of something worse; following a retest of the 50-EMA, a failure could send XLI back toward the 200-EMA. Should that fail to hold, it would signal invalidation.
XLI has since moved well above its 200-EMA, now heading to retest the 50-EMA, which it touched with the wicks of the previous two candles. An important note is that the first retest often fails, and so it should be little surprise that this attempt has not broken above yet. The price is still moving upwards following the bounce and is likely to give a more serious retest of the 50-EMA at ~166 in the coming days. If it can break above, that is likely to flip the ~165 level into support.
On the upside, the first resistance level to watch after the 50-EMA is the 172 area. That is the next key level, as it marks the breakdown zone that turned into resistance during the recent slide. If price can fight back through there, then the all-time high near 180 comes back into view.
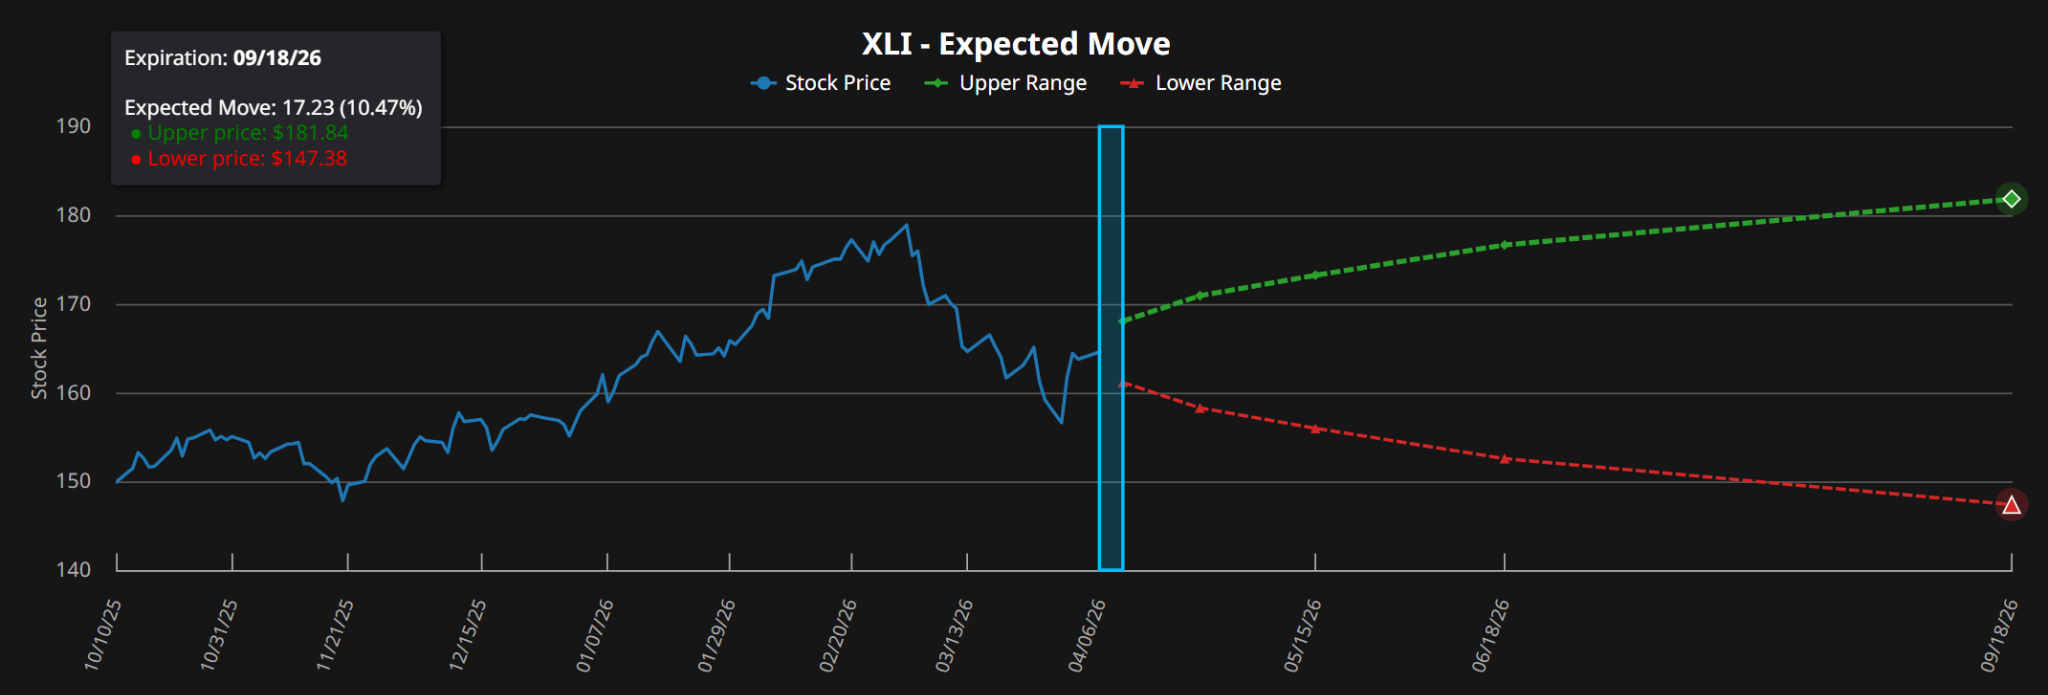
Consider moves this large aren’t inconceivable in the near-future. Options are currently pricing in a ~10.5% move by September, and realized volatility is often higher than what is implied. Good news about peace could spur a rally, especially given that growth is still happening in the sector economically.
From a pattern perspective, this looks like a bullish pullback, or at worst a bear-flag-type consolidation inside a larger uptrend. That is a very normal sequence after a strong rally, even without a war. Markets run, momentum fades, prices pull back into moving averages, and then buyers either step in for continuation or fail and let the trend break; the technical lines held up despite the macro headlines. XLI is sitting in that decision zone now, and a break above the 50-EMA would be confirmation of a continuing rally.
Momentum indicators are mixed but lean slightly bearish. The RSI is currently sitting around 42, which is neutral to slightly weak. That is not an ideal momentum reading, but it is also not abnormal for a bullish pullback. Strong uptrends often find support with RSI in the 40 to 45 range before turning higher again, so this alone does not invalidate the broader bullish case.
The MACD is a little brighter. Momentum is still negative, but the indicator has started to flatten, and the signal lines have crossed. That suggests selling pressure is cooling rather than accelerating, and that bulls were successful in their defense without exhausting themselves. They would still like to see a full crossover to confirm that momentum is turning back in their favor, but for now the key point is that downside momentum no longer looks like it is building aggressively.
Here are the key levels to watch for bulls and bears:
Conclusion
The recent industrials sector bounce seen in the XLI ETF matters because it signals the belief from institutional buyers that industrials aren’t dead yet, and that they are willing to buy. That creates a great floor for a trade, especially if the bounce can lead to a breakout above the ~166 level.
Breaking above the 50-EMA would be significant for XLI’s bull case, especially since it has macro tailwinds now pushing it up rather than down as they were in the last year. This change in macro orientation is hampered by the current situation with oil prices, and a lasting energy crisis keeping prices higher will certainly derail this thesis.
I am still hopeful and pricing in that peace is near, although I am not making any bets on its shape or form. That means that the bounce is real here, and the bottom is behind us. Should XLI retest the 200-EMA and fail, that would be invalidation, and the bears would have full control. But for now, I think the benefit of the doubt belongs to the bulls; XLI bounced where it needed to bounce, and unless oil or geopolitics deliver another worse shock than what’s already happened, industrials look set up for a continuation move rather than a collapse.