


The market’s old enemy may be stirring once again. With geopolitical tensions elevated, energy markets remaining volatile, and the possibility of supply disruptions still hanging over the global economy, investors are beginning to ask a question many thought had been settled years ago: Could the inflation dynamics of the 1970’s be re-emerging?
While history never repeats flawlessly, when comparing the current inflation cycle to that of the late 1960’s and through the 1970’s, several striking similarities emerge. And the similarities may be noteworthy enough for investors, policymakers, and market participants to take them seriously.
The Inflation Lessons Of The 1970’s
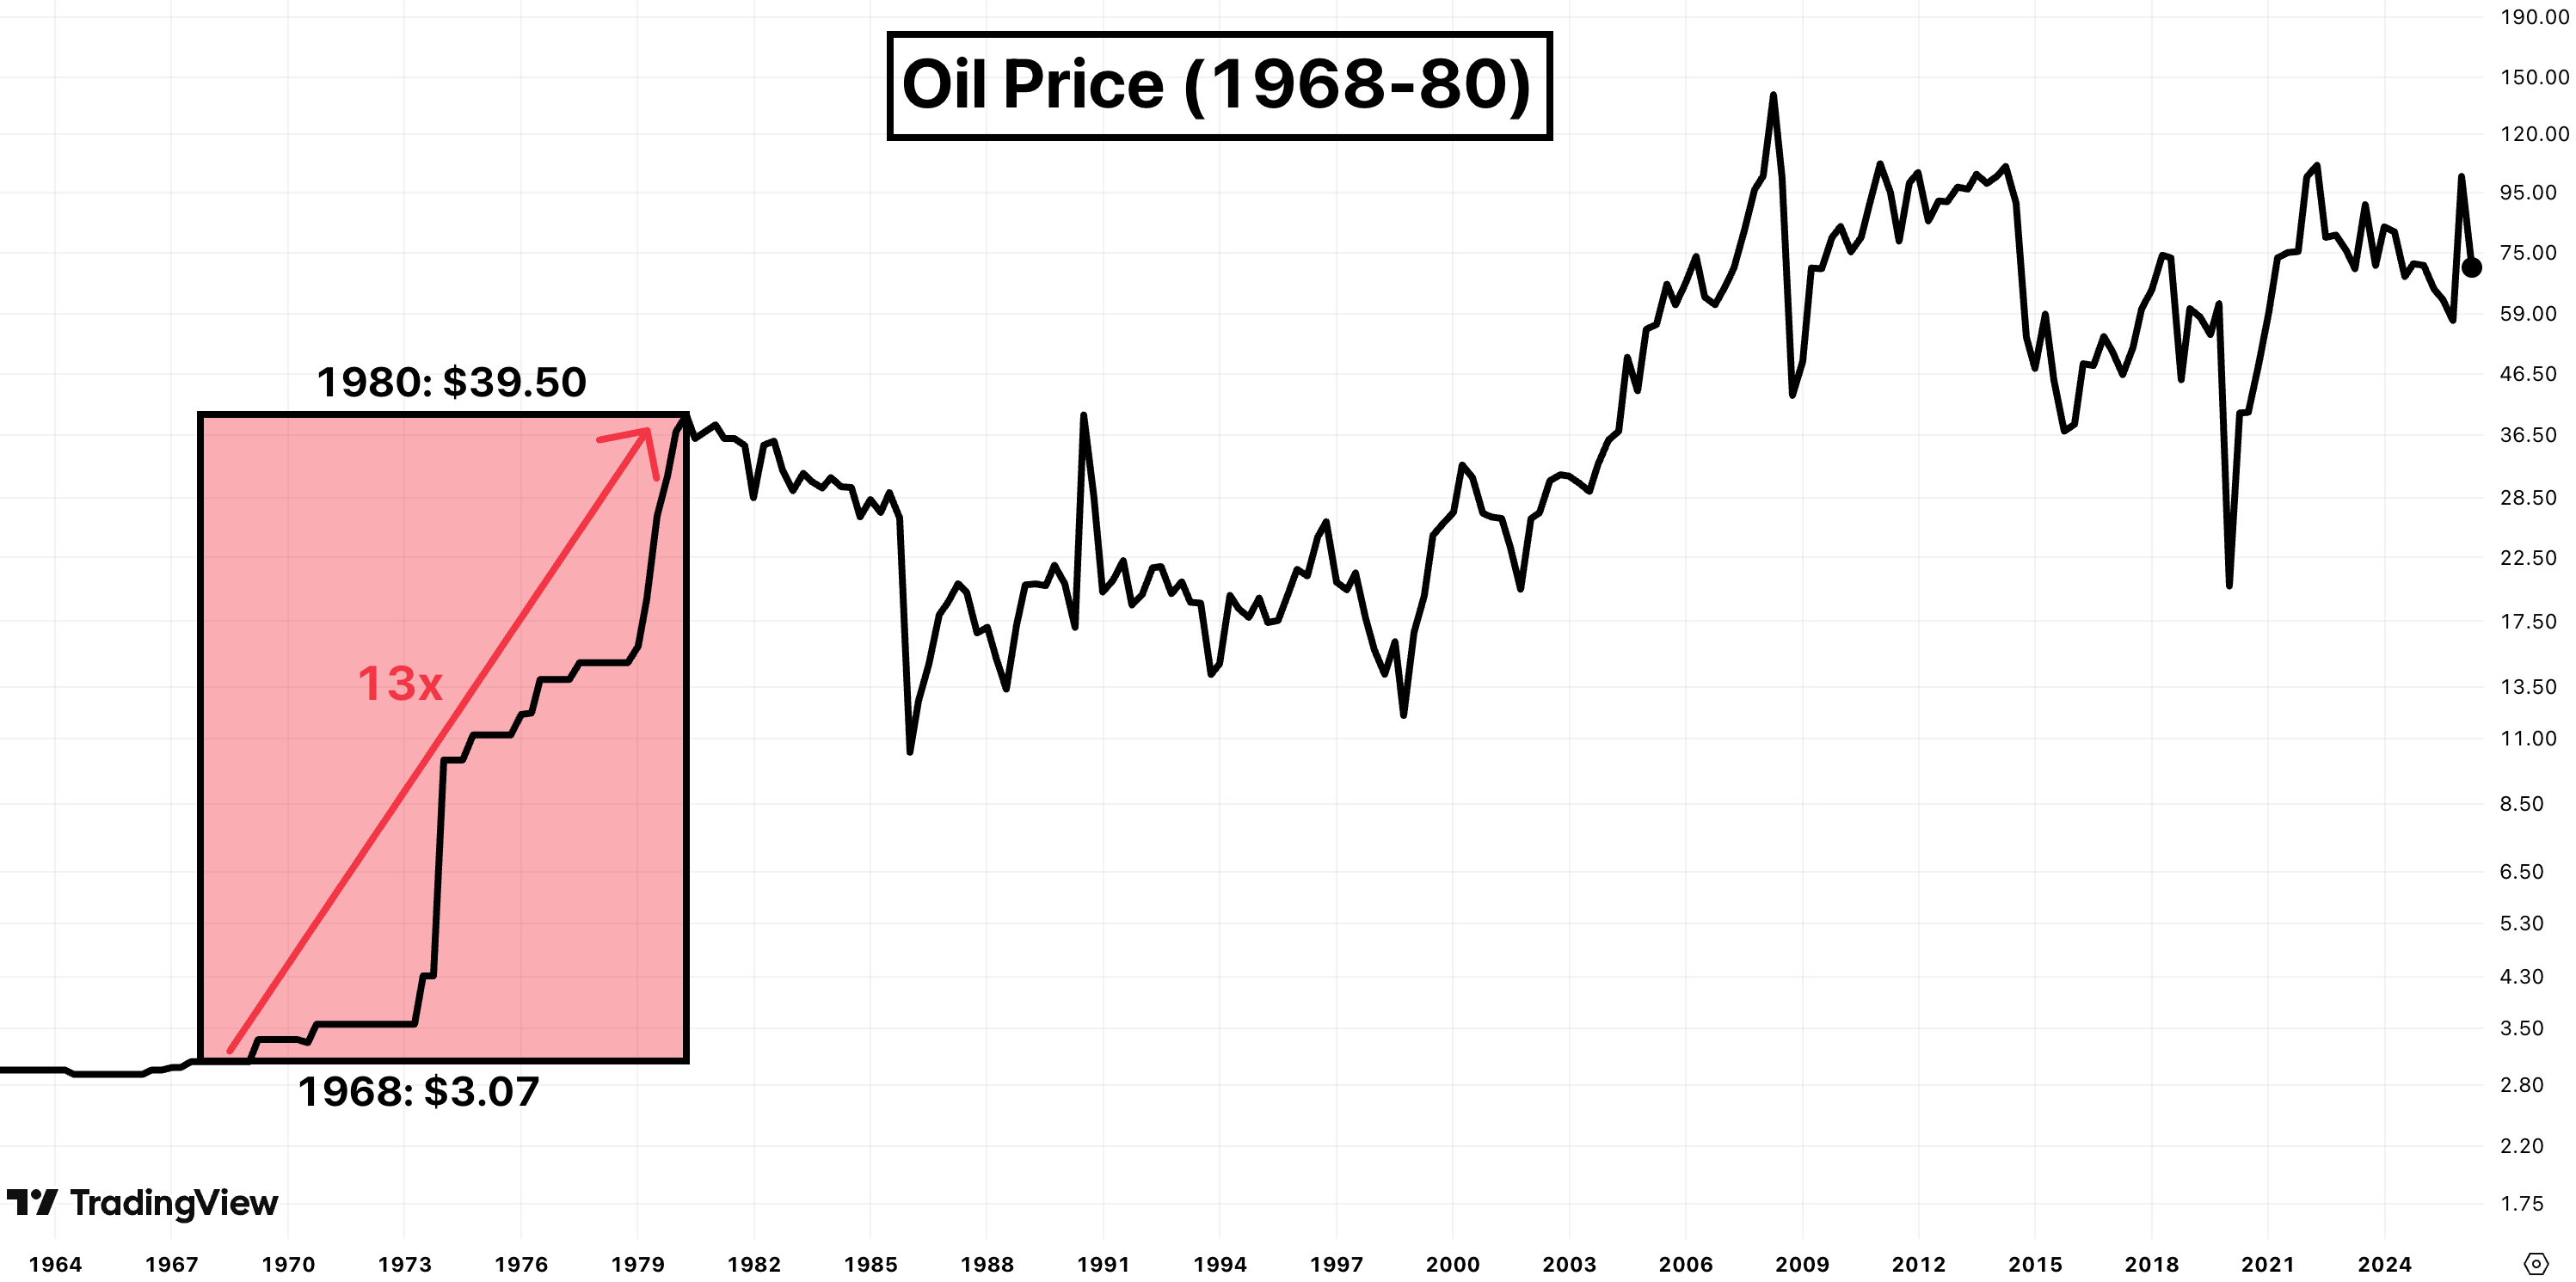
To understand the potential risks ahead, it is worth revisiting one of the most inflationary periods in modern economic history. In 1967, oil traded at $3 per barrel. The average U.S. home cost $30,000 and a loaf of bread sold for $0.21.
By 1980, the picture had changed dramatically. Oil prices had surged to $40 per barrel, representing an increase of over 13x. The average U.S. home price climbed to $80,000, while bread prices rose to roughly $0.51.
The consequences for consumers were severe. Inflation eventually surged to 15%, purchasing power was heavily eroded, and the cost of living increased substantially across nearly every area of the economy. This inflation crisis ultimately required aggressive monetary tightening and some of the highest interest rates in modern history before price pressures were finally brought under control.
Today, while the economic backdrop differs in many respects, some of the underlying inflation patterns appear uncannily familiar.
Gold Price Forecast
Every new Gold analysis as it publishes, today's technical signal and key levels, live price — on one page.
See all Gold forecastsThe 93% Correlation
One of the more intriguing observations emerges when comparing the broad trajectory of U.S. inflation between two periods: 1967-82, and 2015-26
When plotted side by side, the two inflation cycles exhibit a correlation of 93%.
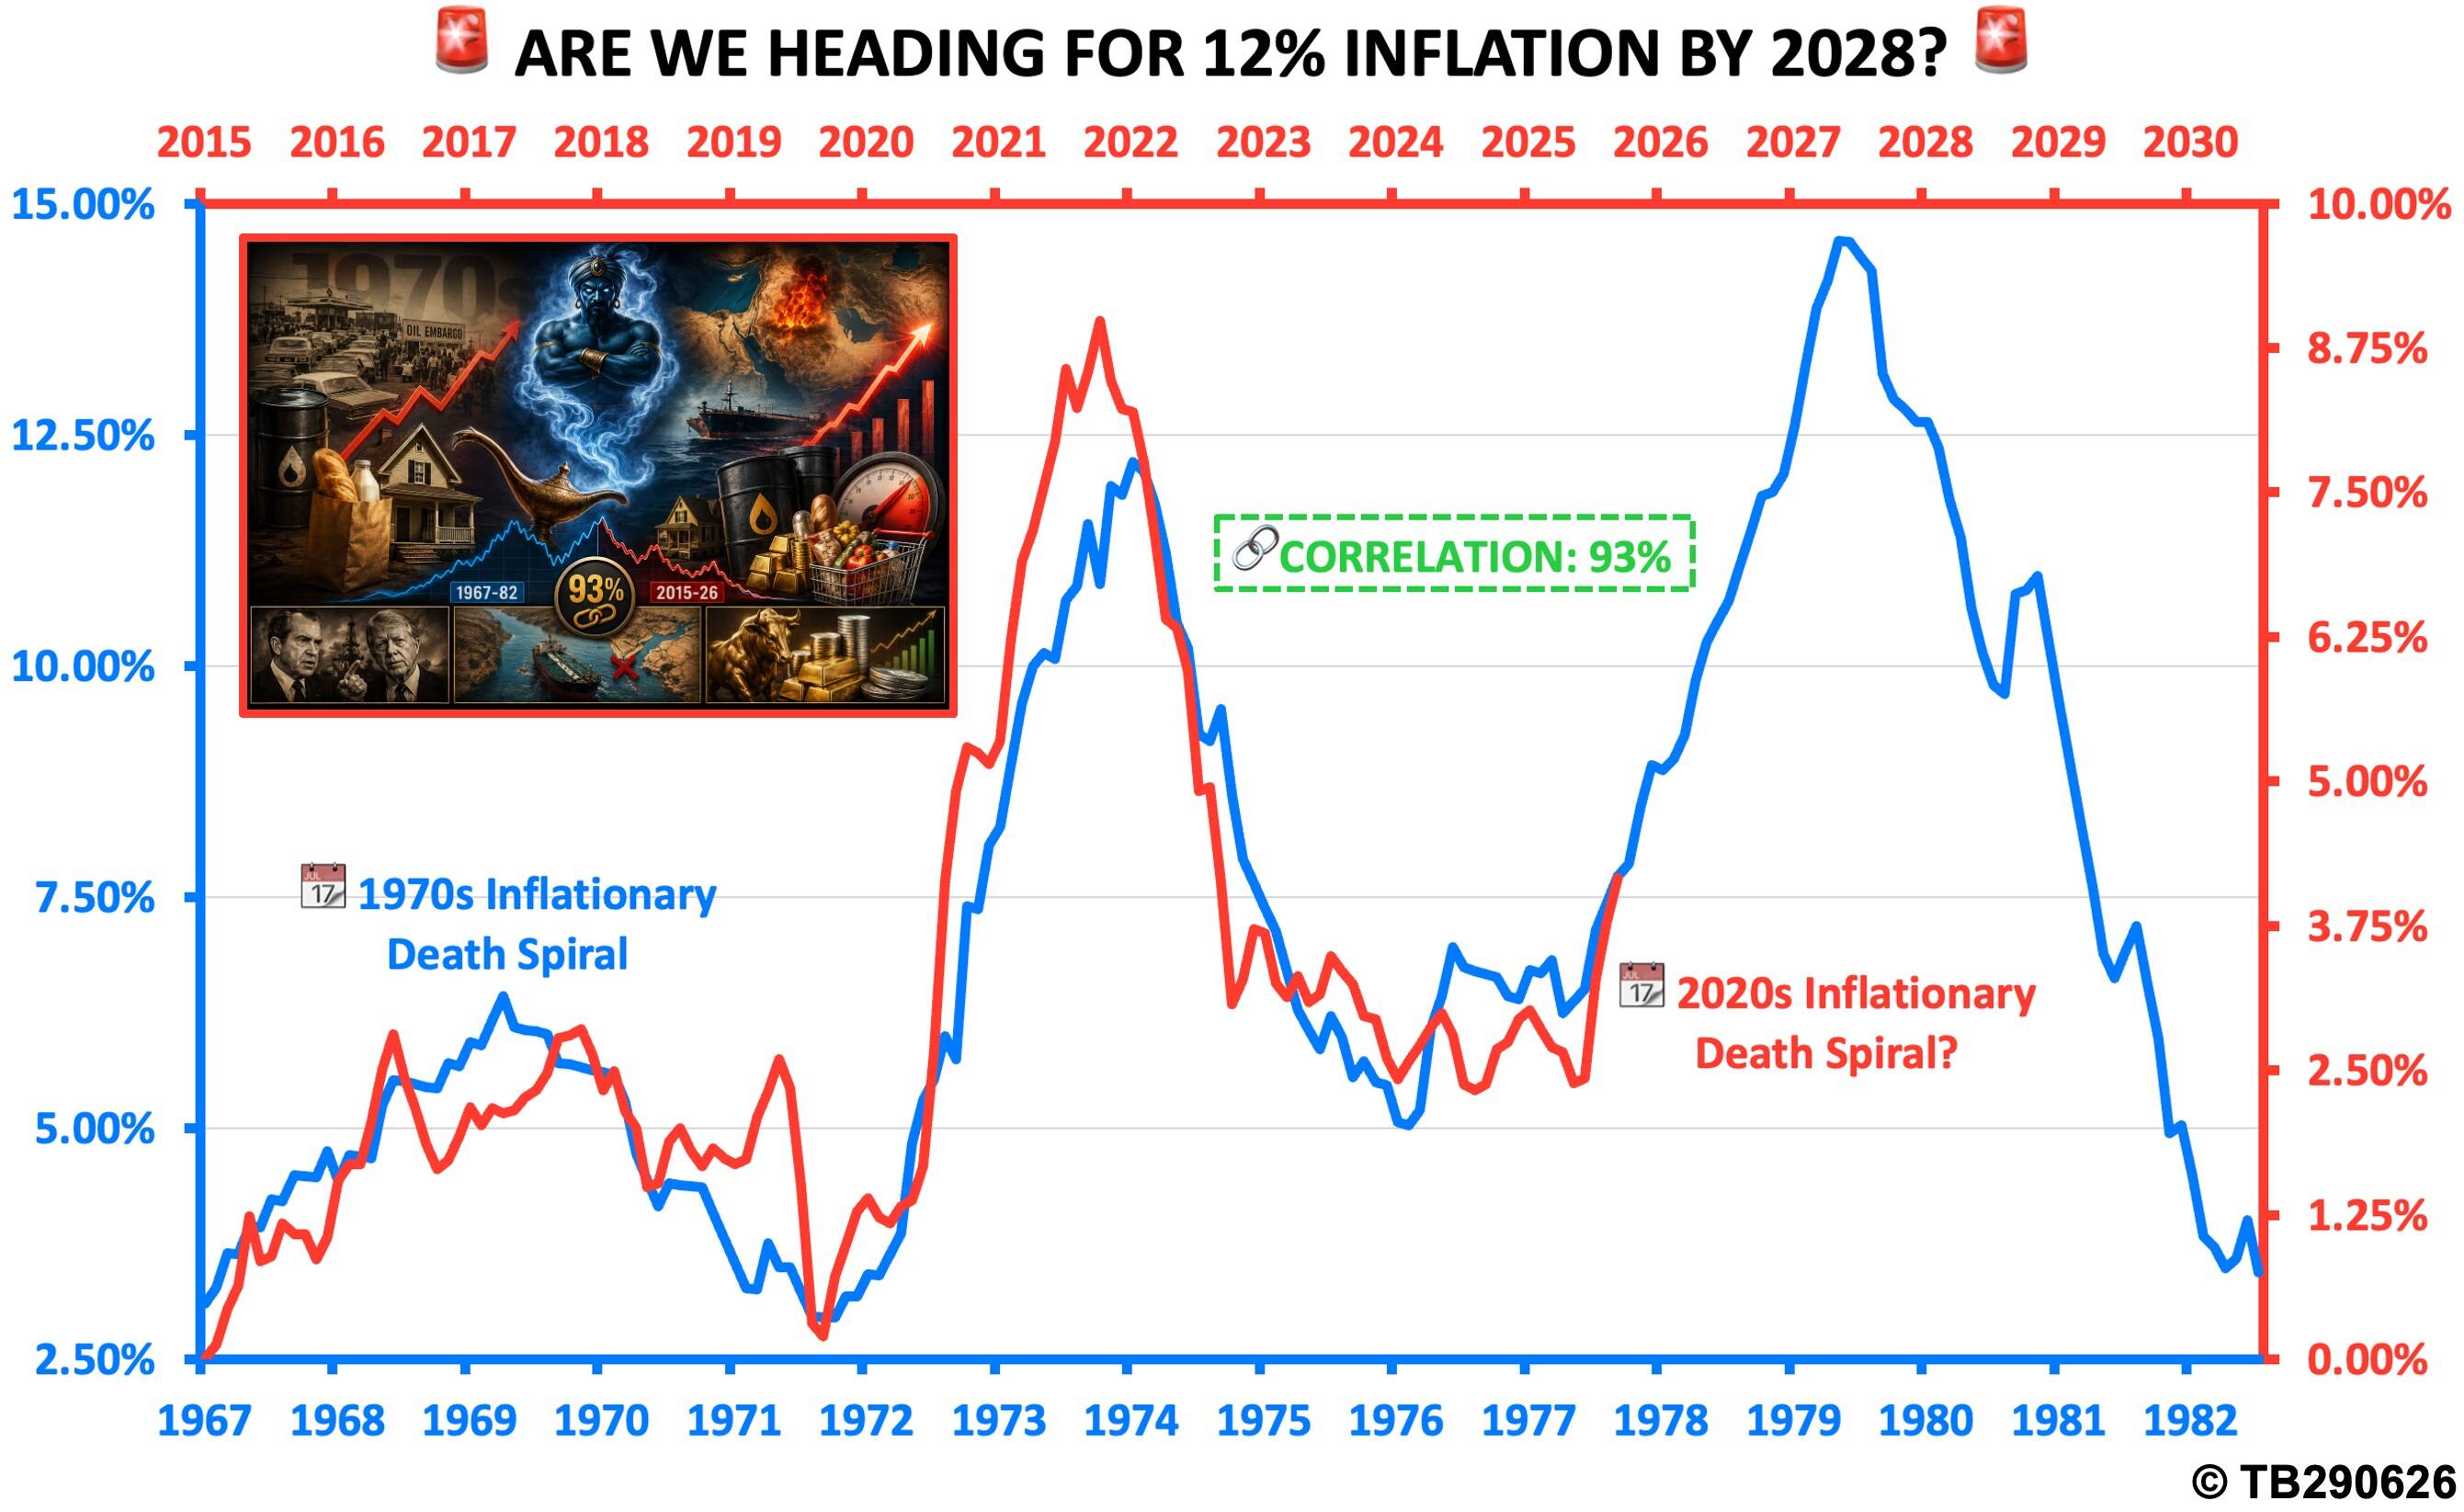
As already mentioned, correlation alone does not predict future outcomes. Markets are influenced by countless variables, and no historical comparison should ever be viewed as a forecasting certainty.
Nevertheless, a 93% correlation is difficult to dismiss outright.
This similarity raises an important question: if the first phases of today’s inflation cycle have broadly mirrored the 1970’s experience, could later stages also share common ground?
The Three-Wave Inflation Pattern
One of the defining features of the 1970’s inflationary era was that inflation did not arrive all at once. Instead, it unfolded in three distinct waves:
- The first wave occurred between 1967 and 1970, when inflation rose from 3% to 6%.
- The second wave proved considerably more powerful. Between 1972 and 1974, inflation accelerated from 3% to 12% – a whopping 9% increase.
- The final wave occurred between 1976 and 1980. Inflation rose from 5% to 15%, adding an excruciating 10% and ultimately producing the peak inflation reading of the entire cycle.
Now compare those moves with recent history:
- The first modern inflation wave occurred between 2015 and 2018, with inflation rising from 0% to 3%, closely matching the 3% increase of the first 1970s move.
- The second wave followed between 2020 and 2022, when inflation surged from 0% to 9%, again closely matching the 9% increase experienced during the second 1970s wave.
The obvious question becomes whether a third wave lies ahead. If the historical narrative becomes the reality of today, a future inflation move from 2% to 12% would represent a similar 10% increase. This is not a forecast. However, it remains a scenario that is worth taking seriously.
Why Oil Remains the Key Variable
The common denominator behind every major inflation surge of the 1970’s was energy:
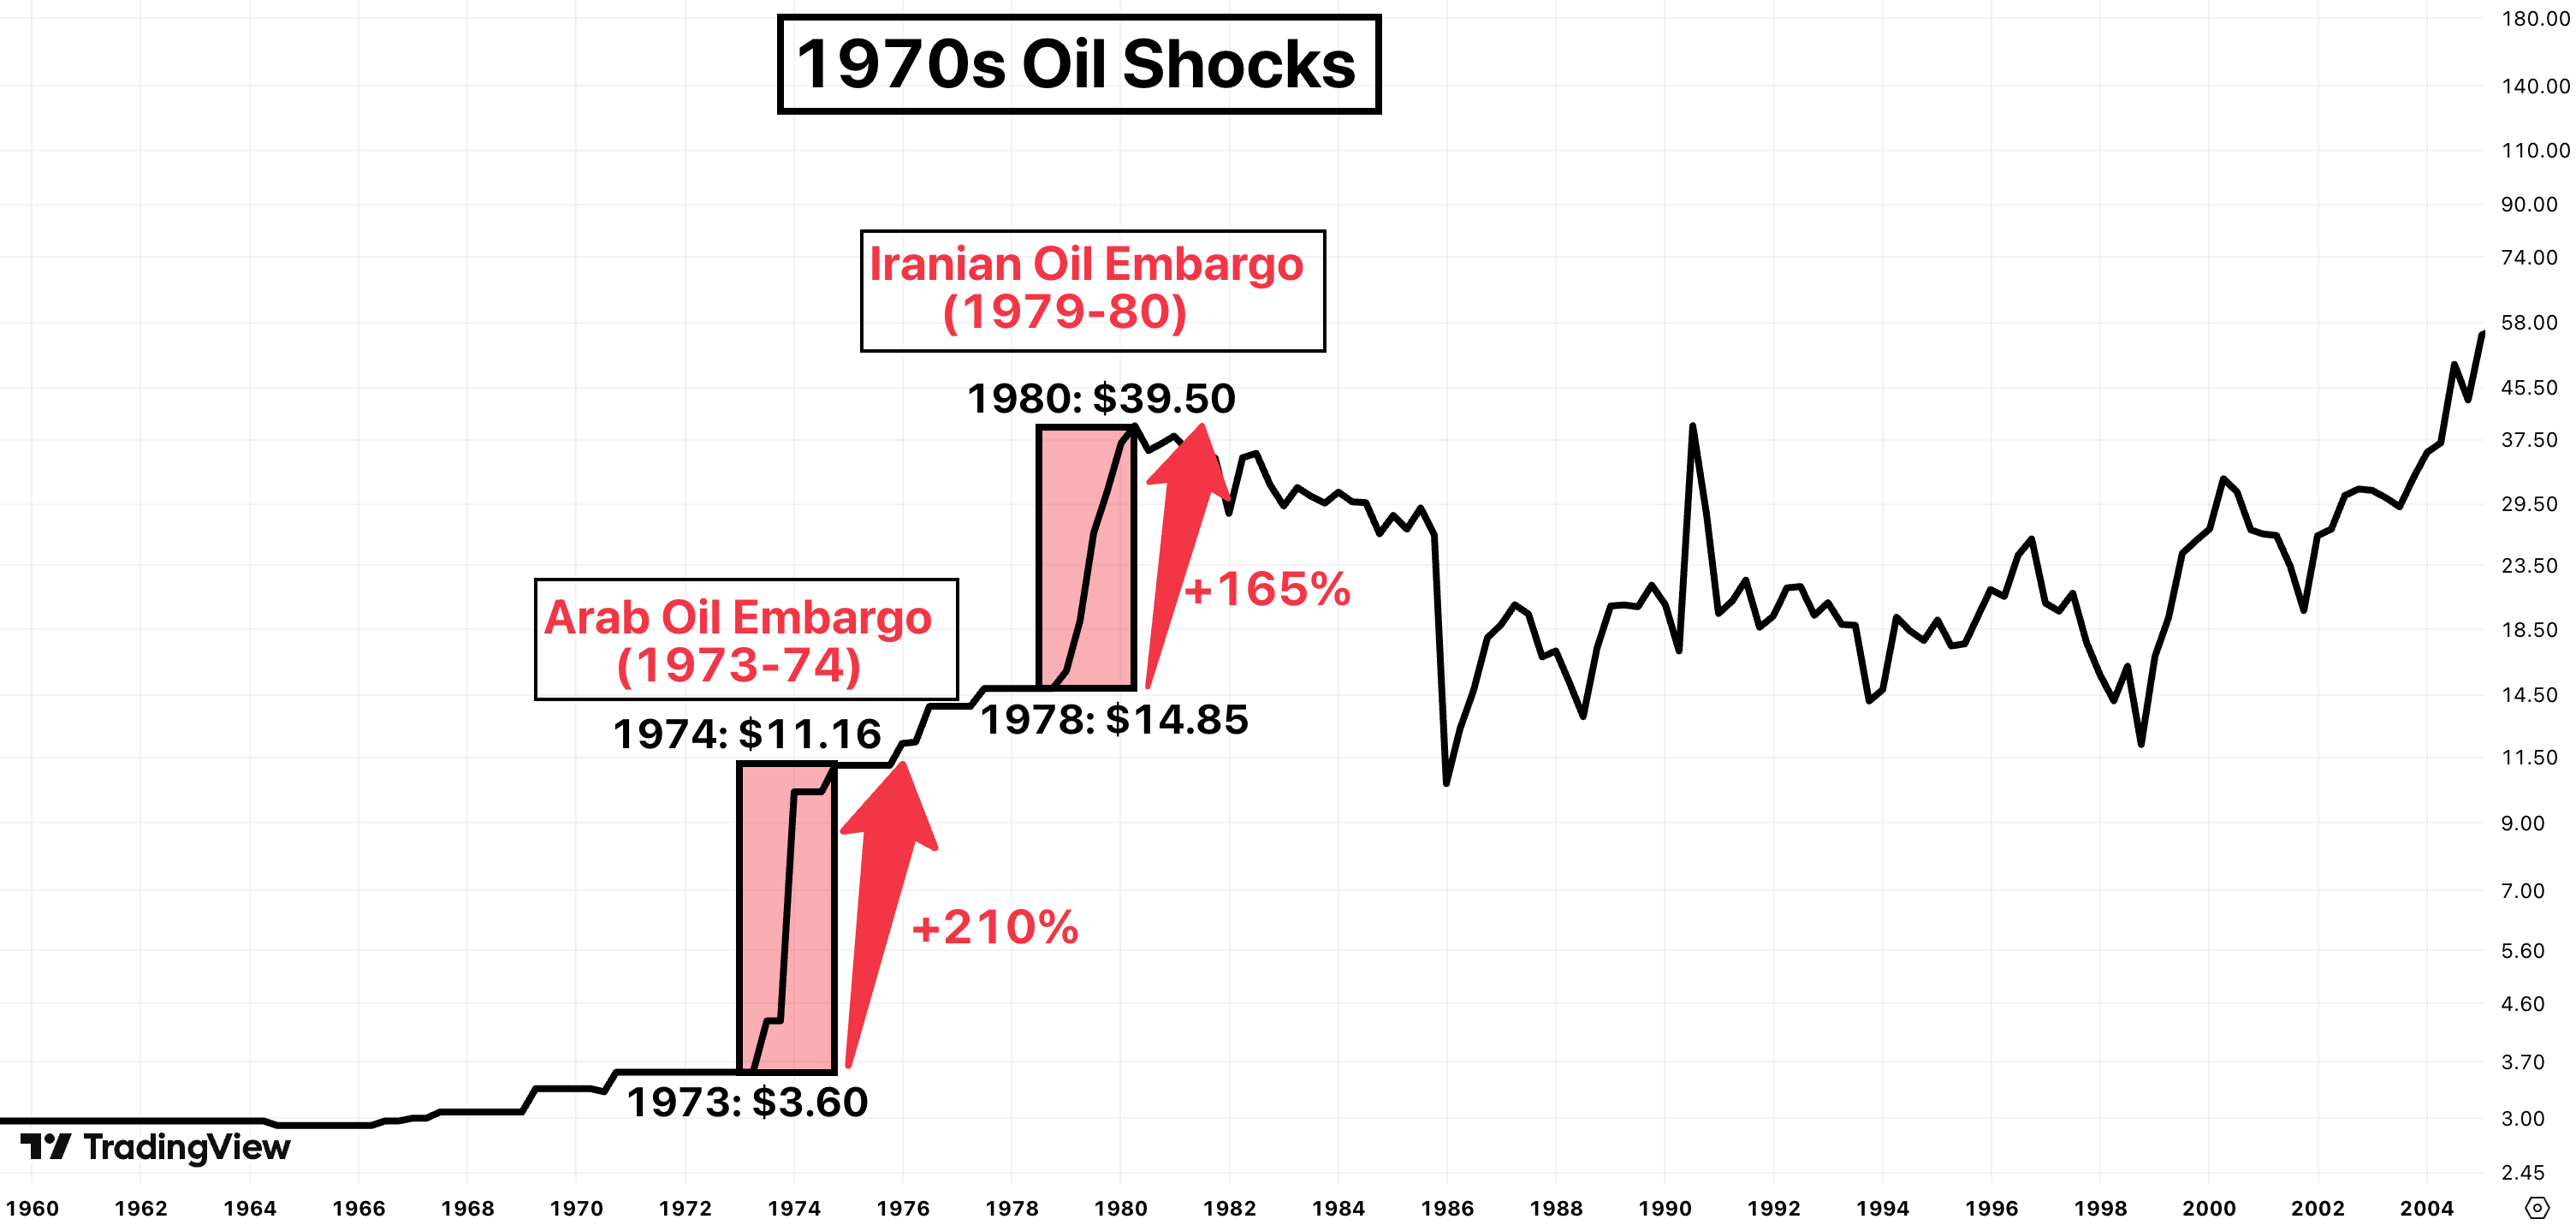
- The 1973-74 Arab Oil Embargo triggered a dramatic supply shock, sending oil prices 210% higher. Inflation subsequently accelerated from 3% to 12%.
- A few years later, the Iranian Oil Embargo of 1979-80 produced another major energy disruption. Oil prices surged 165%, while inflation climbed from 5% to 15%.
Energy acted as the transmission mechanism that spread inflation throughout the broader economy. That dynamic remains relevant today. During the 2026 geopolitical shock, oil prices briefly surged 80% in a single month before subsequently falling around 60% as supply concerns eased. Inflation rose from roughly 2% to 4% during the same period.
Importantly, inflation pressures could ease again if energy prices continue to decline. However, the episode served as a reminder that oil remains one of the most important variables in the inflation equation. Energy costs influence nearly every sector of the economy. Transportation, manufacturing, food production, housing construction, utilities, and logistics all depend heavily on energy inputs. When oil prices rise sharply, inflation can spread rapidly. Conversely, when oil prices decline, disinflationary forces often accelerate.
The Most Concerning Historical Parallel
Perhaps the most important comparison lies not in the inflation peaks but in the temporary periods of stability that occurred beforehand. Between late 1976 and early 1977, inflation rose from 5% to 7%. Following that increase, inflation remained relatively stable between 6% and 7% for 12 months. At the time, many observers believed the inflation crisis had largely been harnessed. They were wrong. Over the next two years, inflation accelerated dramatically, eventually reaching 15% in 1980.
Today, a similar setup may be unfolding. Inflation has risen from 2% in early 2026 to around 4% by May 2026, representing a 2% increase – closely resembling the initial rise experienced in 1977. As was the case 50 years ago, might inflation remain elevated within the 3% to 4% range for an extended period of time before investors become increasingly complacent?
The risk is almost certain to emerge if another energy shock or supply-side disruption triggers renewed acceleration. It’s not unreasonable to suggest inflation may potentially climb from 4% toward 12% as we move on through the decade. Again, this is not the base case. However, it is a risk scenario that markets may be underestimating.
The Potential Hedge Trade
During the final stages of the 1970’s inflation cycle, precious metals emerged amongst the strongest-performing assets in global markets. Gold surged 3.5x, whilst silver advanced 7x. Investors increasingly sought assets capable of preserving purchasing power as confidence in fiat currencies waned and inflation expectations became unanchored.
It would be wrong, in my opinion, not to consider the lessons of the past. Precious metals could indeed, once again, attract significant capital flows. Gold prices have the potential to rise from $3,500 to $12,250, while silver could advance from $50 to $350. All by 2028. Such targets may seem speculative and highly dependent on future economic conditions. Nevertheless, they illustrate the magnitude of moves that can occur when inflation becomes entrenched. And curbing inflation does not seem to be high on the Fed’s agenda right now……
Expressing the View: A Defined-Risk Precious Metals Trade
For investors who believe inflation dynamics in 2026-28 may resemble the 1978-80 period – potentially driving a major move higher for gold and silver – the key question is how to express that view while controlling downside risk.
At current levels of $4,000 gold and $58 silver, I would view precious metals as an opportunity to express this macro view with clearly defined risk. For gold, I would focus on the April 2025 pivot high of $3,500 as the key level. A break below it would challenge the bullish thesis, reducing the attractiveness of the setup until gold reclaims $3,500. For silver, the equivalent level is the $48-$50 zone, defined by the 1980 and 2011 previous all-time highs. A break below this area would similarly weaken the bullish case until silver recovers above it.
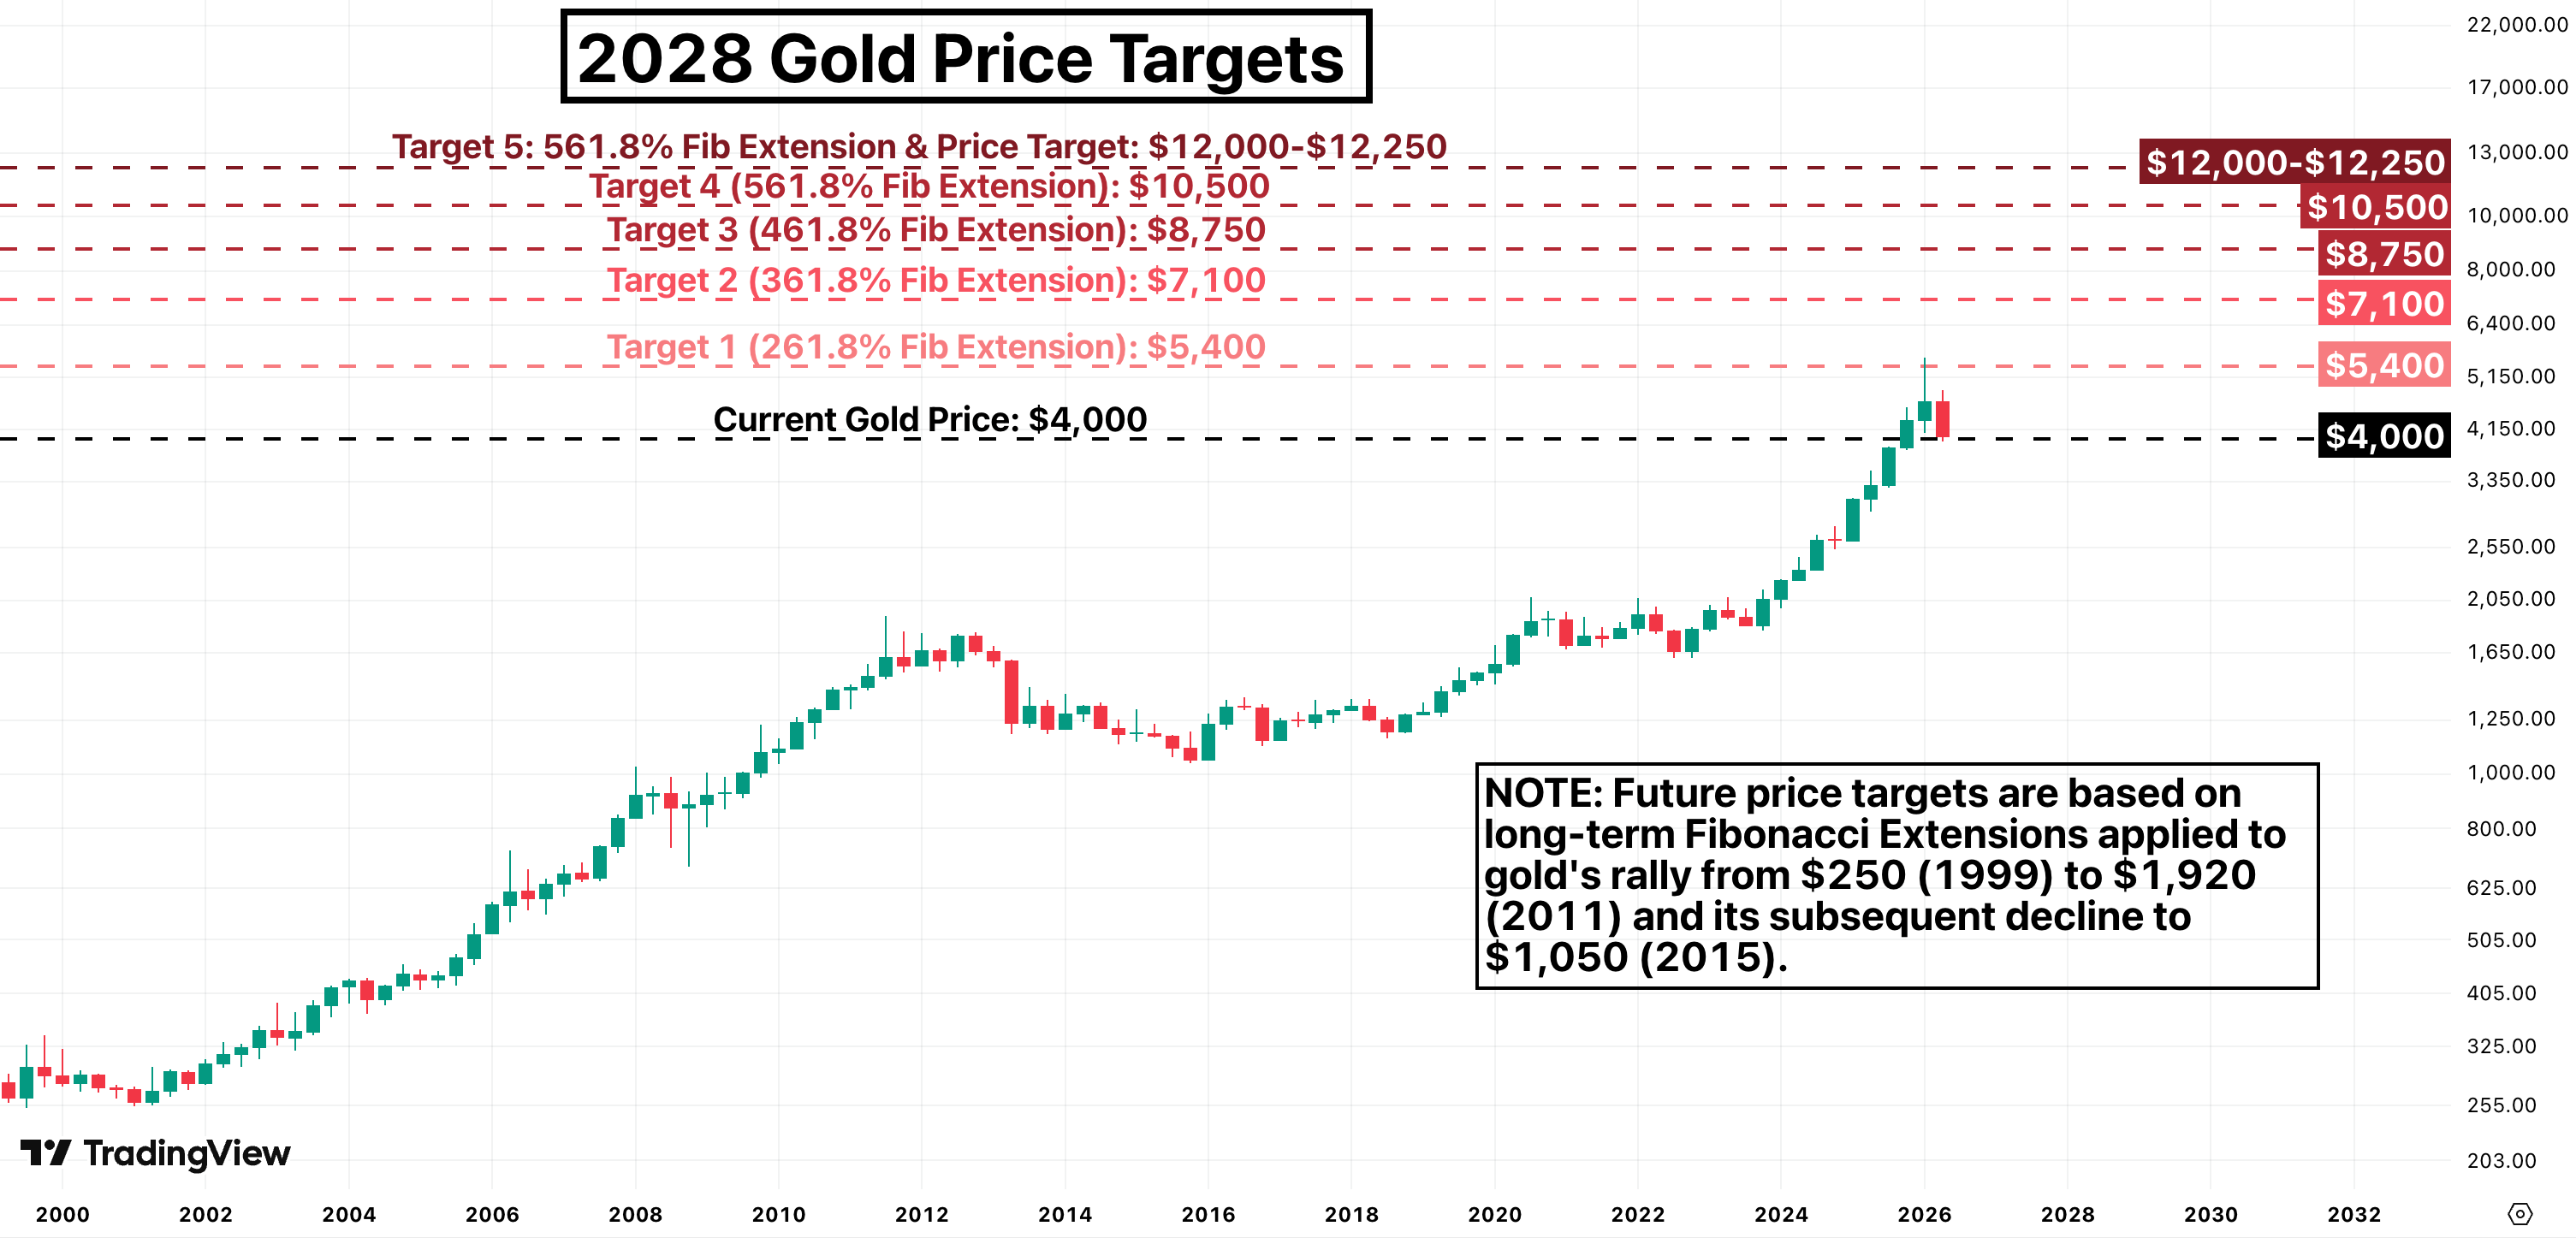
On the upside, I would manage positions progressively rather than target a single price. For gold, I will consider reducing exposure at successive levels: around $5,400 (trim 20% of remaining exposure), $7,100 (trim 25%), $8,750 (trim 33%), and $10,500 (trim 50%). A move toward the final target near $12,000 would be a point to reassess whether the original thesis still justifies maintaining exposure.
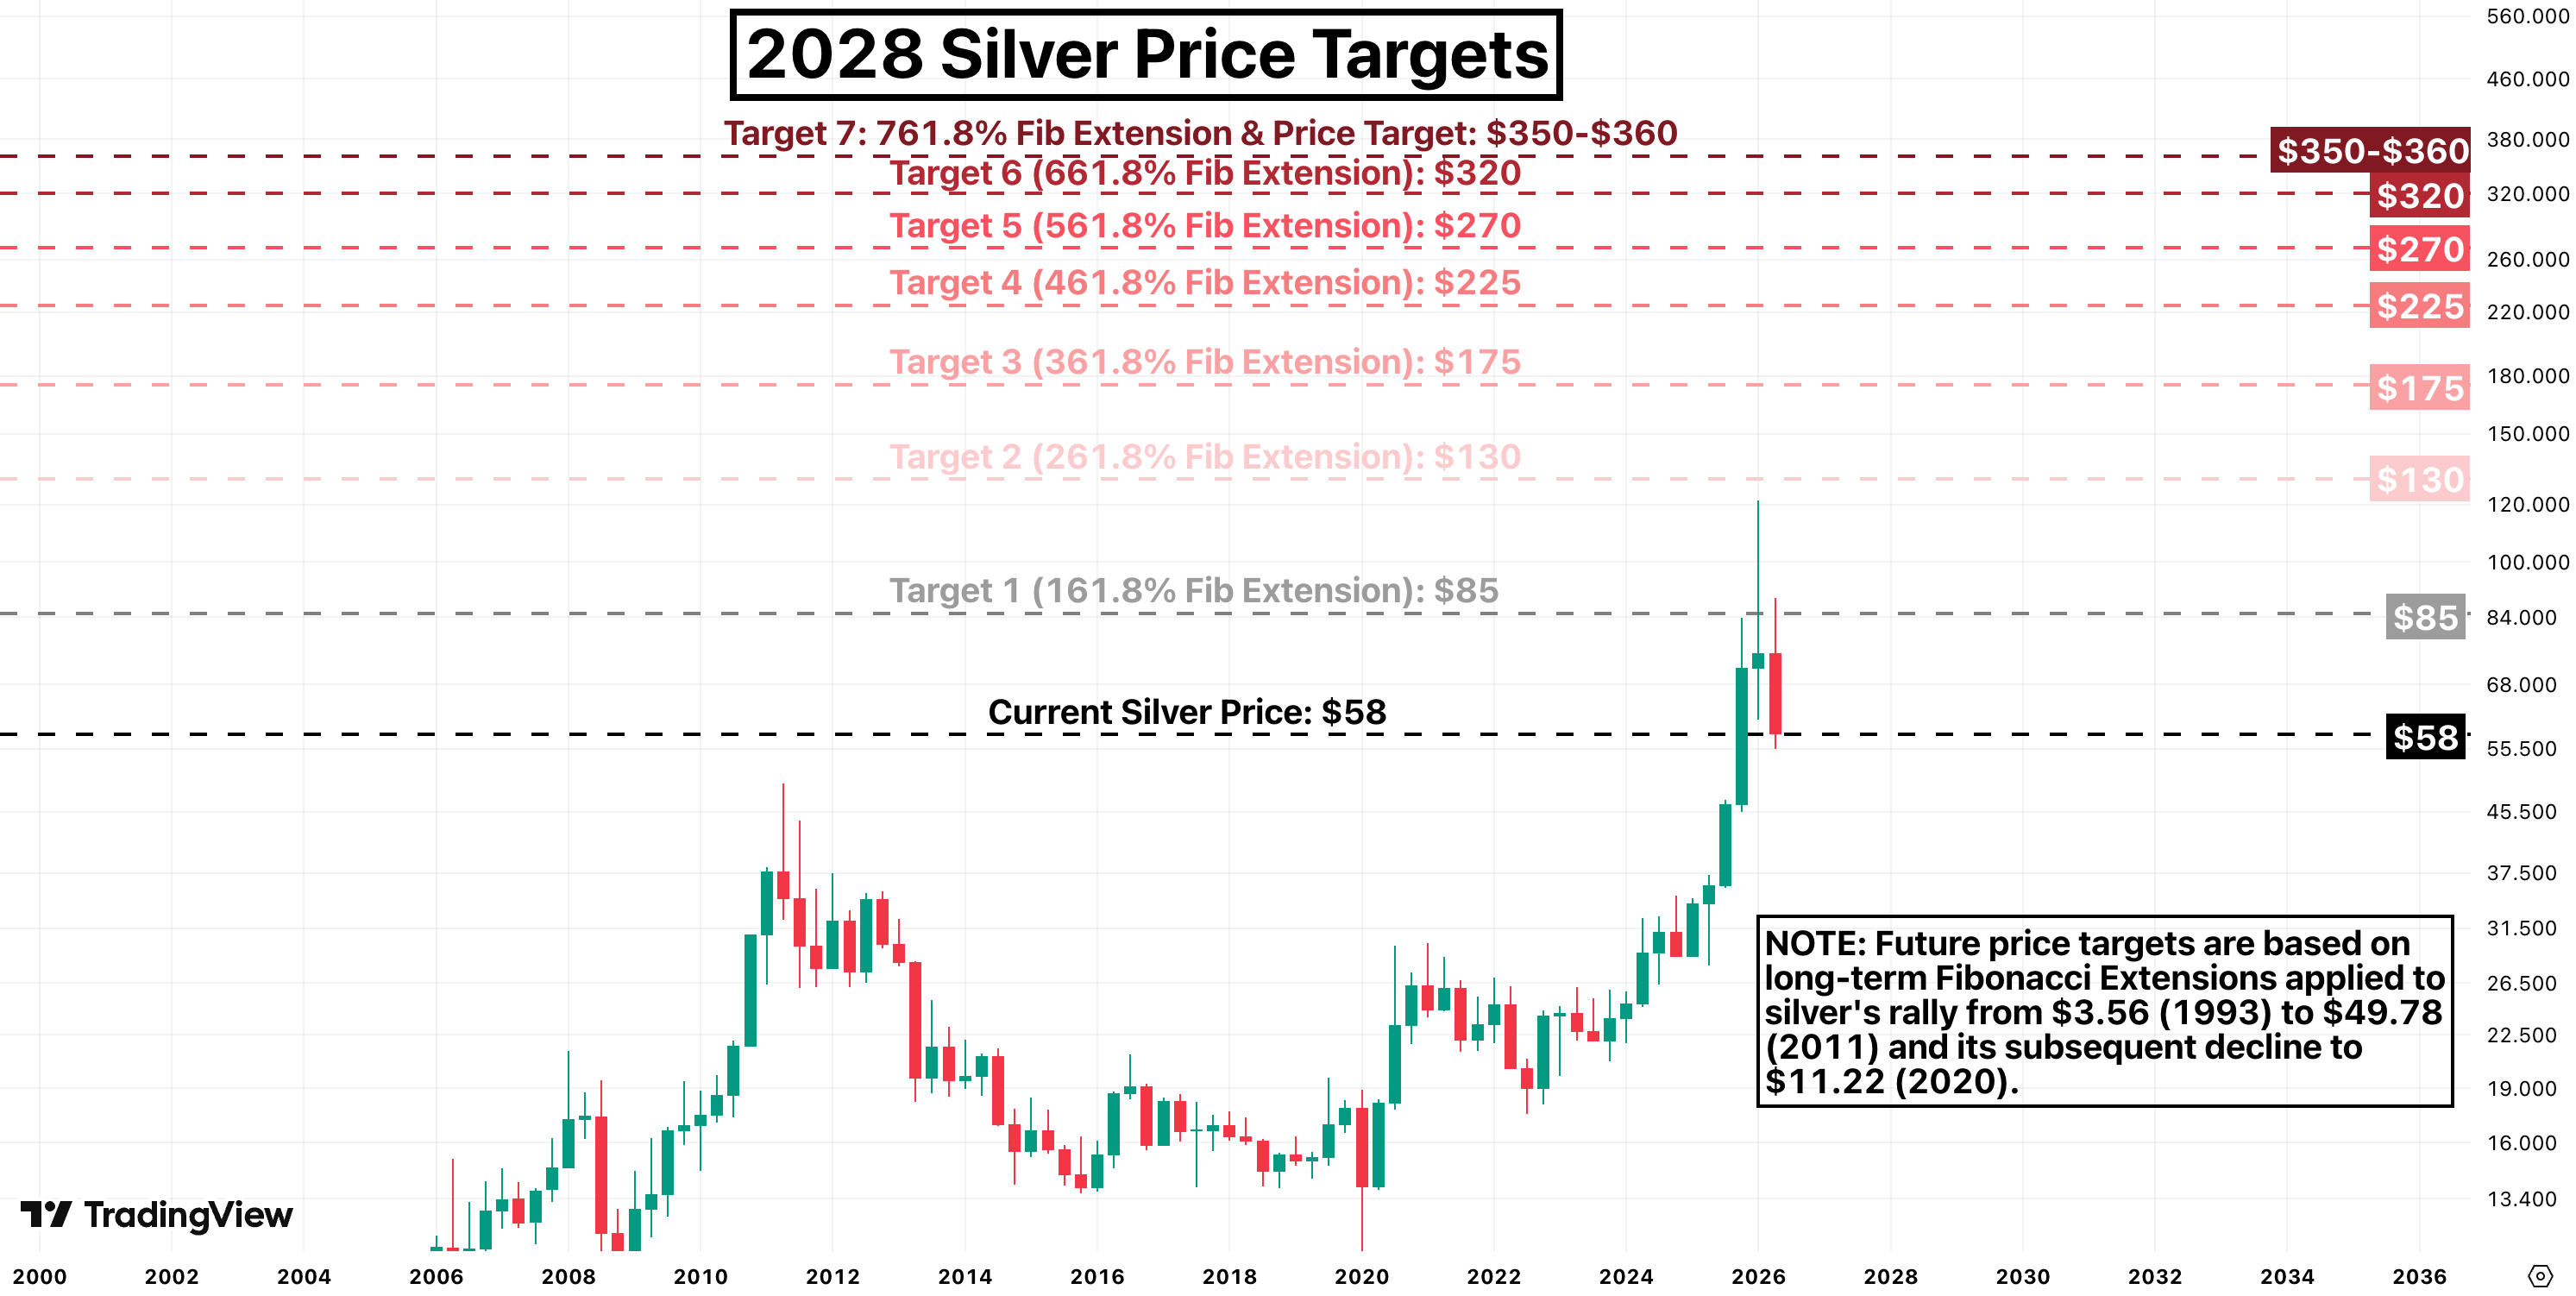
For silver, I would take a similar staged approach: reducing exposure around $85 (trim 15% of remaining exposure), $130 (trim 17%), $175 ( trim 20%), $225 (trim 25%), $270 (trim 33%), and $320 (trim 50%). A final move toward $350 would again warrant reassessing whether the thesis remains intact.
This approach allows participation in a potential inflation-driven repricing of precious metals while recognising that markets rarely move in a straight line. Although current conditions may resemble the 1978-80 inflationary environment, the outlook can change. Of course a significant shift toward tighter monetary policy or a rapid easing of geopolitical risks could materially reduce inflation pressures, making disciplined risk management essential. But both seem unlikely.
Bottom Line
Could this entire historical comparison ultimately fail? Absolutely. Continued normalisation of global supply chains, declining energy prices, expanding production capacity, and sustained monetary restraint could all help contain inflation over the coming years.
However, completely dismissing the correlation between today’s inflation cycle and that of the 1970’s may be foolhardy. The key facts remain tricky to ignore:
- Today’s inflation pattern shares notable similarities with the inflation cycle that unfolded between 1967 and 1980.
- Energy remains one of the most powerful inflation transmission mechanisms in the global economy.
- And geopolitical shocks continue to have the potential to disrupt supply, destabilise markets, and reignite price pressures.
Sometimes when you look into a crystal ball it’s as important to look back as it is to look forward. For me, the current set of signals are marrying up with, and bear an uncanny resemblance to, what has gone before.
I’ll leave you with this:
“That men do not learn very much from the lessons of history is the most important of all the lessons that history has to teach.” Aldous Huxley