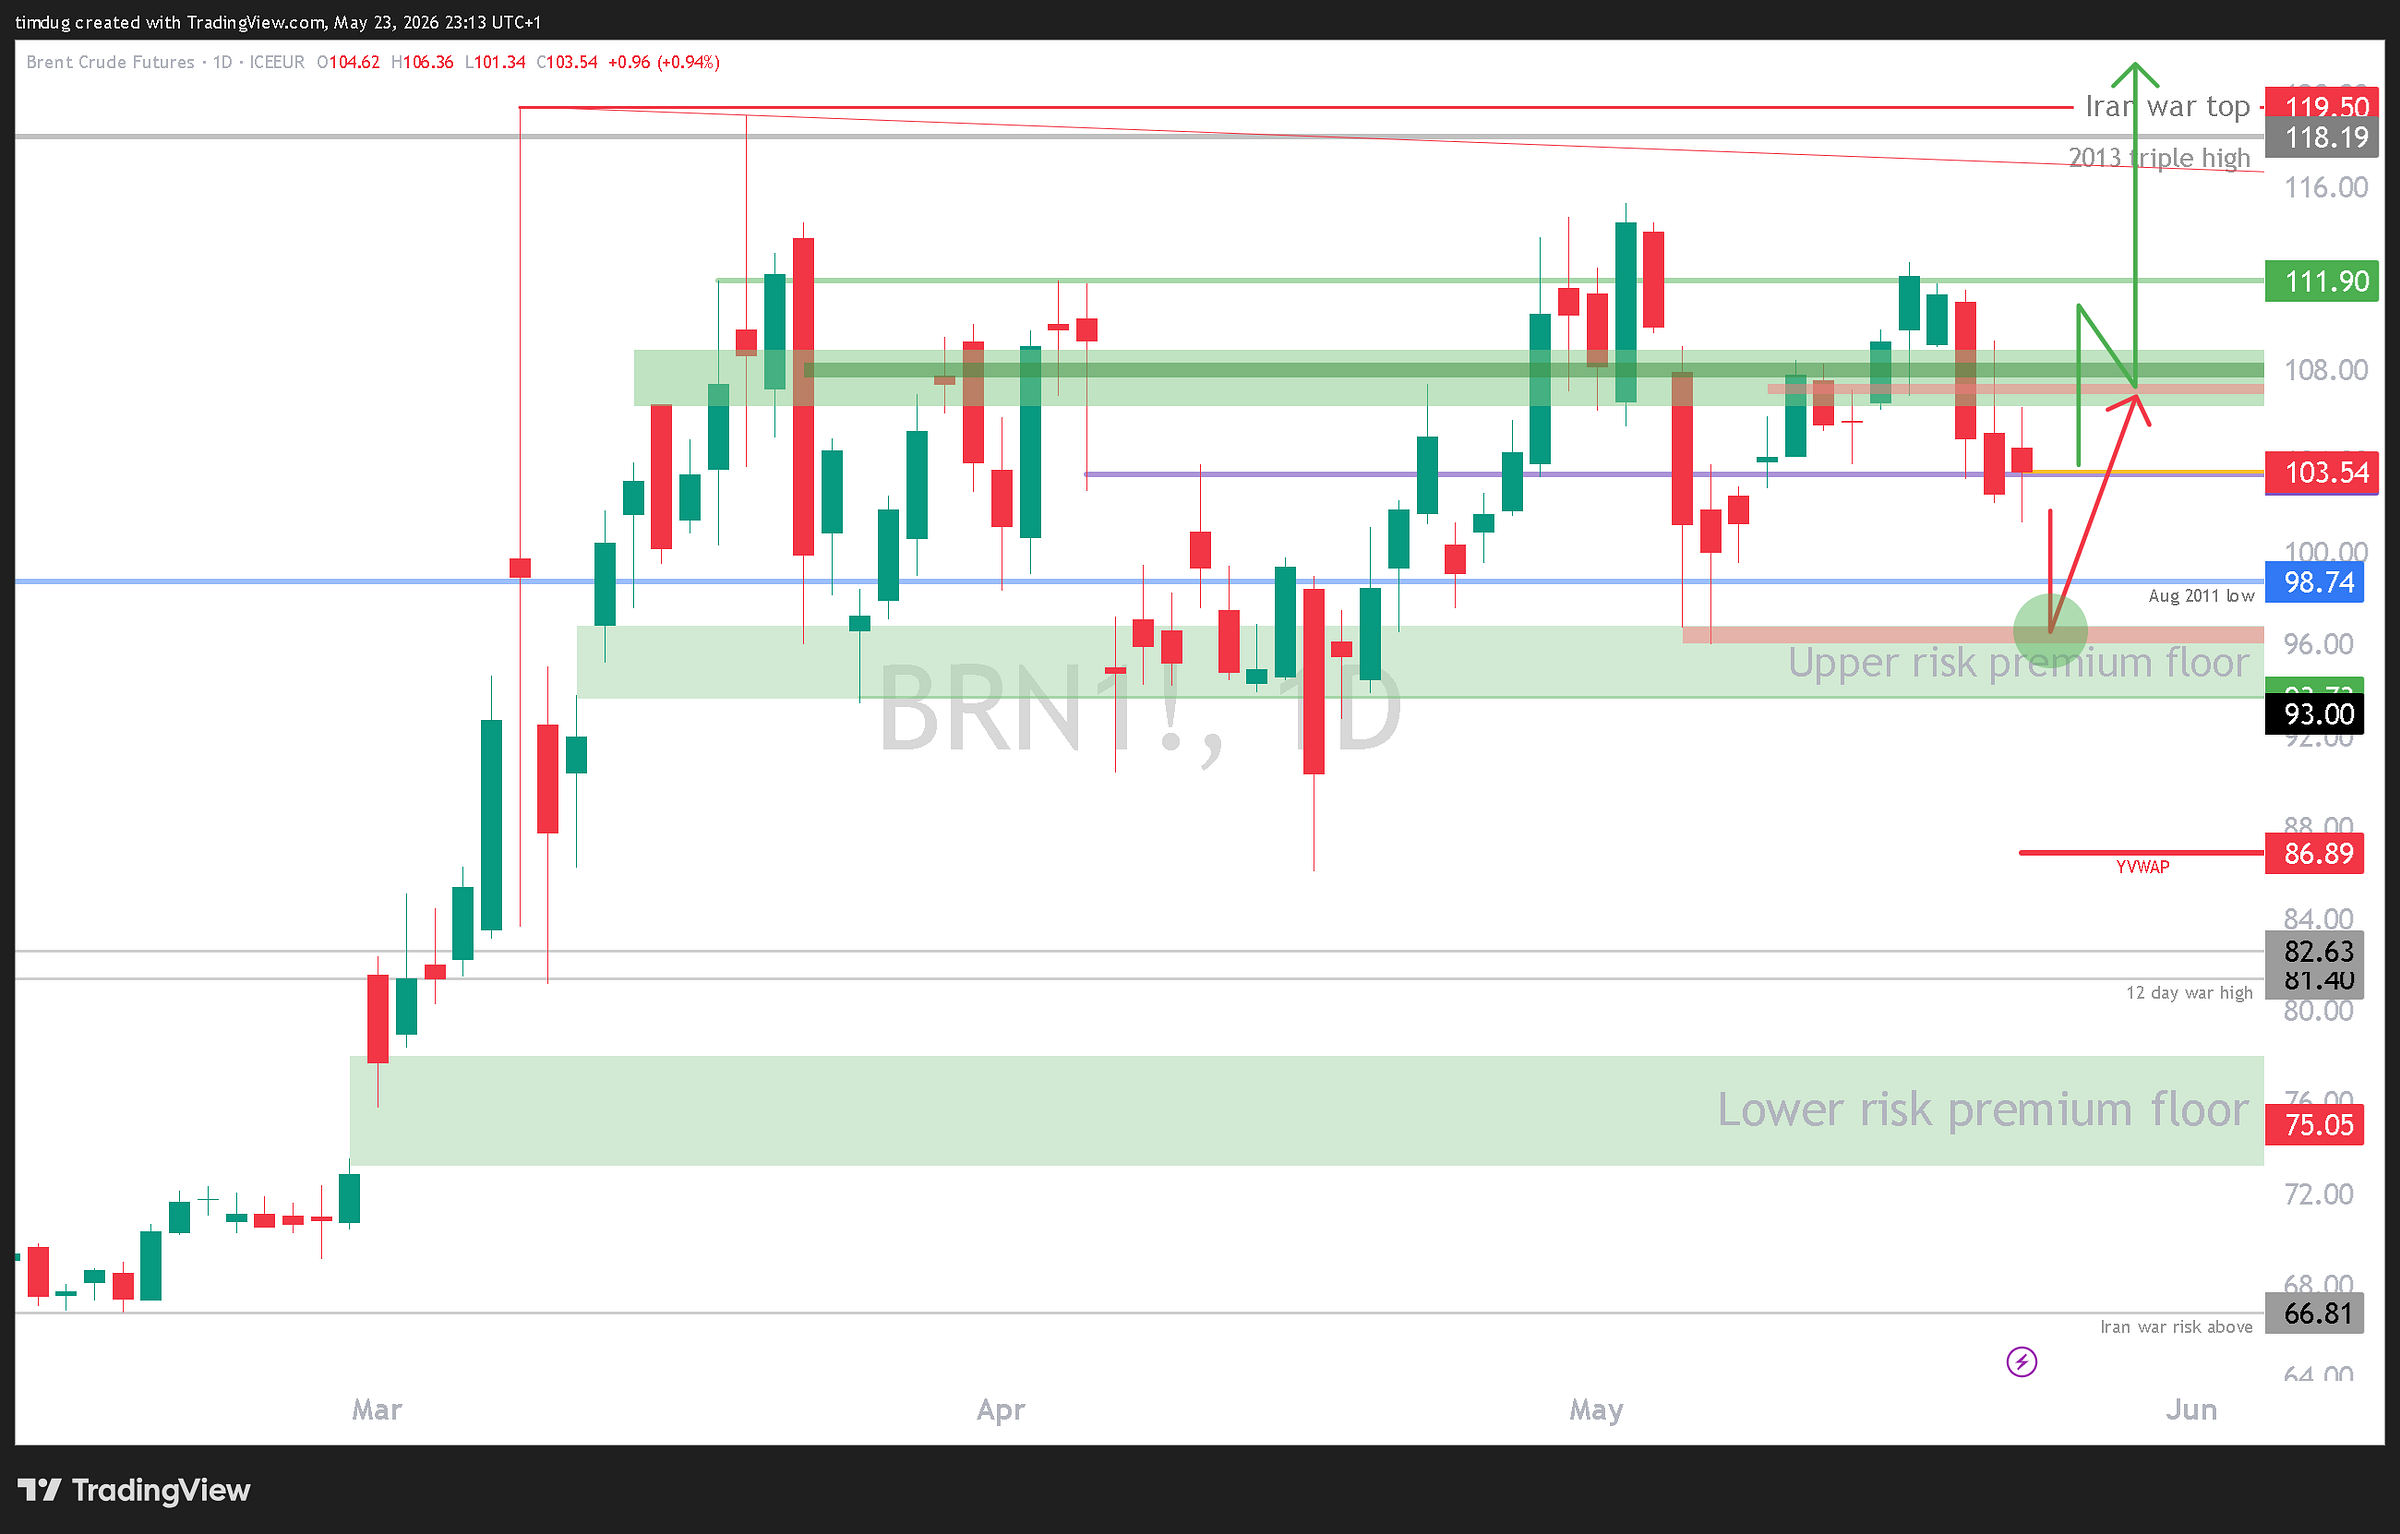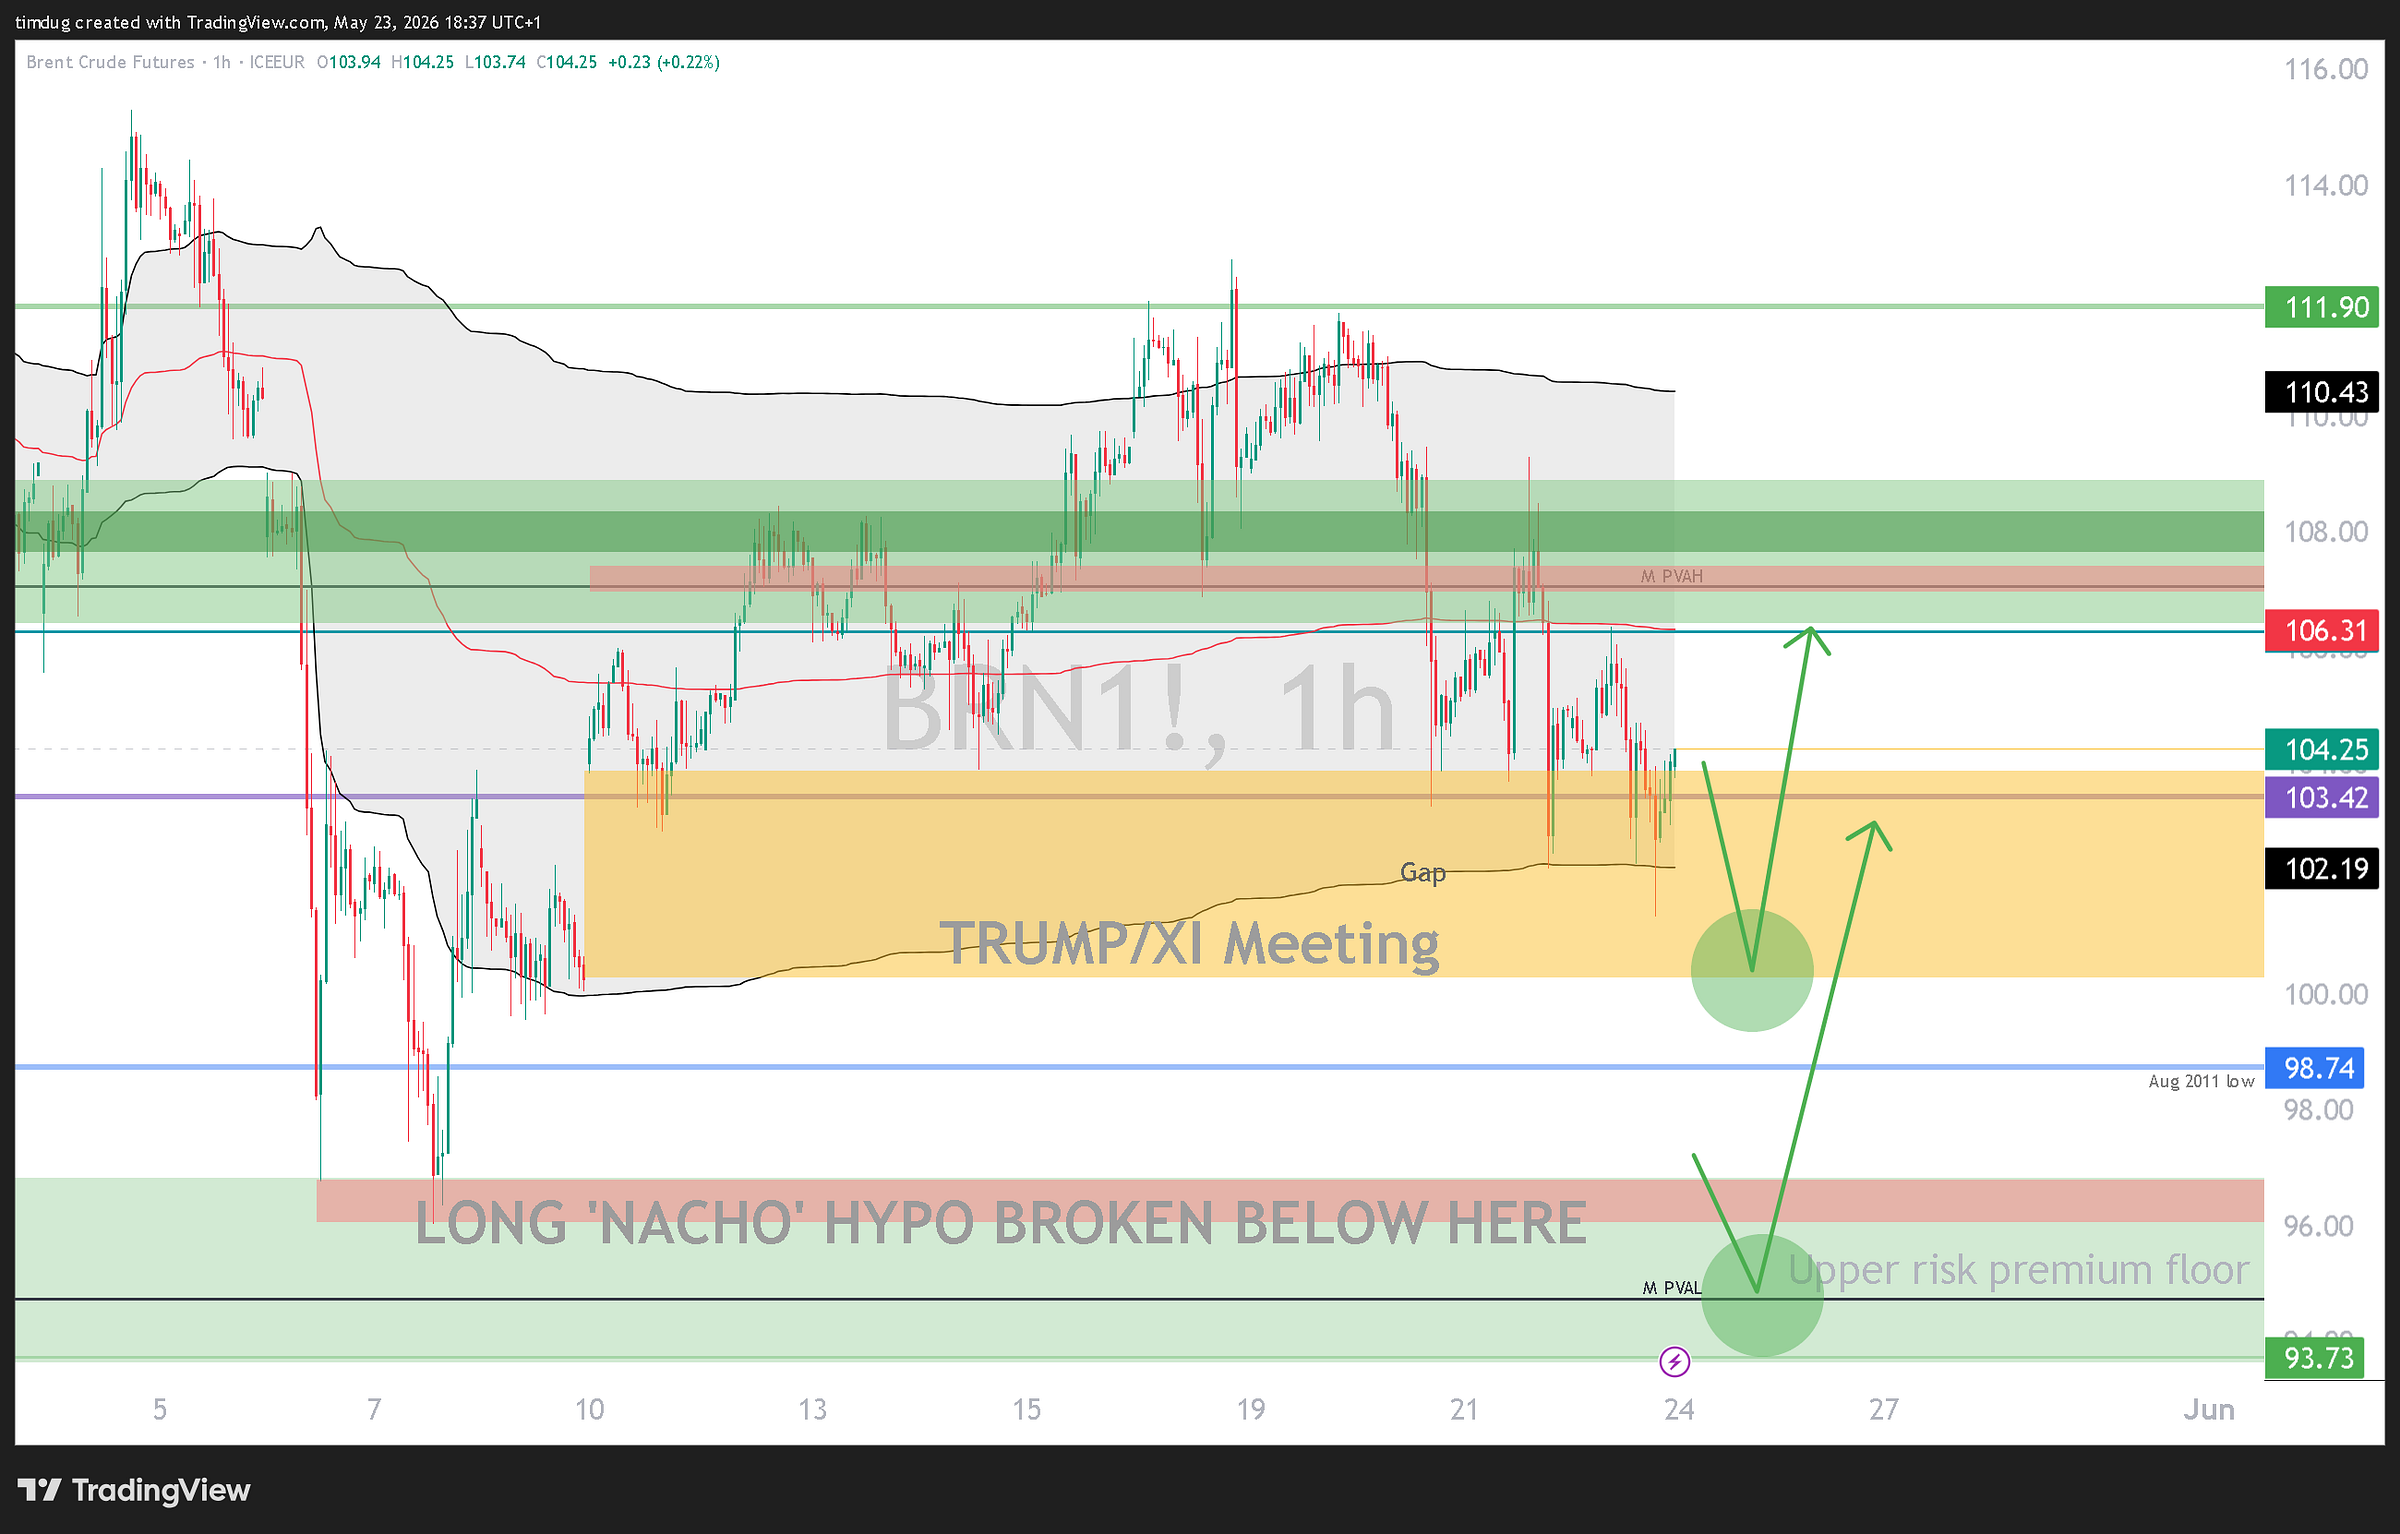
The market is mislabeling a supply shock as demand destruction; the tell is the US redlining at 93% while the world tightens; genuine destruction is narrow (jet, petrochem); inventories are draining at a record pace toward a record OECD low by end-May. The pain trade on oil has been for the longs. It’s now for the shorts.
‘’9 mb of the 11 mb of US SPR crude exported so far were shipped to Europe.”
Source: IEA citing Kpler ship tracking
There are two fears in this market right now, and both are real enough to move price. The first is behavioral: that high prices have started to destroy demand. The second is physical: at the current rate of draw, the world’s oil stocks are racing toward “tank bottoms” by the third quarter.
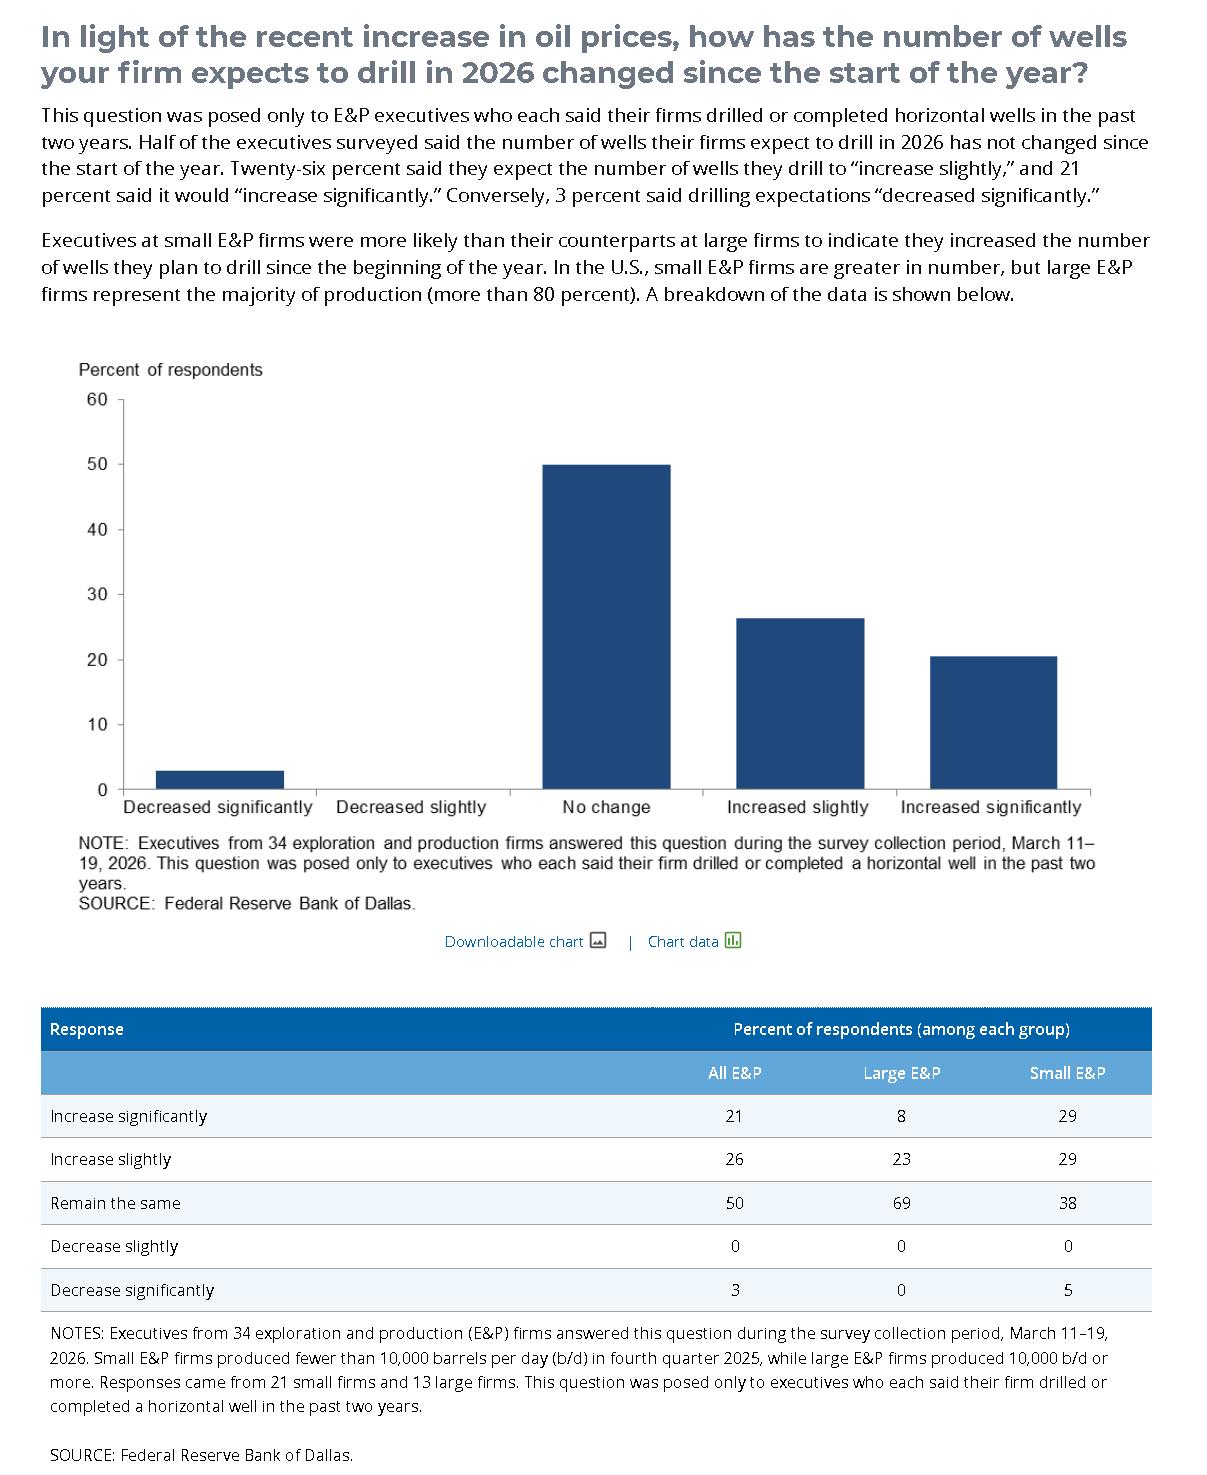
We are in the new medium-term normal now (The New Normal, 11 May): the Strait of Hormuz is gated and tolled, and the industry is slowly reorganizing around it. The US is cast as the world’s swing producer, (having taken over this role from Saudi Arabia a few years ago), but only if its shale answers. The Dallas Fed says half the US drillers will, but currently, we have rig counts slipping at $100 WTI and $66 break-evens ignored. (Read Cap Ex Baby, Cap Ex, Dec 2024). There is no grand peace deal that resets 2026, and on the horizon the market is actually pricing, no reset at all. Welcome to the new world where Drill Baby Drill might actually happen!
Demand Destruction
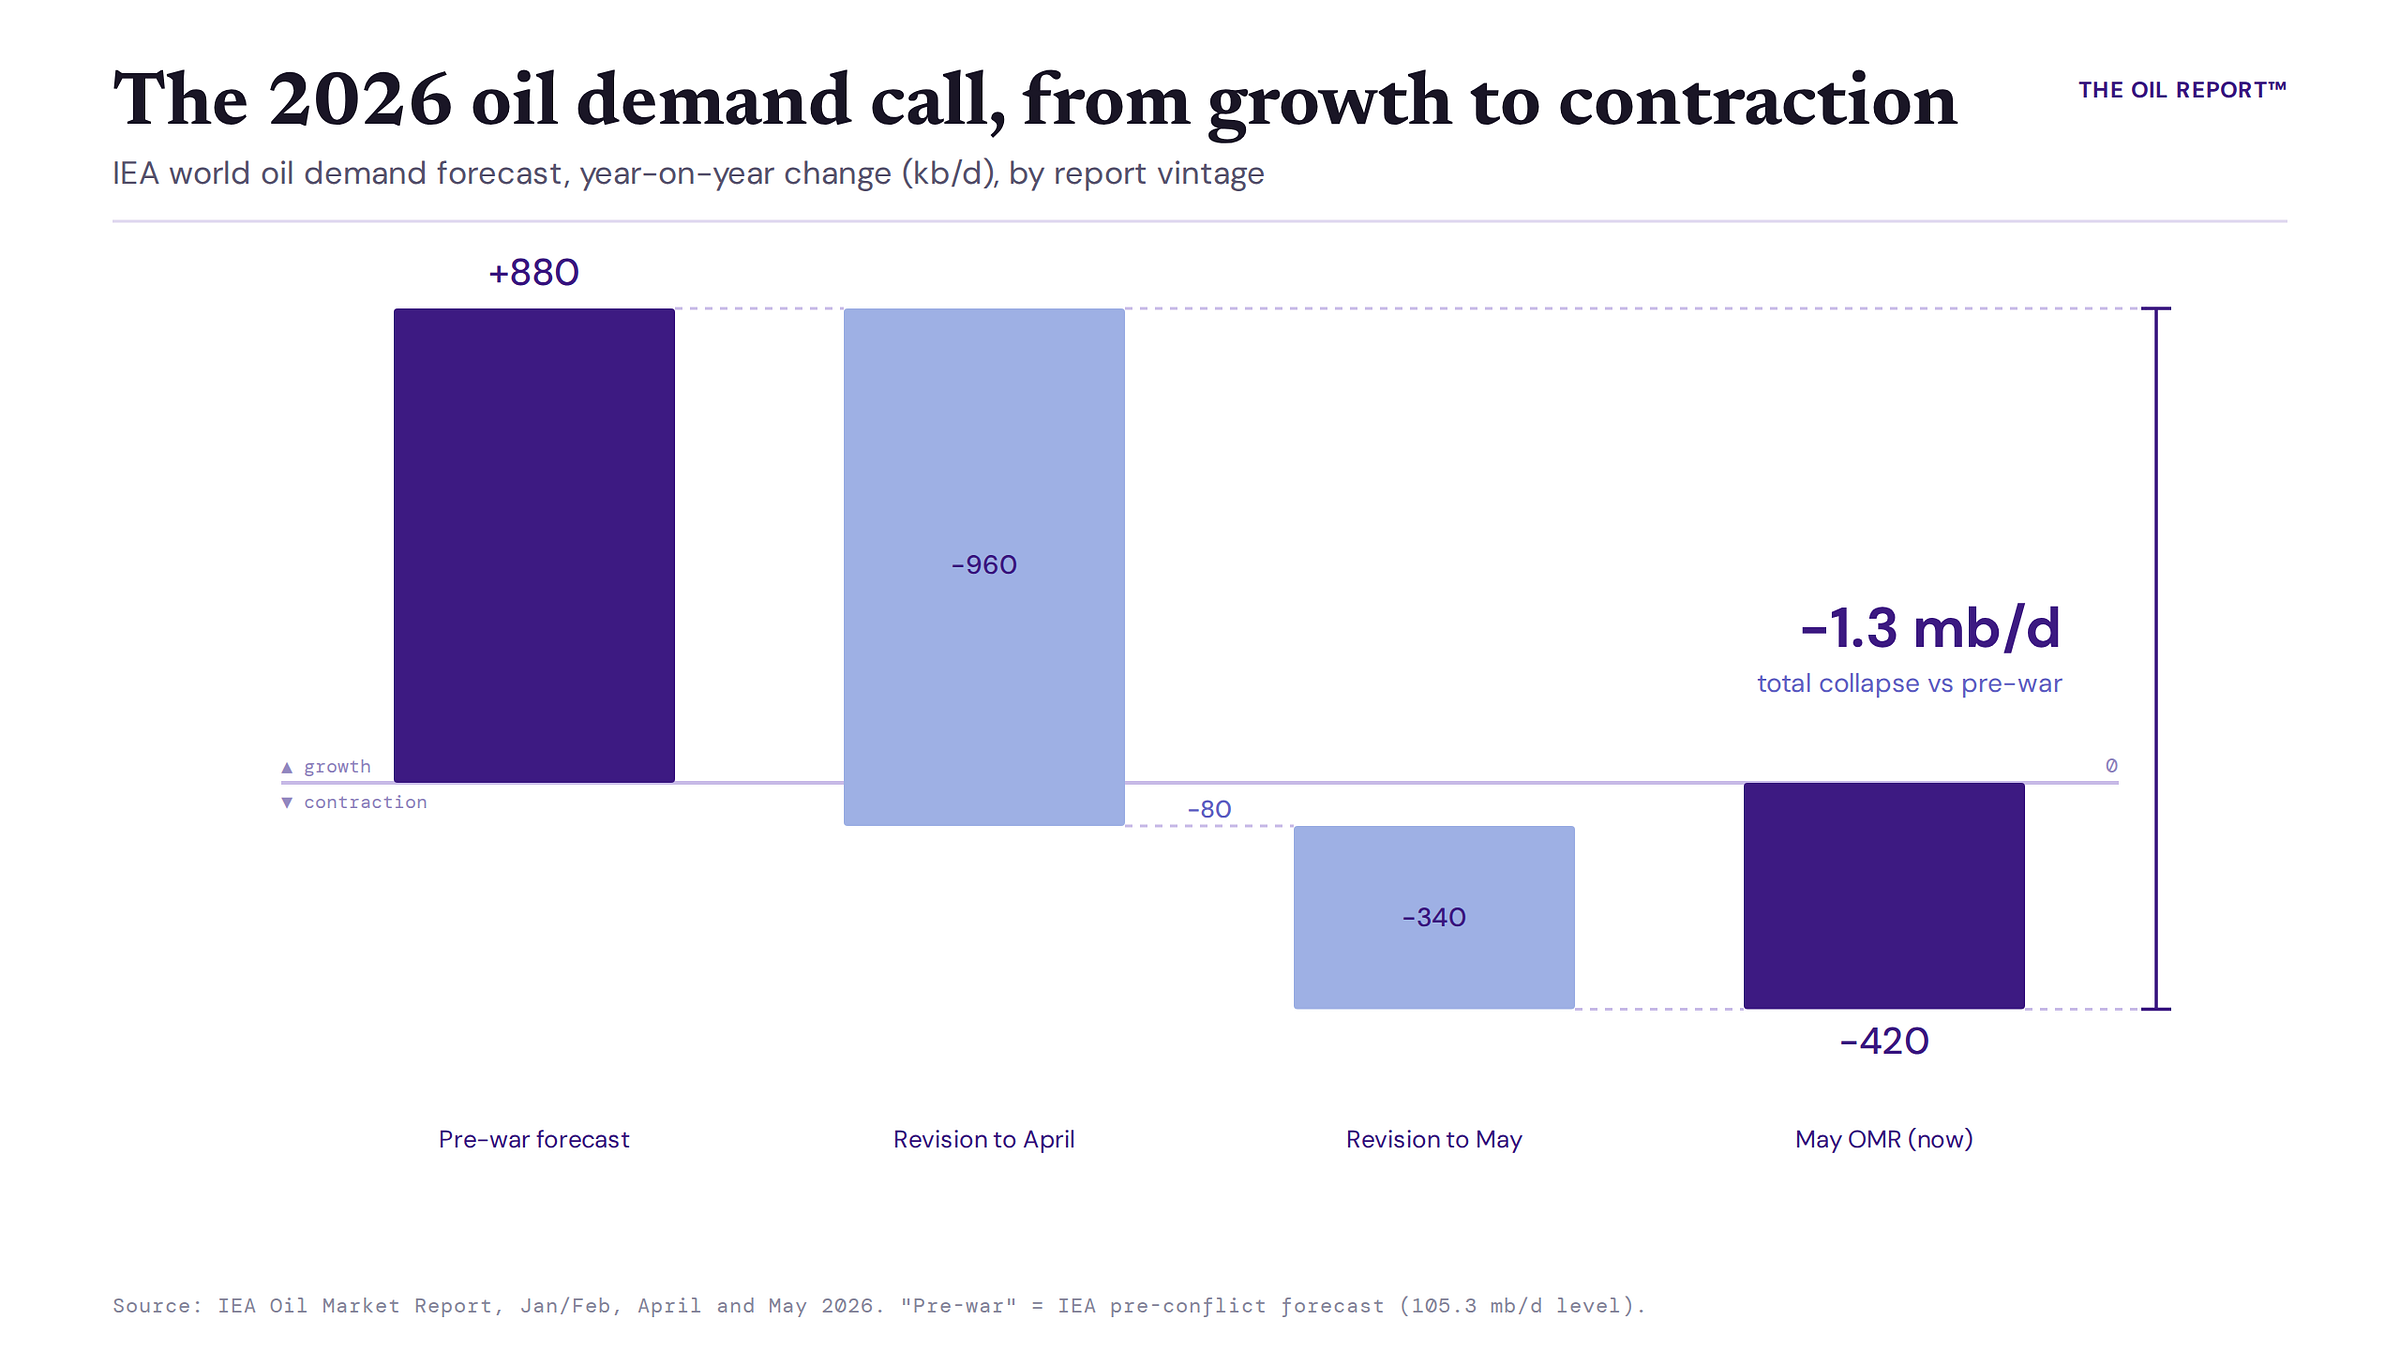
Demand destruction means one thing: consumers changing behaviour permanently, not returning to old habits even when prices fall. By that measure, most of what is being called demand destruction right now does not qualify.
The tell is in the refinery data. Asia’s runs fell 2.7 Mb/d in March because the feedstock stopped arriving, with crude imports at a 2016 low. Europe’s jet imports are running 60% below last year not because European airports went quiet, but because the Gulf stopped exporting. This is supply-side rationing wearing a demand mask.
The US refinery data is the contradiction. If demand were dying, the world’s marginal refiner would not be running at 93% utilization. It would not be posting record product exports of 3.3 Mb/d. And its domestic product stocks would not be hitting five-year lows.
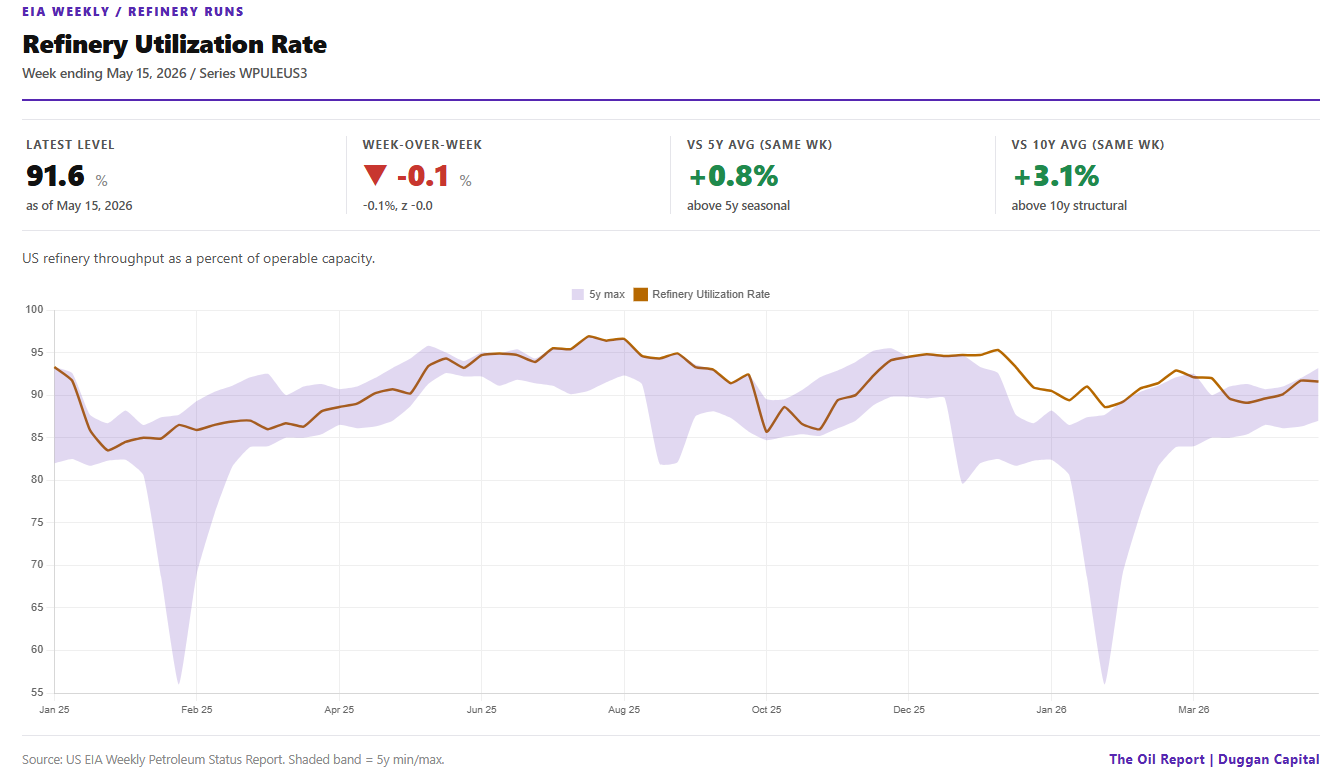
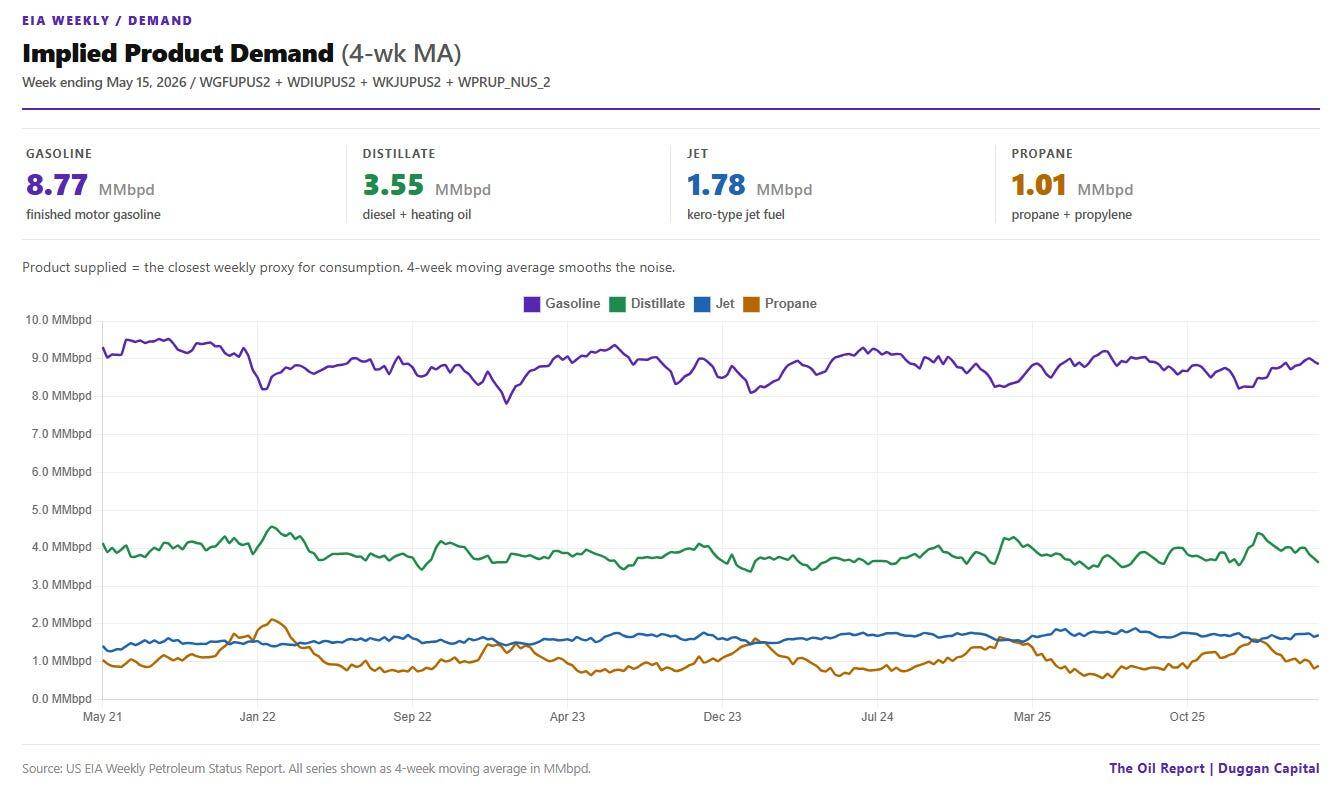
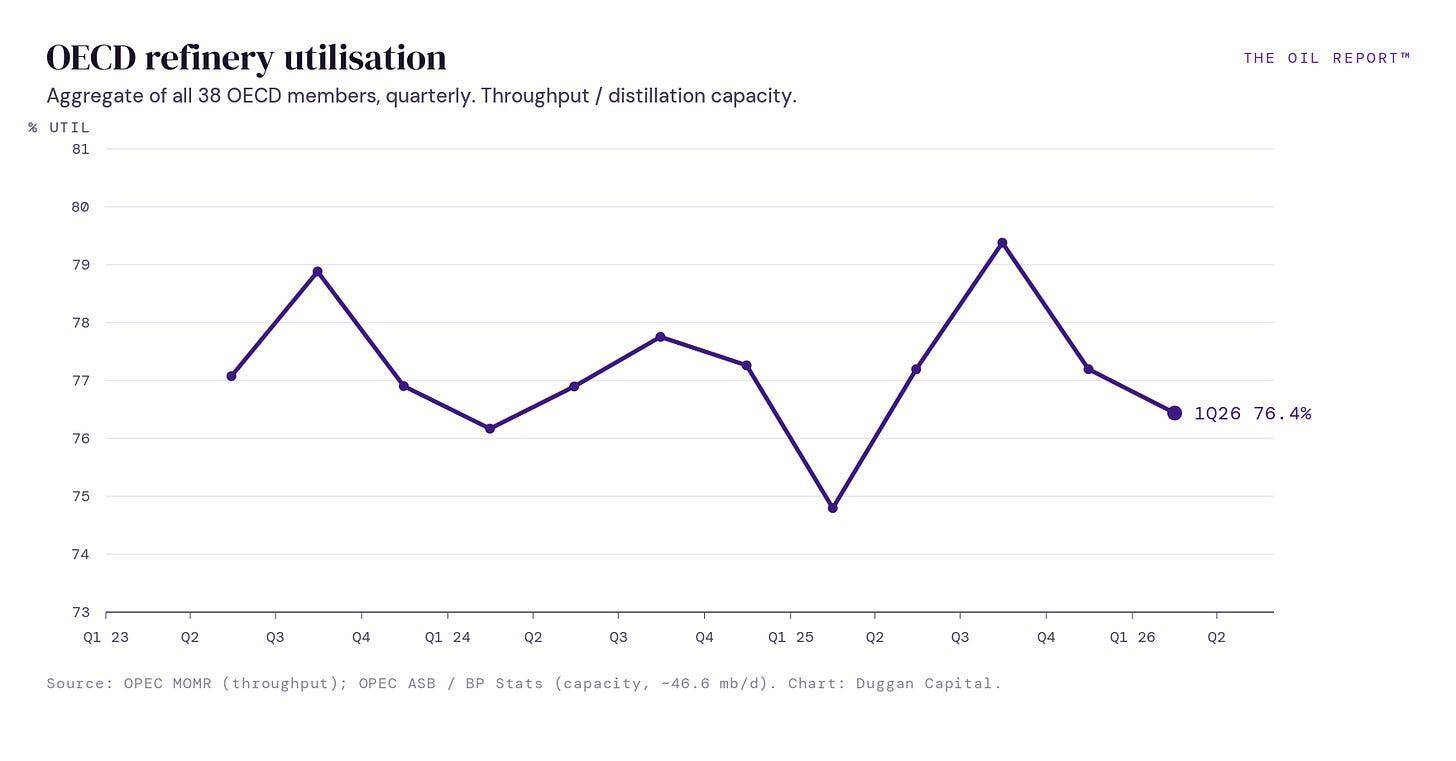
The US is running hot for two reasons, and they are different barrels. On the product side, margins of $24-31/bbl on the Gulf Coast are pulling throughput to 93% while record product exports drain domestic stocks to five-year lows. On the crude side, Washington has separately released around 31 mb from the SPR since early May, much of it going straight to allies in Europe. The backstop is bleeding from both ends.
To be clear: demand destruction is happening, just not everywhere. Aviation is the most obvious case, with global passenger kilometers falling year-on-year in March for the first time in five years. Jet fuel was the first product to go. Petrochemical feedstocks are contracting at depths last seen in the 2008-09 financial crisis. These are real.
The broader demand destruction talk is, for now, a mirage. It suggests the market self-corrects as consumption falls. What it is actually doing is forcing people to seriously consider the alternatives. Solar panels. EVs. Hybrids. That structural shift is real and it is accelerating. So its a supply led (rather than price) demand destruction.
China is the one case that does not resolve easily as the largest buyer. Seaborne imports and domestic fuel sales are both down. But onshore crude inventories are up 15% year-on-year and sitting near record highs. That looks less like a market running out of demand and more like a well-stocked buyer choosing not to import. It is the one I am watching most closely.
The obvious pushback is that demand will rebound. The EIA agrees, already pricing in a 1.5 Mb/d demand recovery in 2027 once supply flows resume in some way, shape or form. If it all comes back that cleanly, it was never destroyed. It was rationed. Essentially, what China has decided to do. The existing measures include export halts on refined fuels, production quotas and price caps and subsidies.
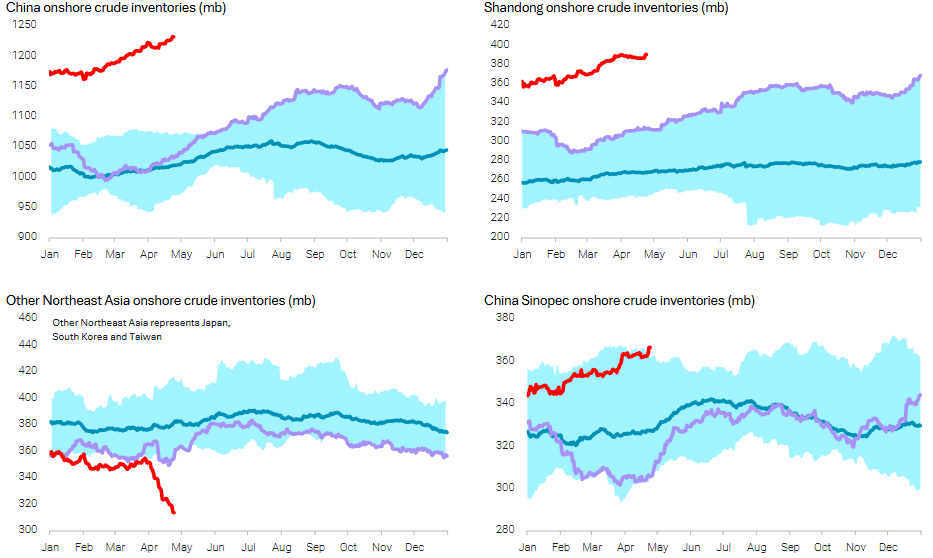
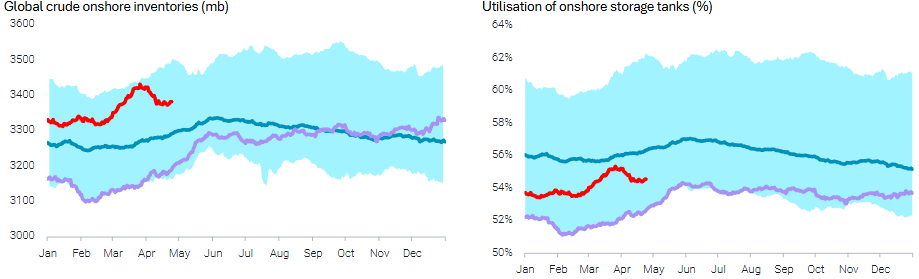

Source: Vortexa
Brent Oil Price Forecast
Every new Brent Oil analysis as it publishes, today's technical signal and key levels, live price — on one page.
See all Brent Oil forecastsInventories Conditions
If demand is not the relief valve, inventories are. And they are running off a cliff.
Goldman Sachs reports global visible stockpiles drew at 8.7 Mb/d in May, a record pace and nearly double the average since the war began. Around two-thirds of that is oil-on-water, the floating pipeline draining as Hormuz flows sit at 5% of normal. Kpler puts cumulative Middle East crude and condensate losses at 1 billion barrels-mentioned in last weeks report. The IEA estimates 246 mb of observed global inventory draw since the war began. These are different metrics. They all point the same way.
Nothing is coming to save us.
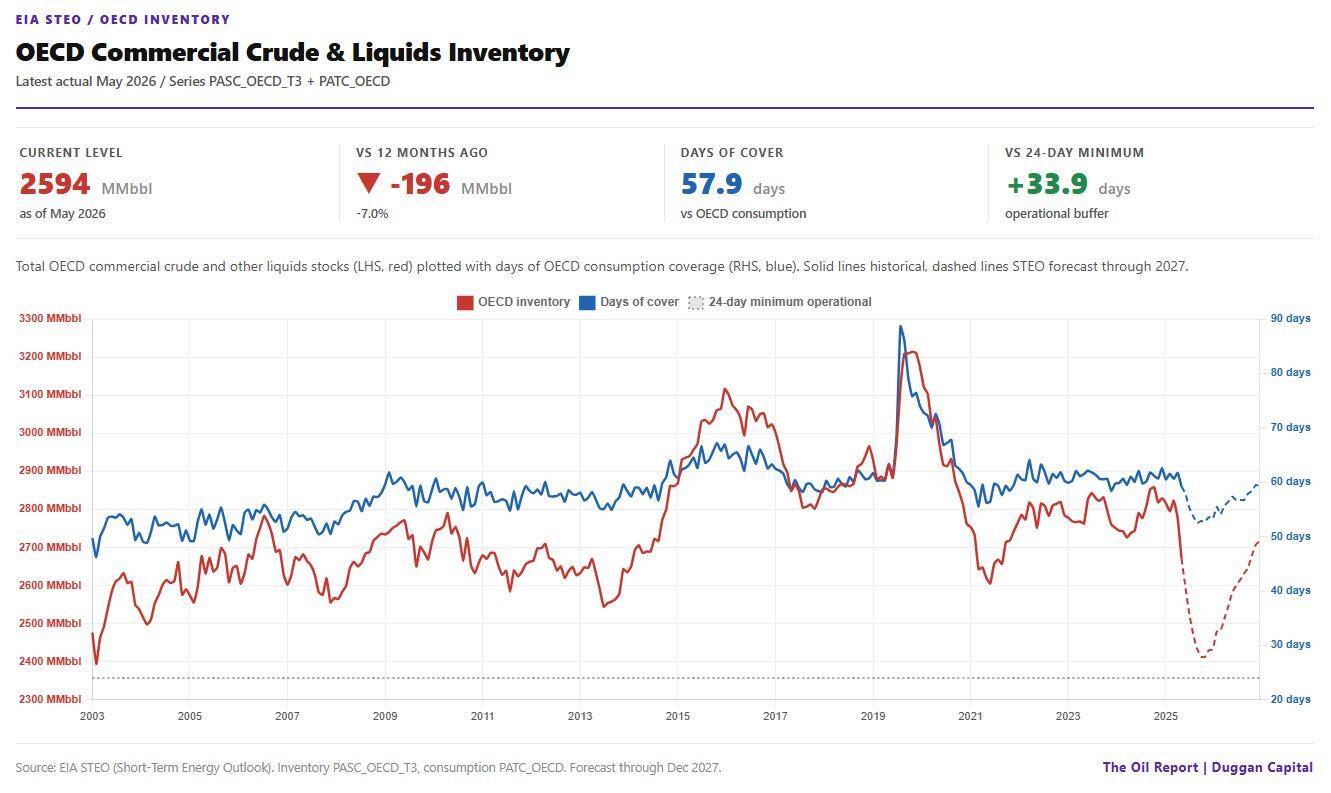
The US is running refineries at 93%, exporting a record 3.3 Mb/d of product, drawing its own Gulf Coast crude tanks, and has released around 31 mb from the SPR, much of it shipped to Europe. That is the world’s last shock absorber working at full capacity. It cannot do this forever.
And there is no cavalry. US shale will add between nothing and 250 kb/d in 2026 per the Dallas Fed, even with $66 break-evens being ignored at $90 oil. OPEC+ spare capacity sits at 170 kb/d, an all-time low, with most of it trapped behind Hormuz in any case. Middle East production is not coming back quickly. Infrastructure damage in Qatar alone is measured in years, not months.
Even in the IEA’s own base case, a gradual Hormuz reopening from June, supply does not catch up with demand until the fourth quarter. The EIA prices in a 1.5 Mb/d demand rebound in 2027, which would confirm this was rationing, not destruction.
The Net Net
A tank-bottom scenario is not a joke. That dotted line at the bottom of the chart is the 24-day operational minimum. The dashed forecast approaches it. This would be an event the world has never seen. Some countries will have nothing in strategic reserves, no stock tanks, and hardly any indigenous production or refinery. Ireland is one of them. In that world, the oil-producing nations hold the others essentially to ransom for supply, placing enormous political leverage in the hands of the US, Saudi Arabia, the GCC and Russia. The Game of Thrones continues. If I know anything, the world, and society, is simply not ready for that situation.
Commitment of Traders
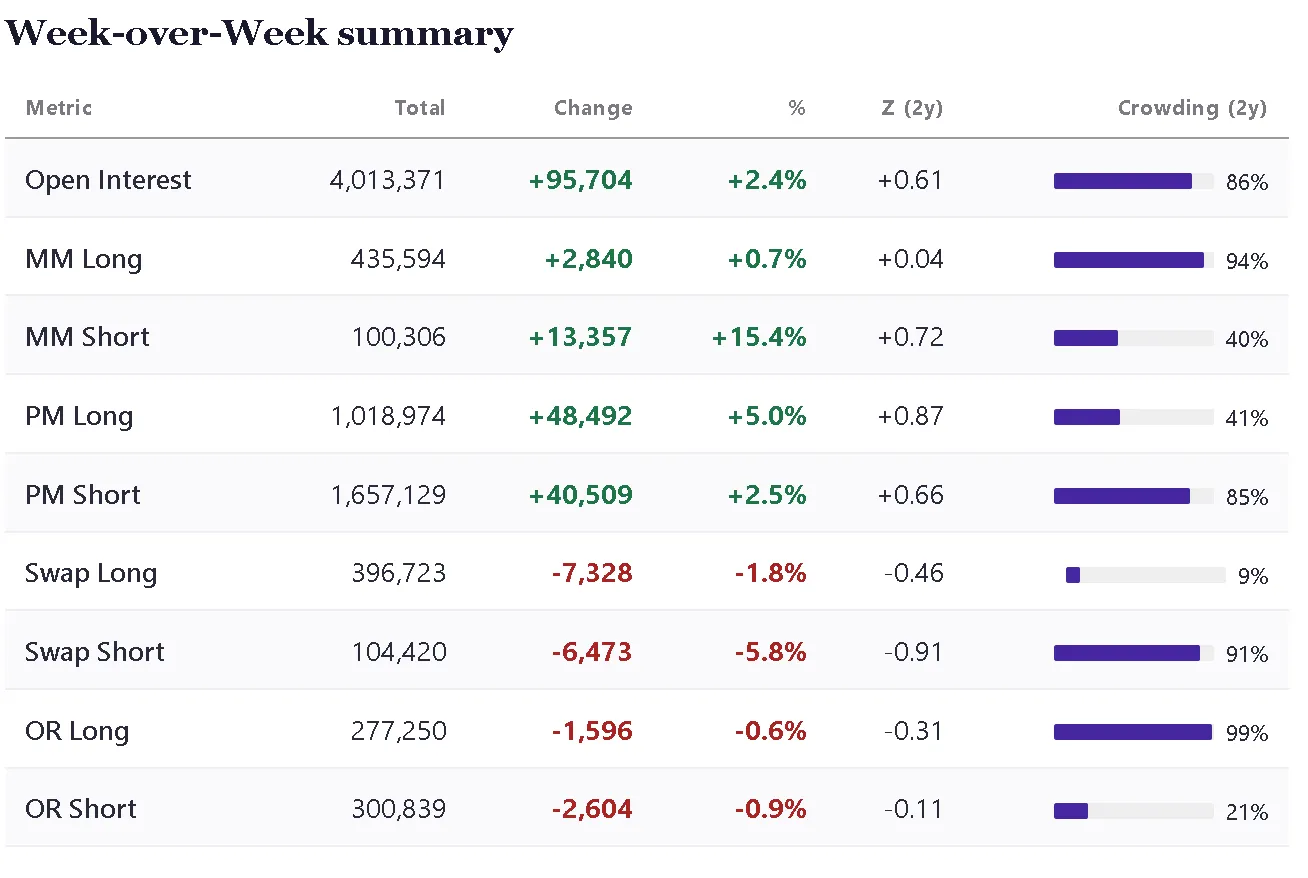
Product: Brent on ICE. Disaggregated 19th May 2026
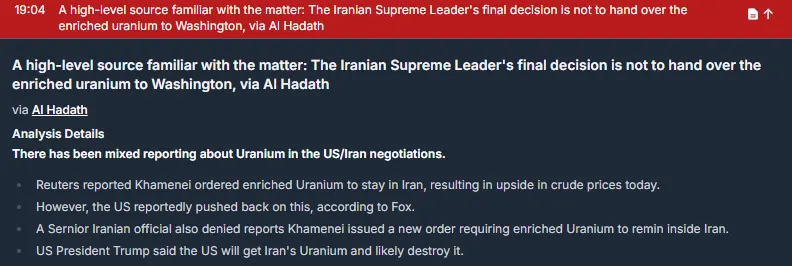
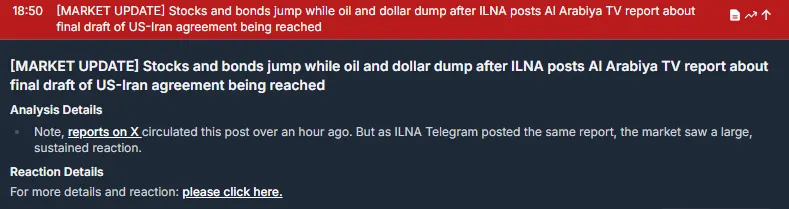
What do I think happens next? I think the short interest is really going for it, but Iran are essentially reversing all of their interest when denying Trumps reality distortion comments. It’s getting old at this point. Stay playing the longs but you have to suffer the pain of casino sellers and sovereign market intervention (market manipulation).
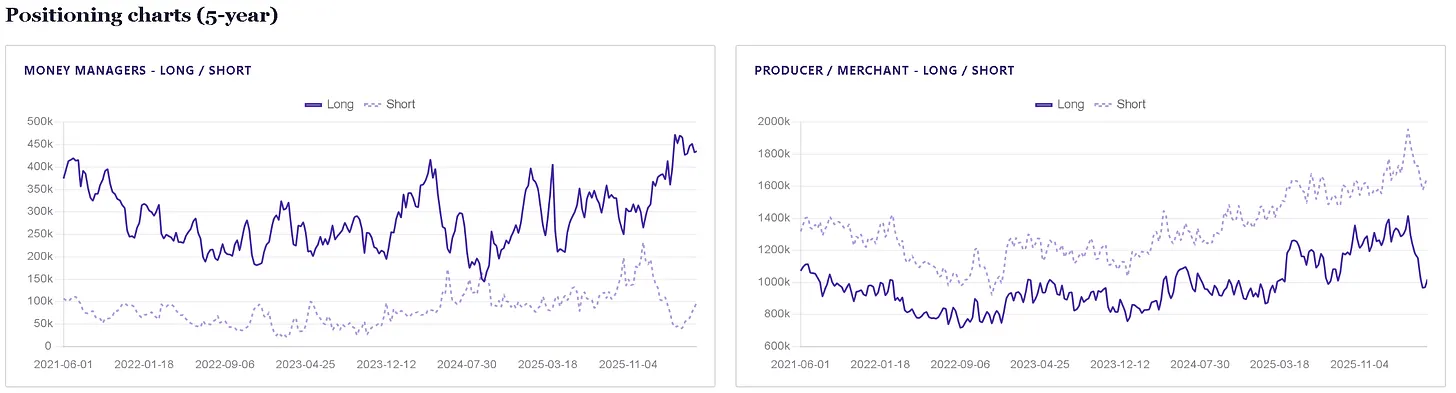
Setup: Money manager longs are at a 2-year extreme (94% crowding) – the long book is stretched and holders are not flinching. Short interest sits at 40% 2-year crowding, roughly 23% of the long book. Other Reportable are maximally long at 99% 2-year crowding – the non-managed-money non-commercial universe is not positioned for a breakdown. When this cohort is this crowded long, short sellers face a wall of potential buyers on any dip. Producers are heavily hedged – the physical side is locking in forward prices, which implies they see current levels as sellable. Swap dealer shorts are near a 2-year extreme – consistent with heavy producer hedging demand on the other side.
What’s the Next Move?
Trump knows the short selling and market operations (spr release, unsanctioning floating crude etc) are tools that have been used up already. He needs to sell a deal done headline and contain prices. He has failed. We go up from here.
Brent below $100 MAKES NO SENSE and only serves to highlight that this is a casino now and not a commodities contract based in any reality.
The narrative trade follows the shorts. The reality trade – is to buy and stay long. Sell the rumor, buy the fact!