


Brent is at $101, not $150, for one reason: China is currently a net seller of crude. Mercuria’s CEO says they have about three weeks of inventory left to dump. Thereafter, the world’s largest buyer steps back onto the bid into a market that is already 14.5 million barrels a day short.
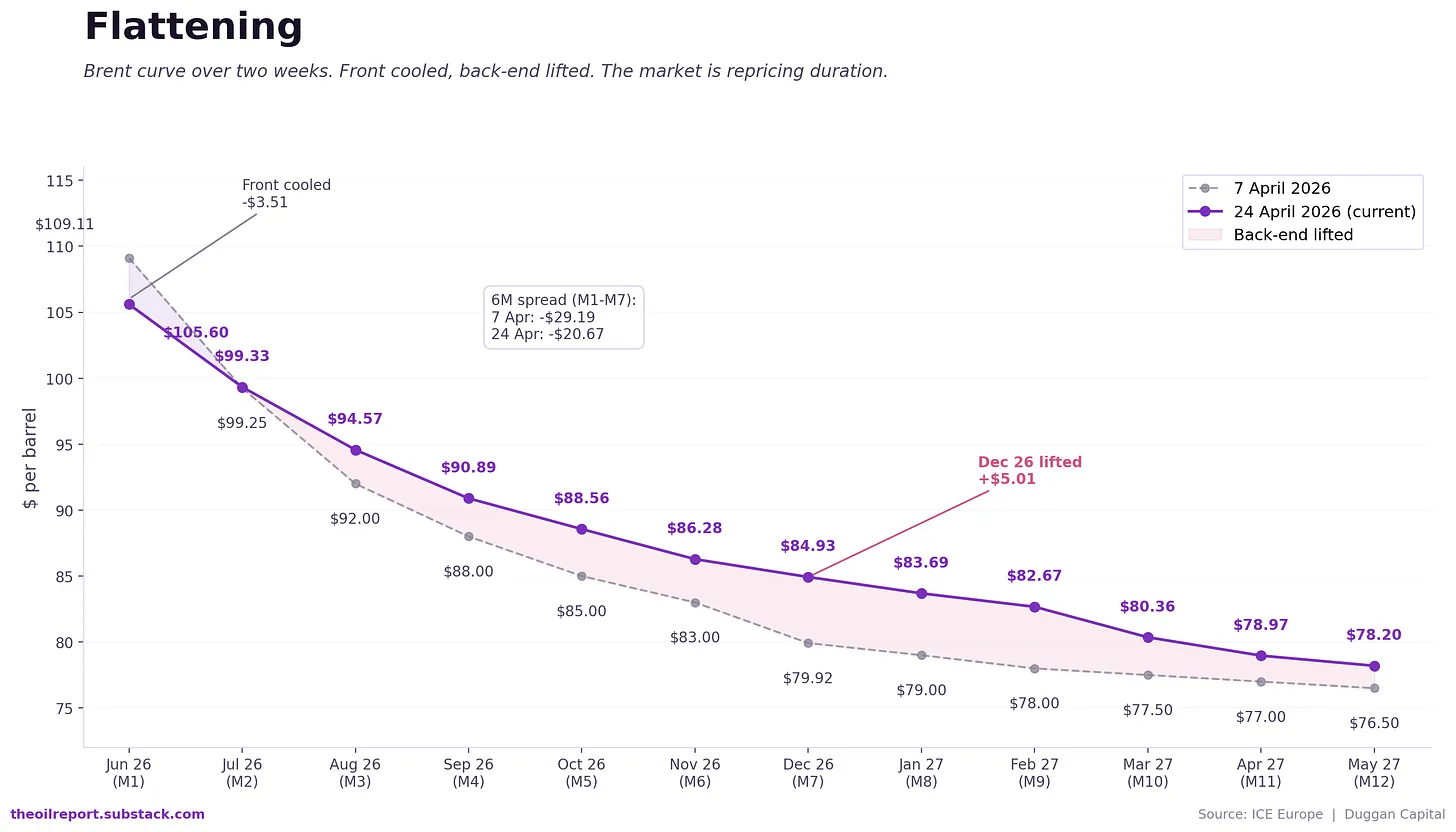
Countries across the world now working into SPR reserves. On average, the world has at a push approximately 100 days theoretical SPR reserves. Nonetheless, we are started that 100 days last week. The doomsday scenarios everyone is now talking about is this. If the war were to end tomorrow and the SOH were to be open by lunch 100%, it would still, AT BEST, take 120 days to get tankers back to the gulf and then onto their destinations. It would take another 20 days AT BEST, for those now loaded tankers from Hormuz, to get to the likes of Europe or India.
Oh, and by the way, there is a 6-month mine clearance job that needs doing in the SOH.
Trump and Netanyahu have now locked in what will be the most severe energy crisis the world has ever seen. So if Trump and Iran are going to do something, it must be now. More detail on this below in ‘Reality Bites’ section.
The Impact of Warfare on Market Risk
Iran laid a second round of mines in the Strait of Hormuz this week. Trump ordered the US Navy to shoot small boats on sight. And inside the building, the messaging cracked. On Apr 22, a senior DoD official briefed the House Armed Services Committee that full mine clearance would take six months. The Washington Post had the leak that afternoon. Within 24 hours, Pentagon spokesman Sean Parnell publicly called the assessment “an impossibility and completely unacceptable to the Secretary.” The Pentagon is telling Congress six months and telling the cameras it’s impossible. The market is being asked to price one of those two.
The main impact of these mines is that while The Whitehouse wants to carry the line that this will be all back to normal lickety-split, it simply won’t. The mines will take approximately 6 months to clear. This is what we know.
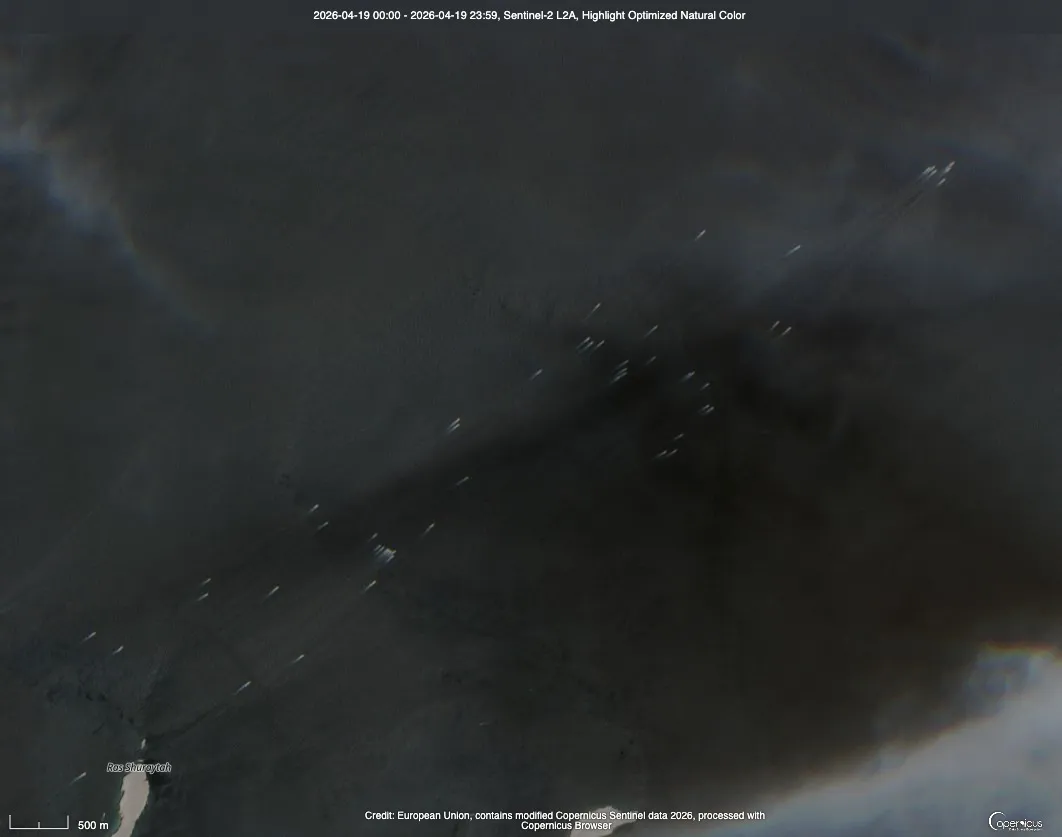
What matters is not the number. It is the fact that Iran can replenish the field at will. US strikes have destroyed 30 mine-laying vessels since the Apr 13 blockade, 16 of them in a single day on Tuesday last. Iran still has scores of Gashti-class small boats, each capable of carrying two to four mines. The DIA’s (Defence Intelligence Agency) 2019 estimate of Iran’s mine stockpile was over 5,000 mines. Fewer than 100 deployed. Less than 2% of inventory in use.
Every clearance timeline the market has been leaning on assumes a terminal count. The Pentagon’s own leaked six-month estimate to the House Armed Services Committee on Apr 22 assumes clearance begins only after the war ends and runs against a fixed set of weapons. A clearance operation that runs concurrently with active re-mining is not clearance. It is maintenance.
The USS George H.W. Bush arrived in CENTCOM on Thursday, the third US carrier in theatre. UK and German mine-clearance vessels are being held back for post-war deployment. Merz: “We could provide mine-clearance vessels. We are good at that.” Nobody is sending them into an active minefield.
The clearance clock cannot start while Iran keeps the strait a live problem. And Iran has no incentive to stop. Yuan-denominated transit tolls are now being deposited in the Iranian central bank. There goes the USD dominance just a little more – read Petro Dollar Protection series. The first revenues have cleared. Every week the strait remains contested is another week of leverage and another week of rent.
Brent Oil Price Forecast
Every new Brent Oil analysis as it publishes, today's technical signal and key levels, live price — on one page.
See all Brent Oil forecastsThe Buffers
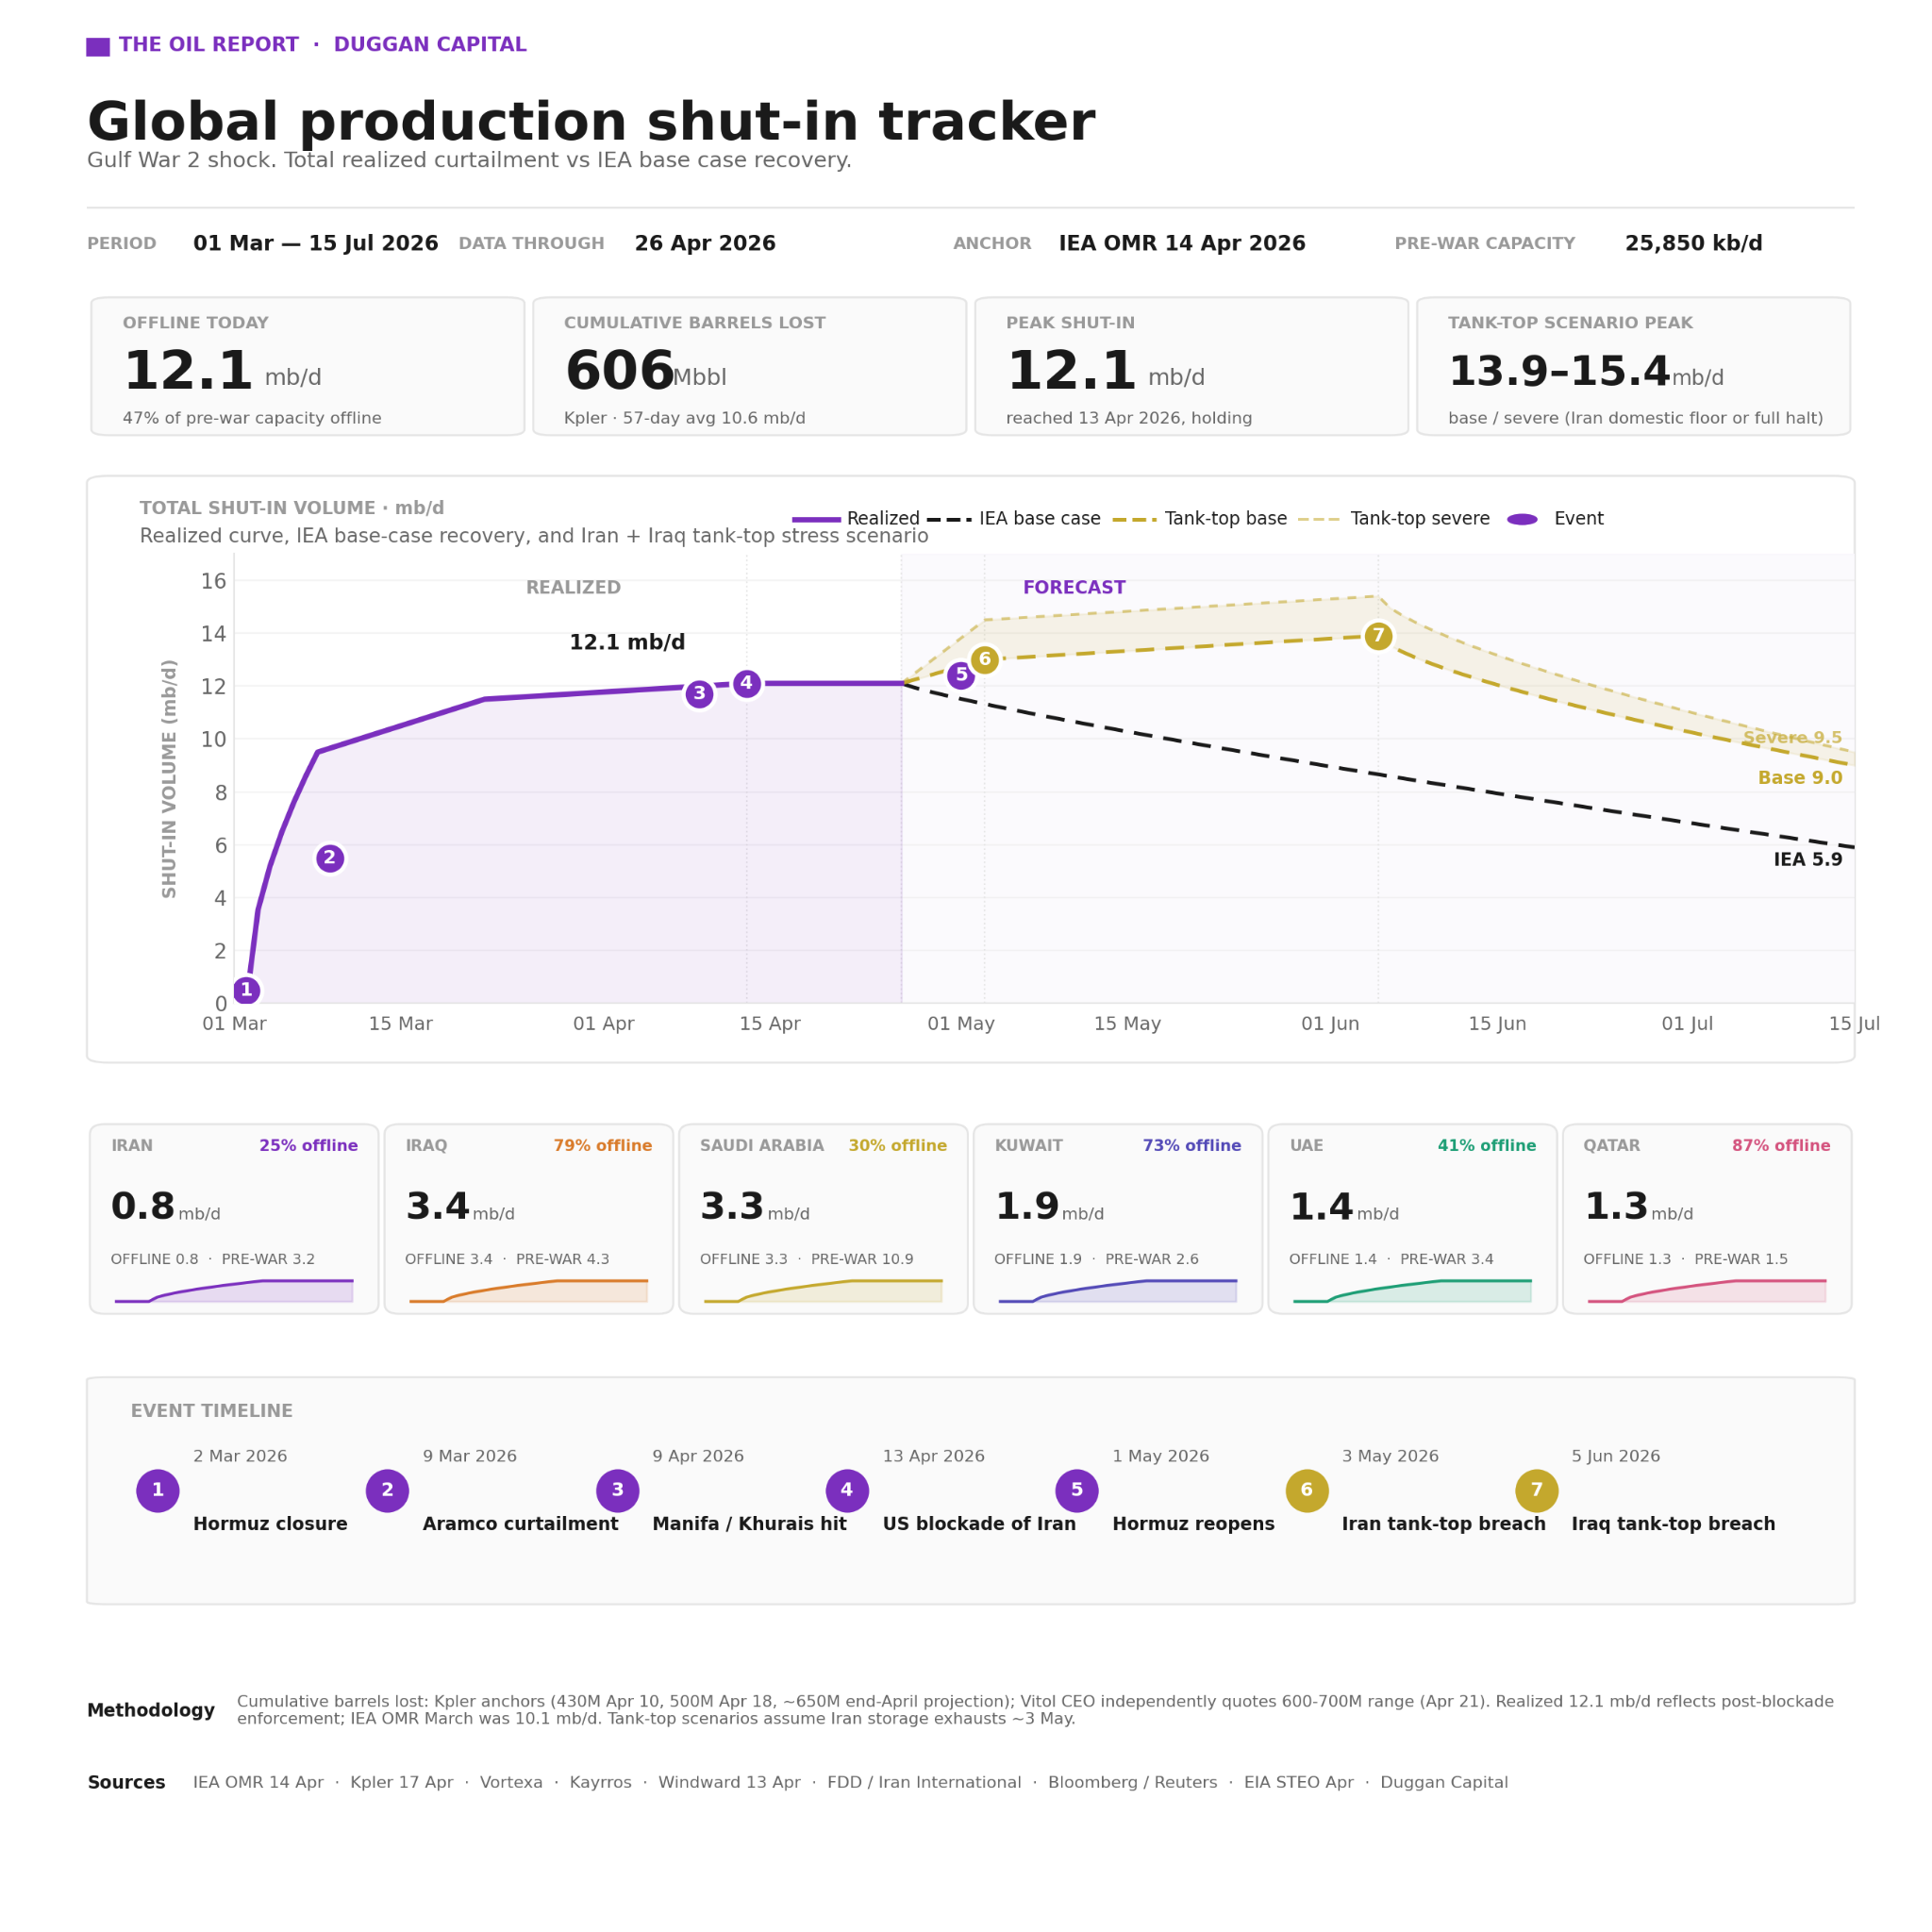
The global oil system is now rebalancing with about 8mbpd demand destruction. The situation is contained-despite draws from SPRs around the world. This is the emergency SPRs are built for, and they can hold for another approx 100 days on average. But the real reason oil is trading at $105 instead of $150 is something simpler. China is currently a net seller of crude, not a buyer.
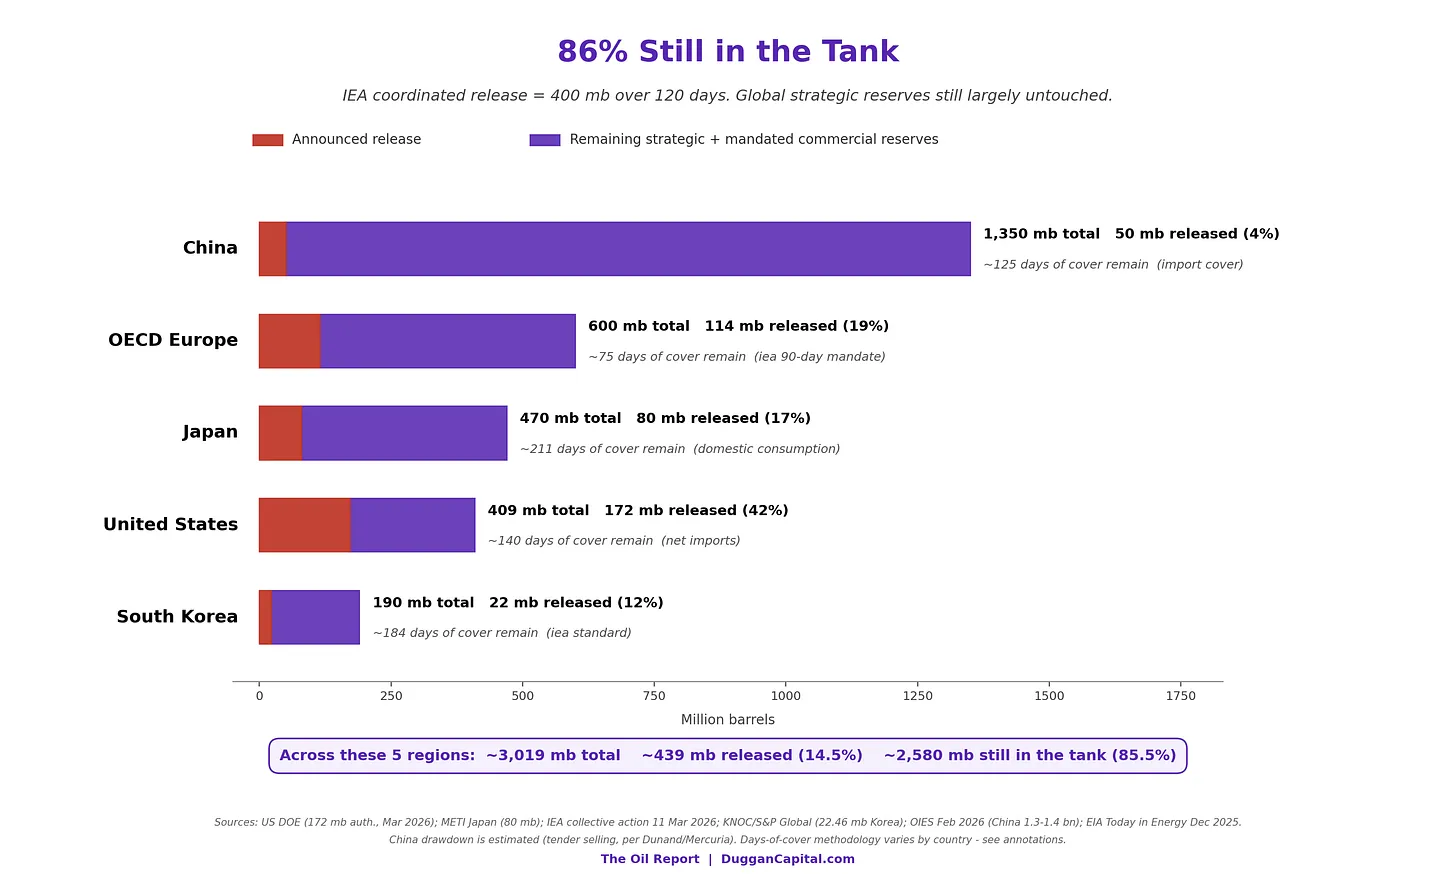
China Is Selling
Normal Chinese crude imports run around 11.5 million barrels a day (Dec peak 13.5). Gulf production is currently 12 million barrels a day below pre-war levels, 14,5mbpd per Goldman Sachs. If China is not just absent from the bid but actively putting barrels into the market, the demand side has subtracted roughly the same volume the supply side has lost. That is the arithmetic keeping Brent in the low triple digits.
Vortexa’s latest weekly data shows Chinese onshore crude at 1.3billon barrels. 200 million barrels above year-ago levels. 213 million above the seasonal average. Multi-year highs. China is running down the largest single-owner stockpile in the world rather than replacing it through the tender market.
At the FT Commodities Global Summit in Lausanne last week, Mercuria CEO Marco Dunand told the room that Chinese companies have been “aggressively selling crude oil” into global tenders for the past two to three weeks. OilPrice this week: “China’s Oil Giants Begin Selling Crude as Refinery Cuts Deepen.” A parallel headline the same day: “China Oil Buying Set to Return After Stockpile Drawdown.”
Every one of those data points says the same thing. China is net selling into a market the rest of the world thinks is undersupplied.
The Double Swing
Dunand’s estimate: three weeks. That is how long he thinks China can keep releasing inventory before it has to revise its position. The US is in a similar position where it is exporting about 5mbpd. As it approaches its reserve low threshold, over the next 30 days, it must cease these exports.
When that happens, China does not just step back onto the bid. It goes from net seller to net buyer in a single move. Roughly 13 million barrels a day of demand returns to a market already short 14.5 million barrels on the supply side. The physical shortage stops being masked. Price discovery starts again. Personally, I think China will remain net seller which will serve to subdue new all-time highs on both major grades WTI and Brent.
Three weeks from now we will see.
The Supporting Factors
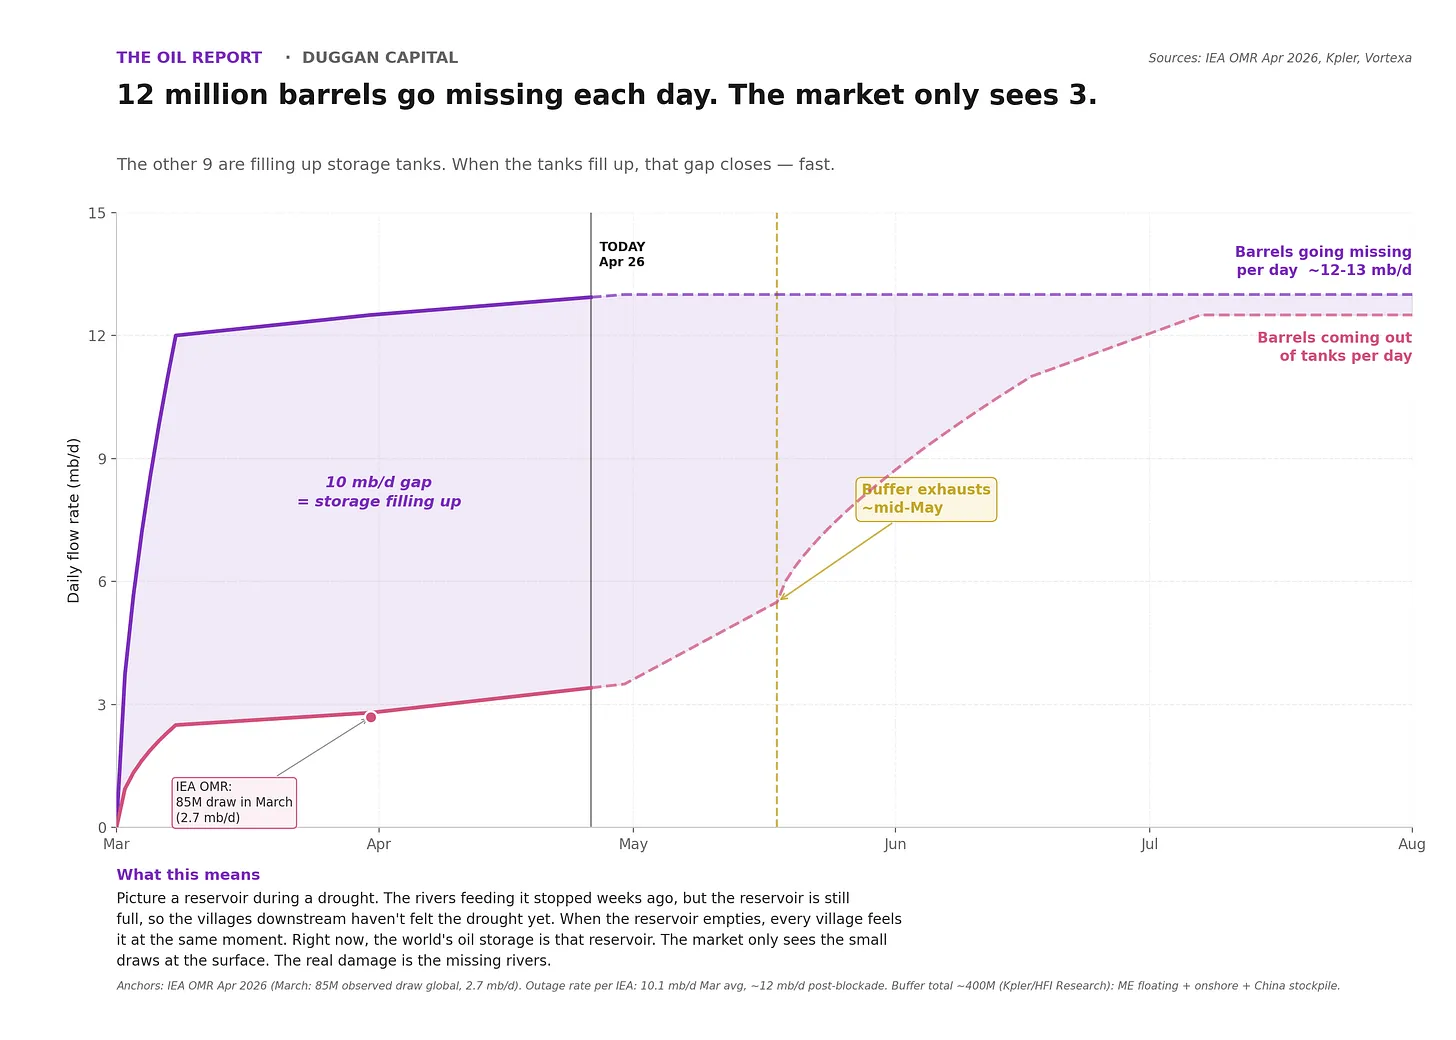
Three other strategic reserves are being drawn in parallel.
OECD commercial inventories are on pace to hit JPMorgan’s 30-day operational threshold around mid-to-late May. Japan announced an 80 million barrel release this week, 45 days of domestic supply. Other Asia is running down at 8.7% year-on-year. Pakistan issued its first LNG spot tender since December 2023 last Thursday. For 28 months, it had been trying to offload cargoes it didn’t need. Last week Pakistan was a seller. This week it is a buyer. Bangladesh and Egypt are running similar dynamics.
These SPR reserves will hold for a long time. They are being drawn for exactly the reason they were built. The drawdown has started across all four at the same time.
Reality Bites
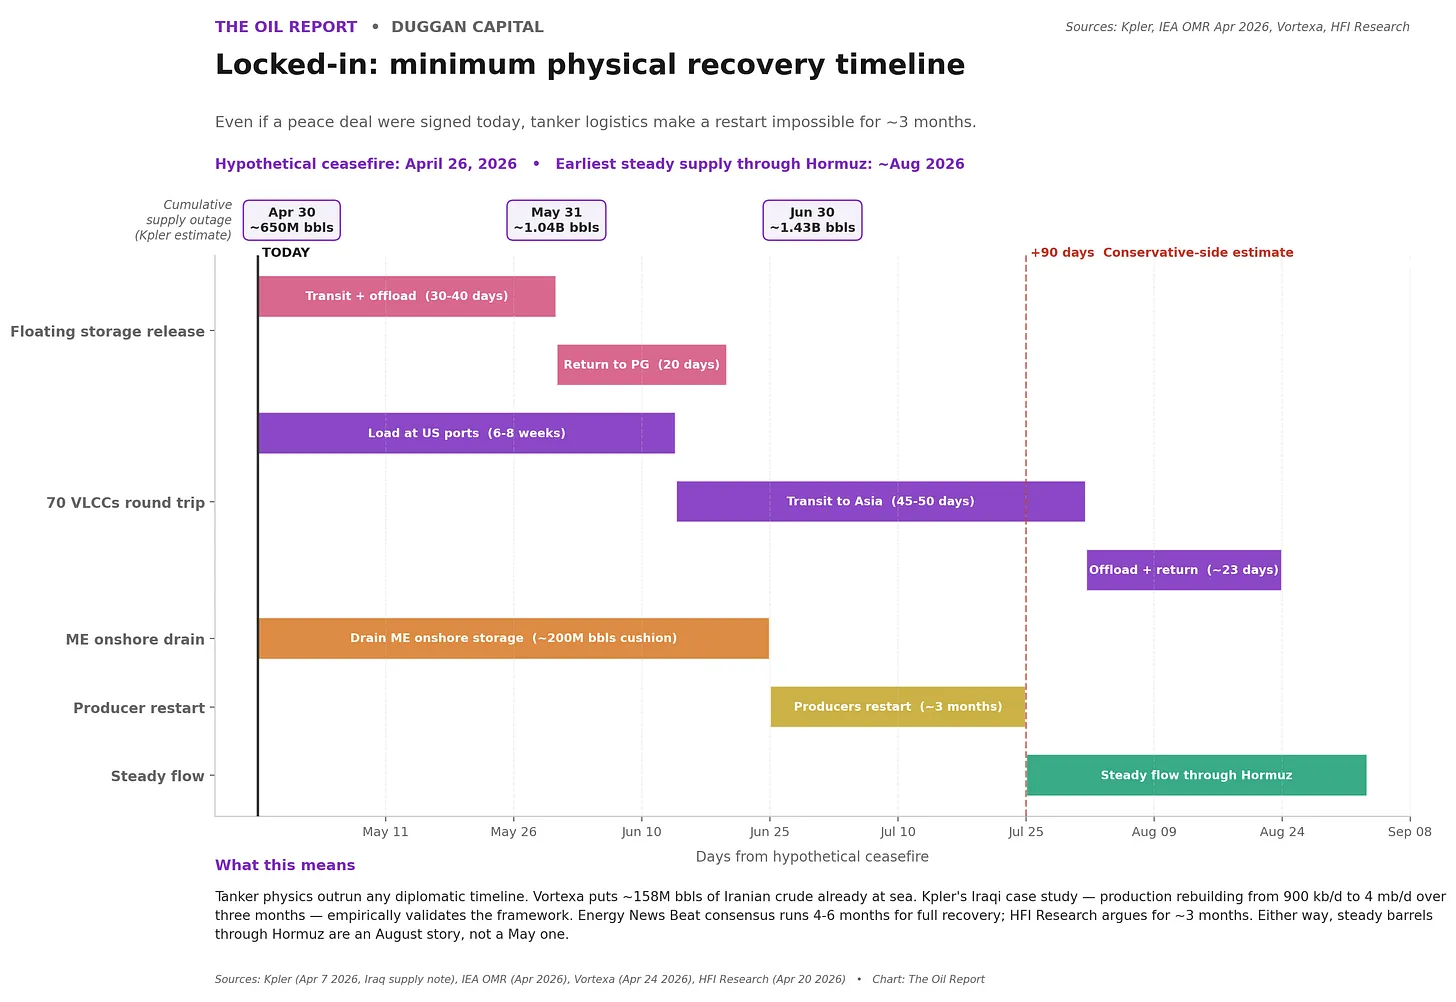
Pre-war global oil balance:
- Supply: 104 mb/d
- Demand: 104 mb/d
- Net inventory change: roughly zero
Today’s balance (April 2026):
- Supply: 92 mb/d (down 12)
- Demand: 95 mb/d (down 9 – demand destruction)
- Net inventory drawdown: 3 mb/d
Commitment Of Traders Report
Product: BRENT ON ICE EU.
Report: Disaggregated
Report date data captured: 21st April. Released 24th April 2026.
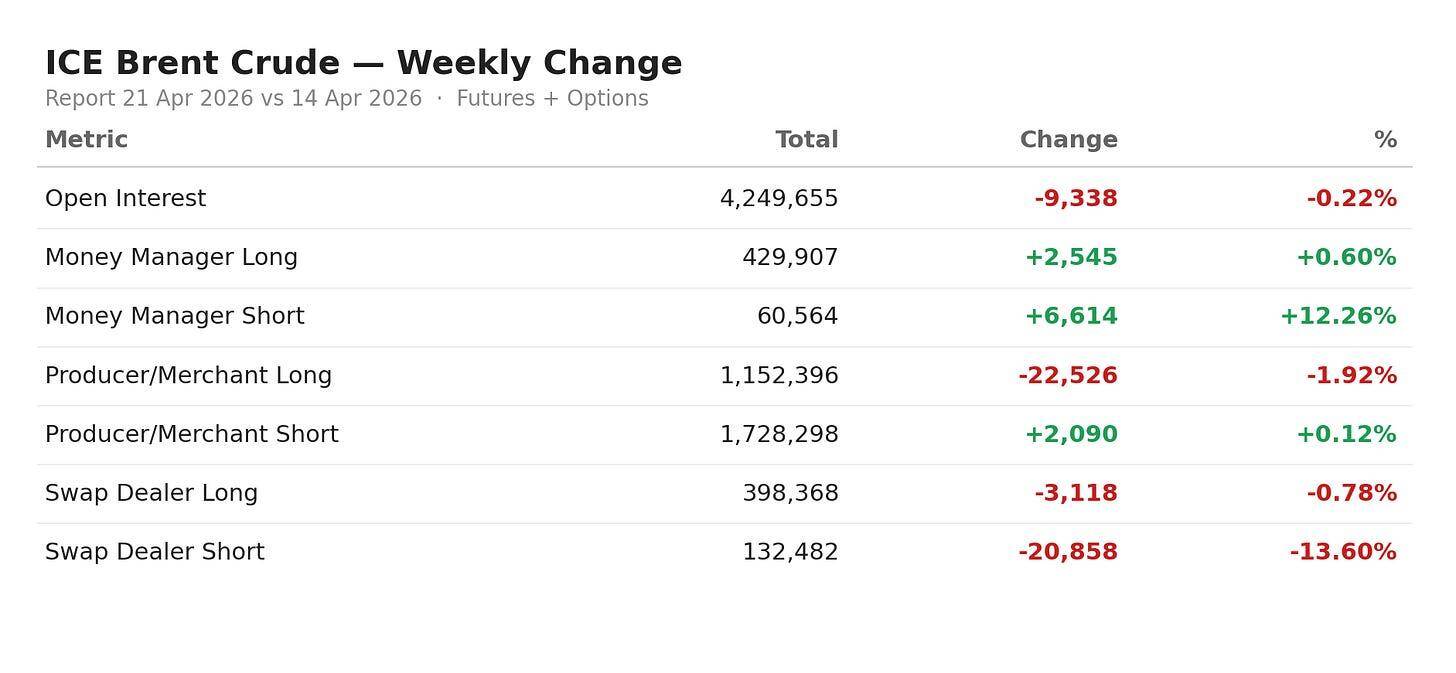
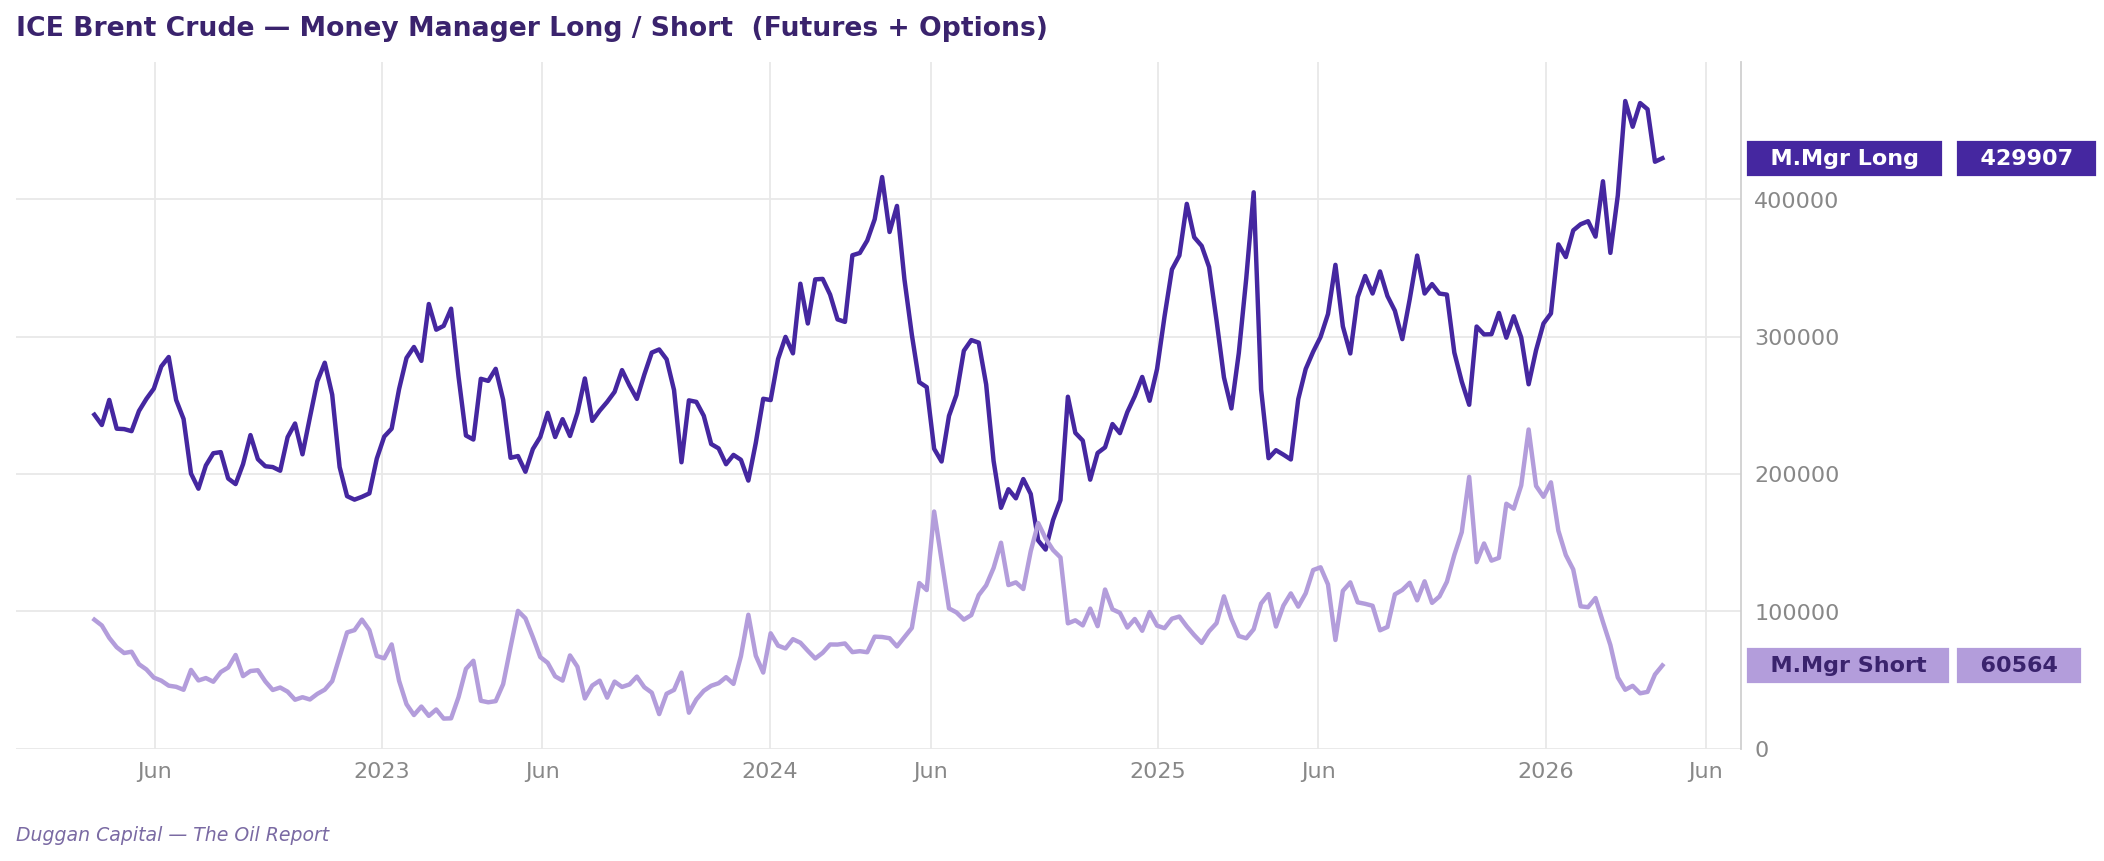
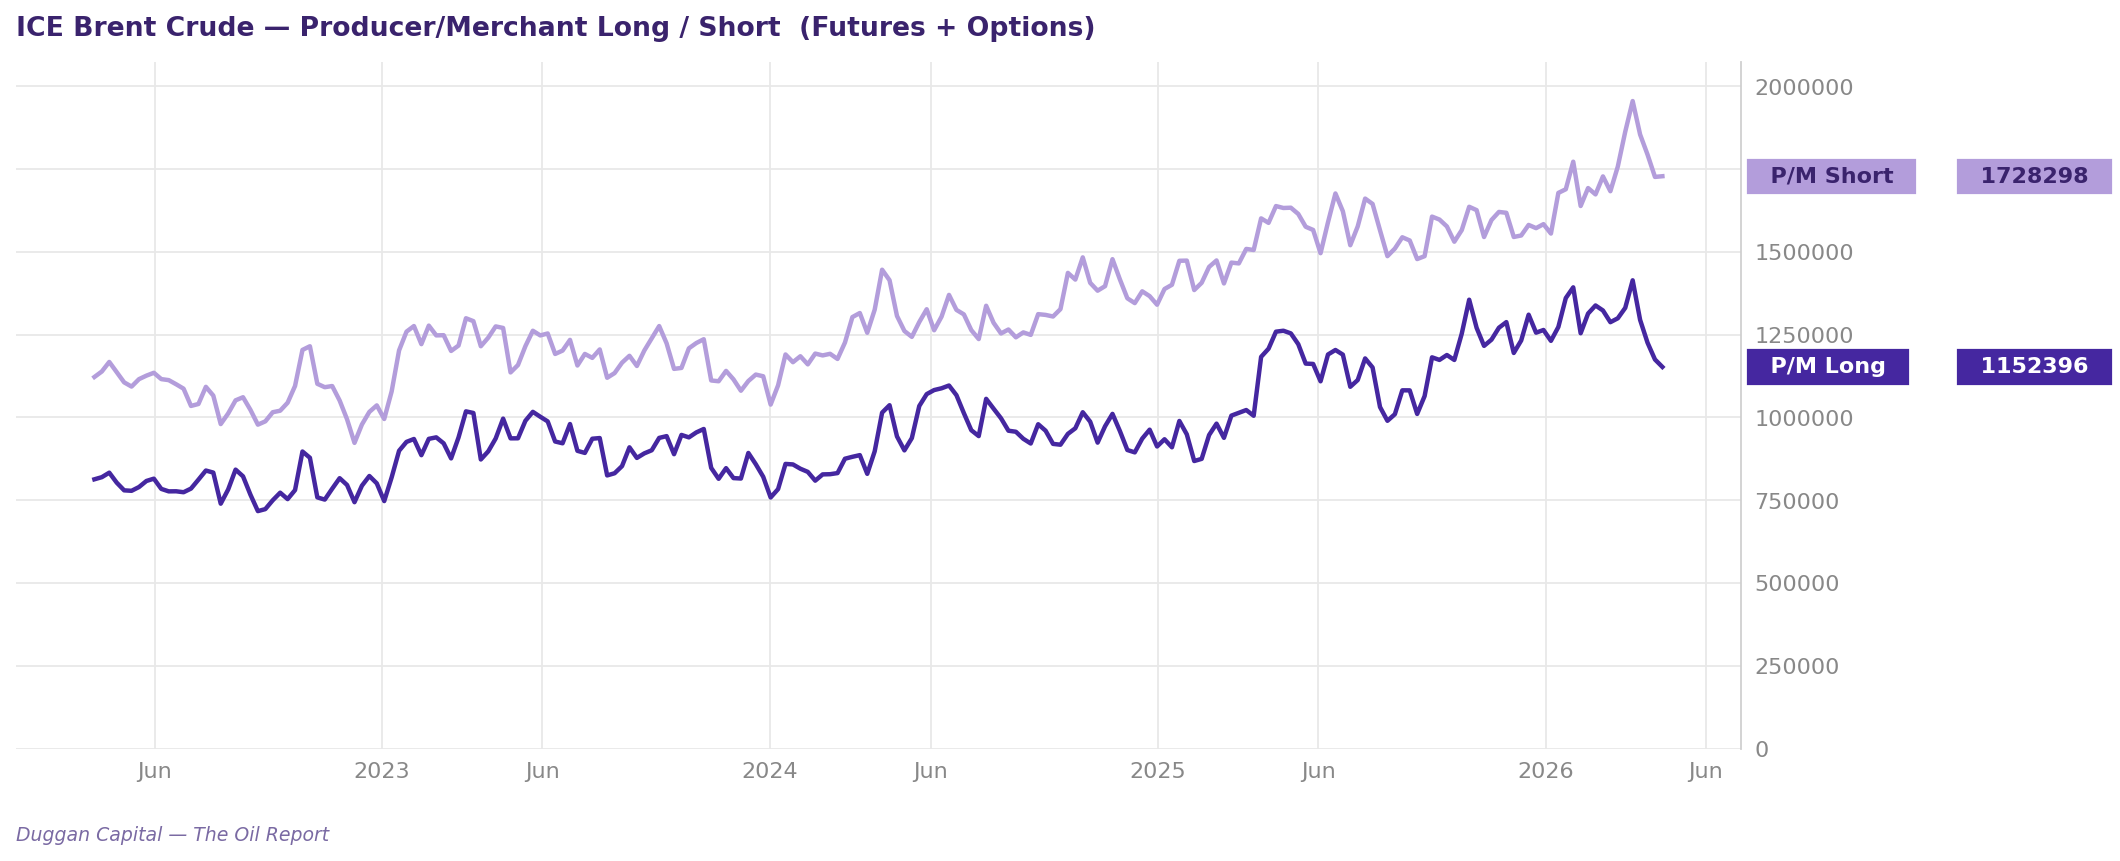
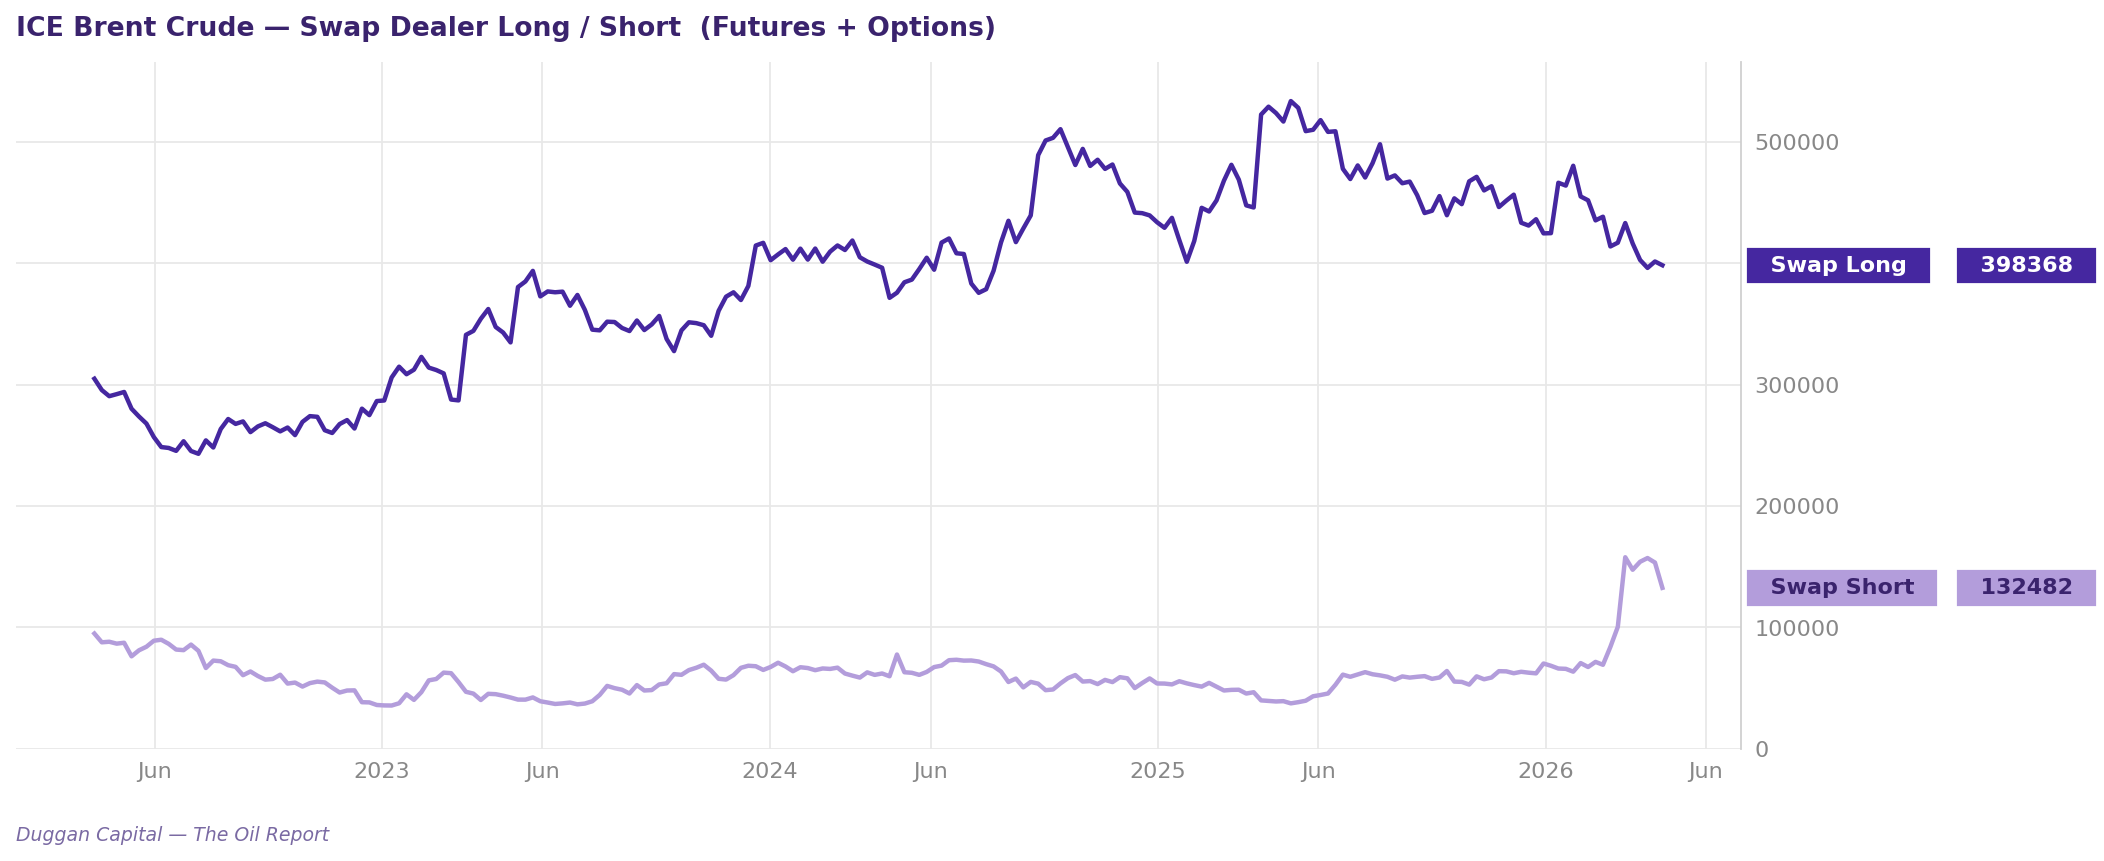
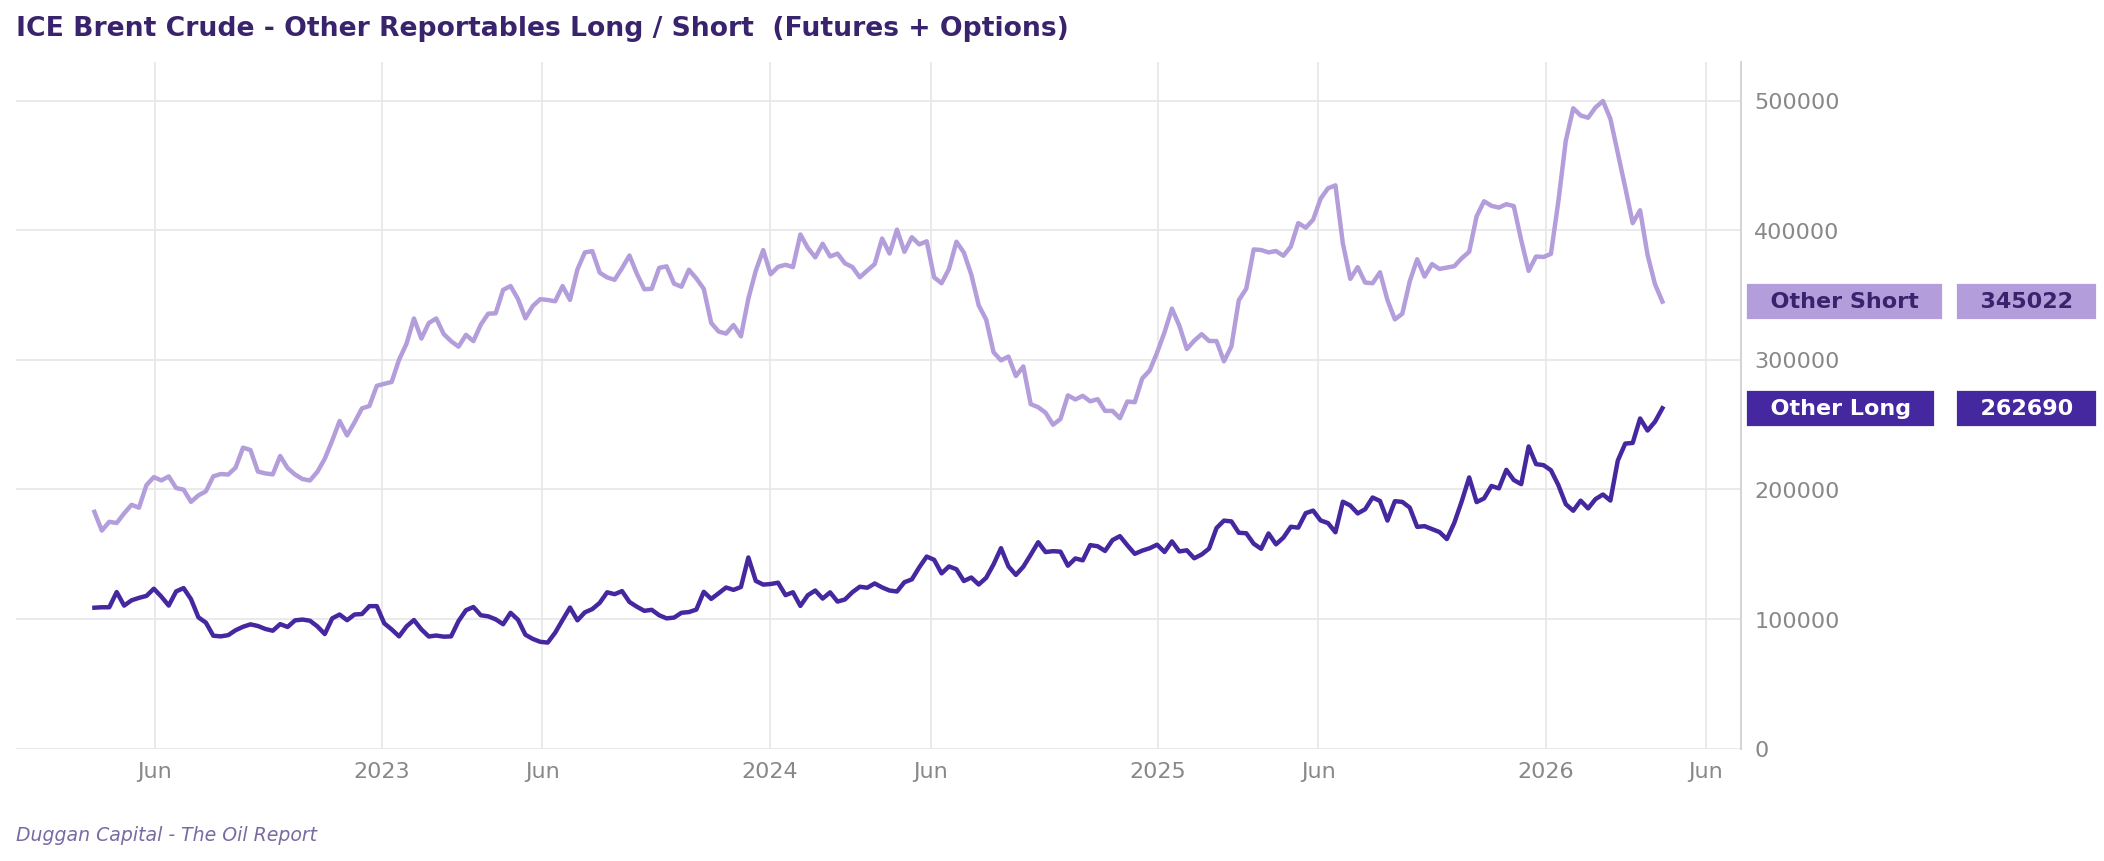
ICE Brent COT for the week ending 21 April 2026 is showing a classic crowded setup. Hedge funds (the “money managers”) are aggressively long – among their most bullish positioning of the past two years. Commercial producers are heavily short, locking in prices at near-record levels. The swap dealers who sit in the middle of those flows are now carrying their biggest short book in 13 years to offset all that producer hedging.
In plain terms: speculators are betting on higher prices while the people who actually produce oil are racing to lock in today’s prices. That kind of one-sided positioning has only happened a handful of times – in 2018 and 2020 – and on both occasions it was followed by a sharp drop in oil prices as the bullish bets unwound. The one tentative positive this week is that swap dealers trimmed about 21,000 short contracts (13.6%), which could be an early sign the hedging wave is starting to ease. Not yet a trend. Next Friday’s release is the tell: if swap dealer shorts keep falling while hedge funds stay long, the imbalance is resolving the friendly way; if hedge funds start trimming their longs, that’s distribution and the price likely heads lower. Trade Donald’s distortion field for the fast trade, trade what the Iranians are doing for the longer trade.
Swap Dealers
What’s The Next Move?
As we enter into these 100 days of reality, the market has some extreme upside drivers. The move to secure physical deliveries over the next 3 front contracts will be incredible. Many physical traders will have already secured their contracts over the prior 60 days. It may be a largely also and speculators market in here for the next 3 months due to this.
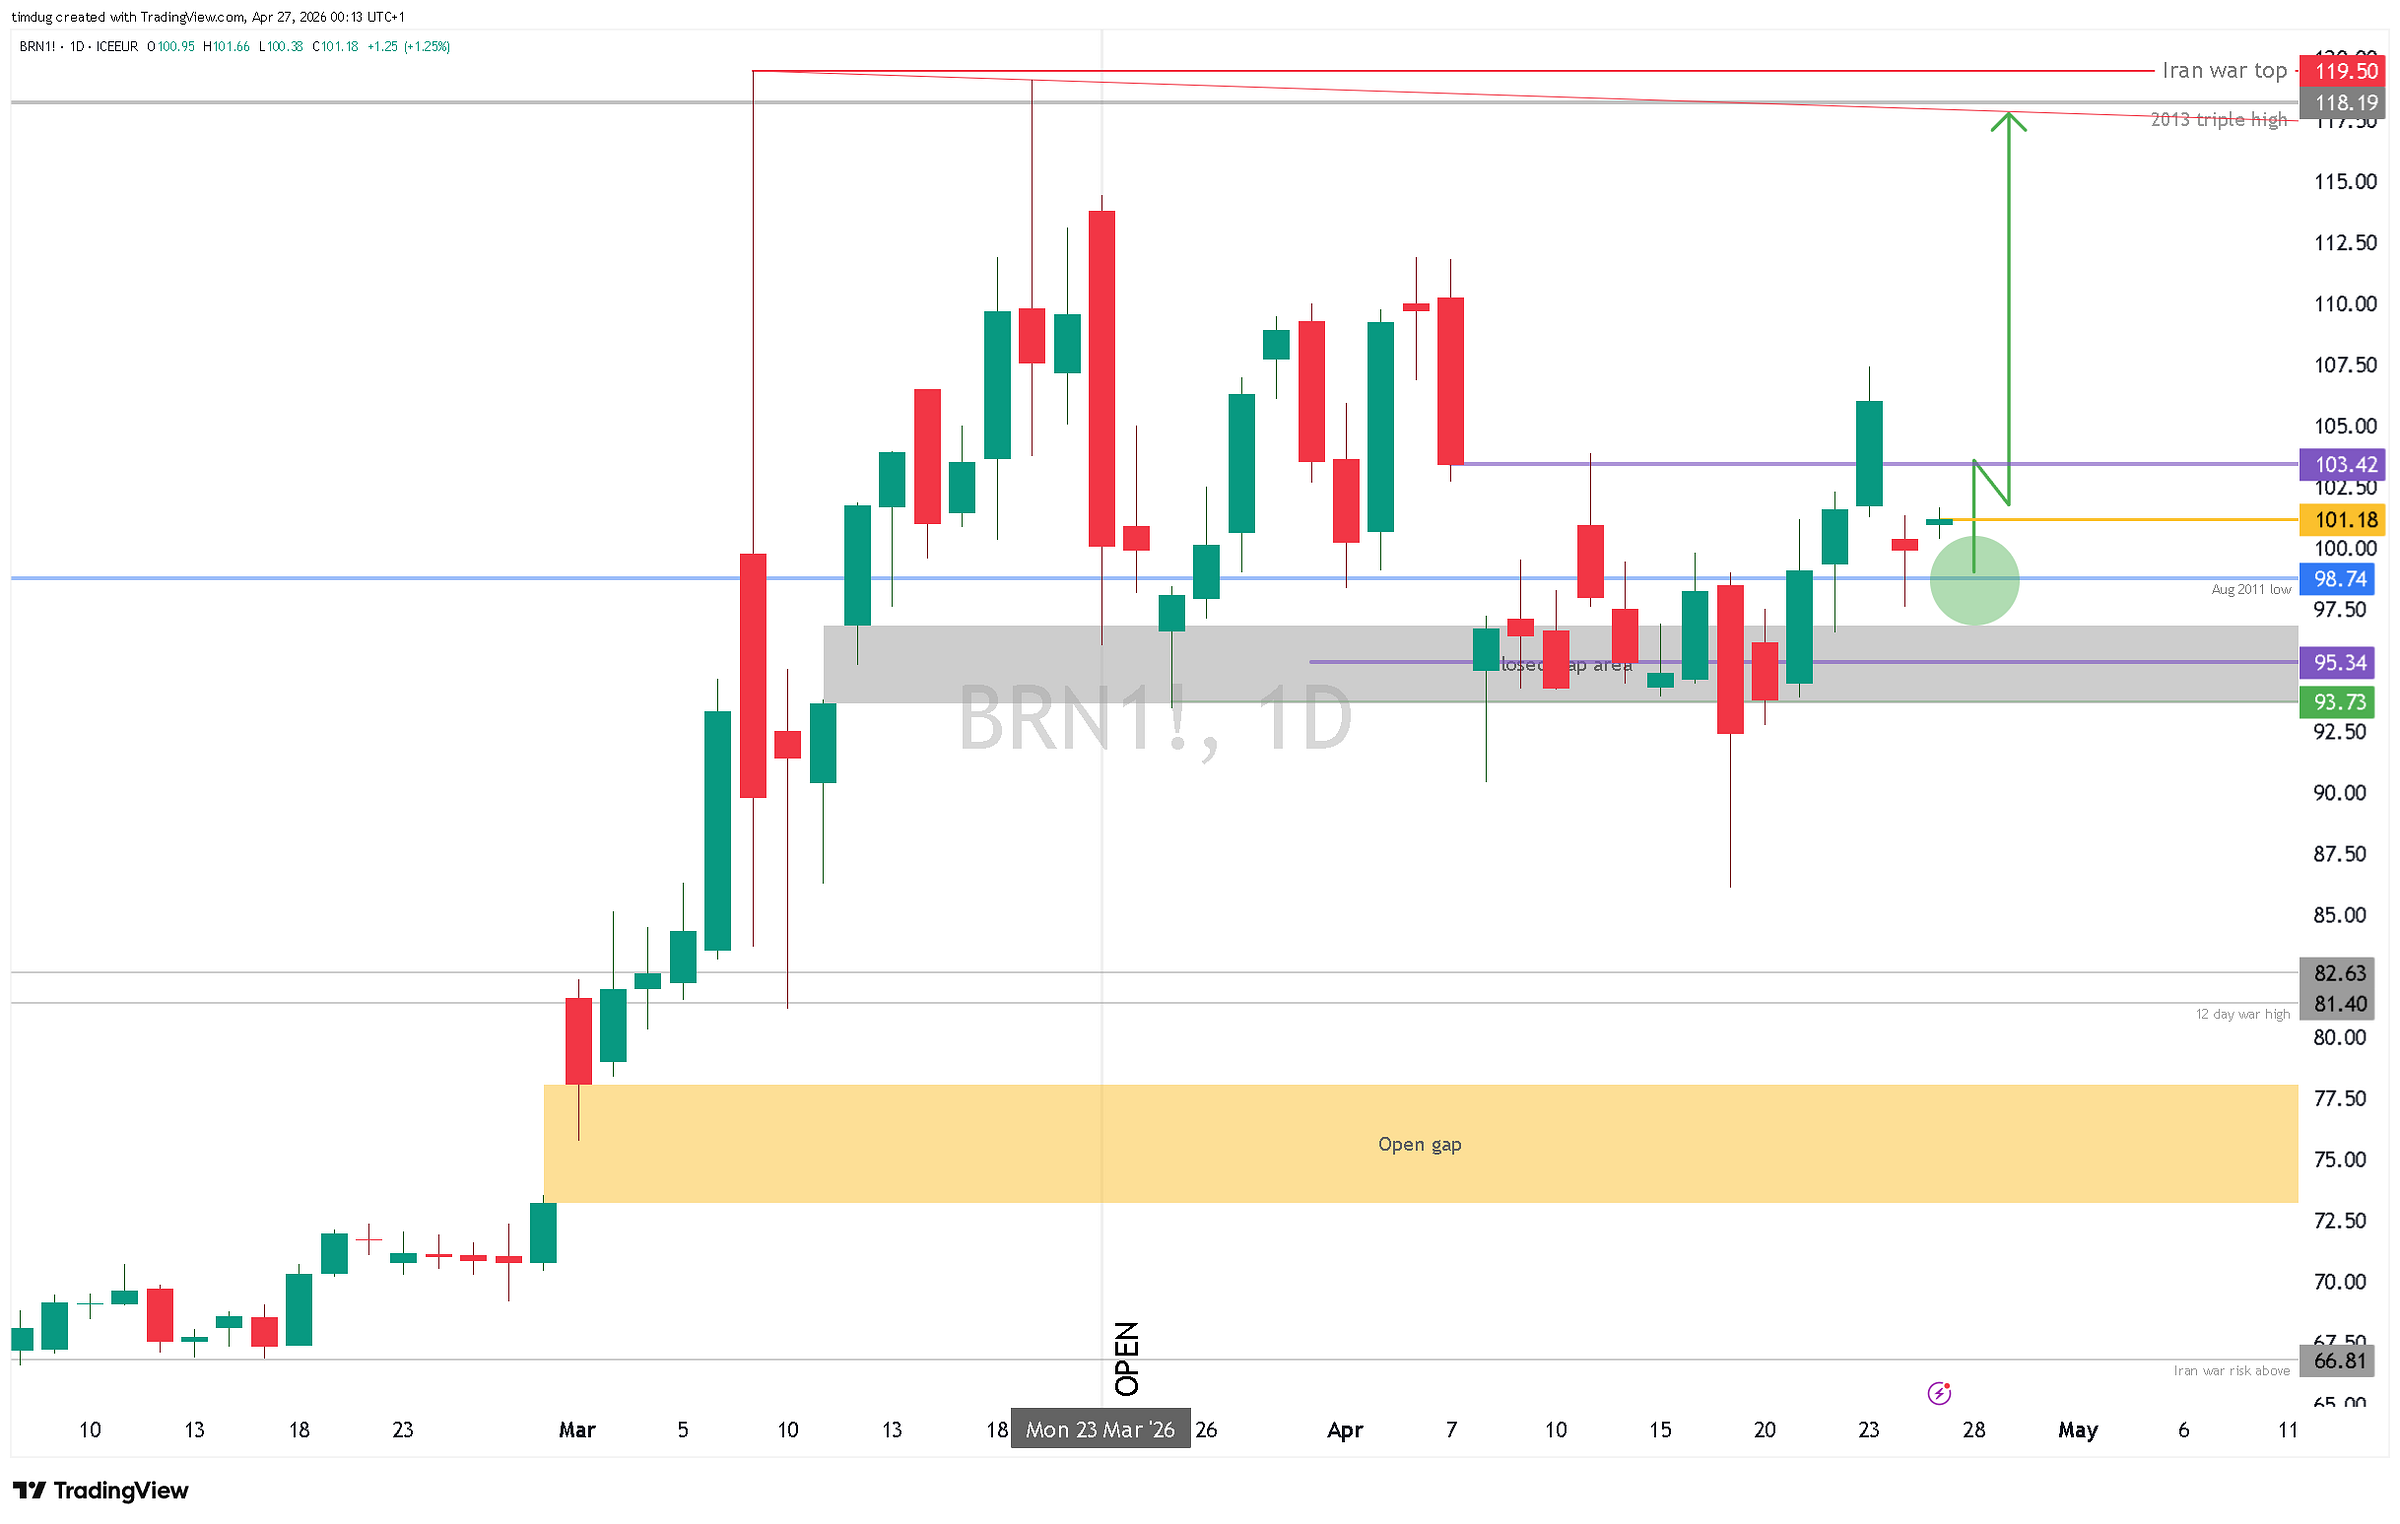
With that in mind, I only see the market being even more volatile and headline sensitive. This is where I leave trade guidance as a light touch. I would simply want to make people aware of the key levels the market is going to find the most liquidity at. These trade chart ALWAYS serve as a guide for me and what I would want to do should the market setup to those areas/ levels. It is not so much what exactly I see the market doing in the week ahead. There is a massive difference.
So with the mentioned headline volatility that we all see each day in oil, we have to prepare now for the headlines to be more and more motivated to being that this is all over with. So downside participation will increase.
Stay safe out there!