


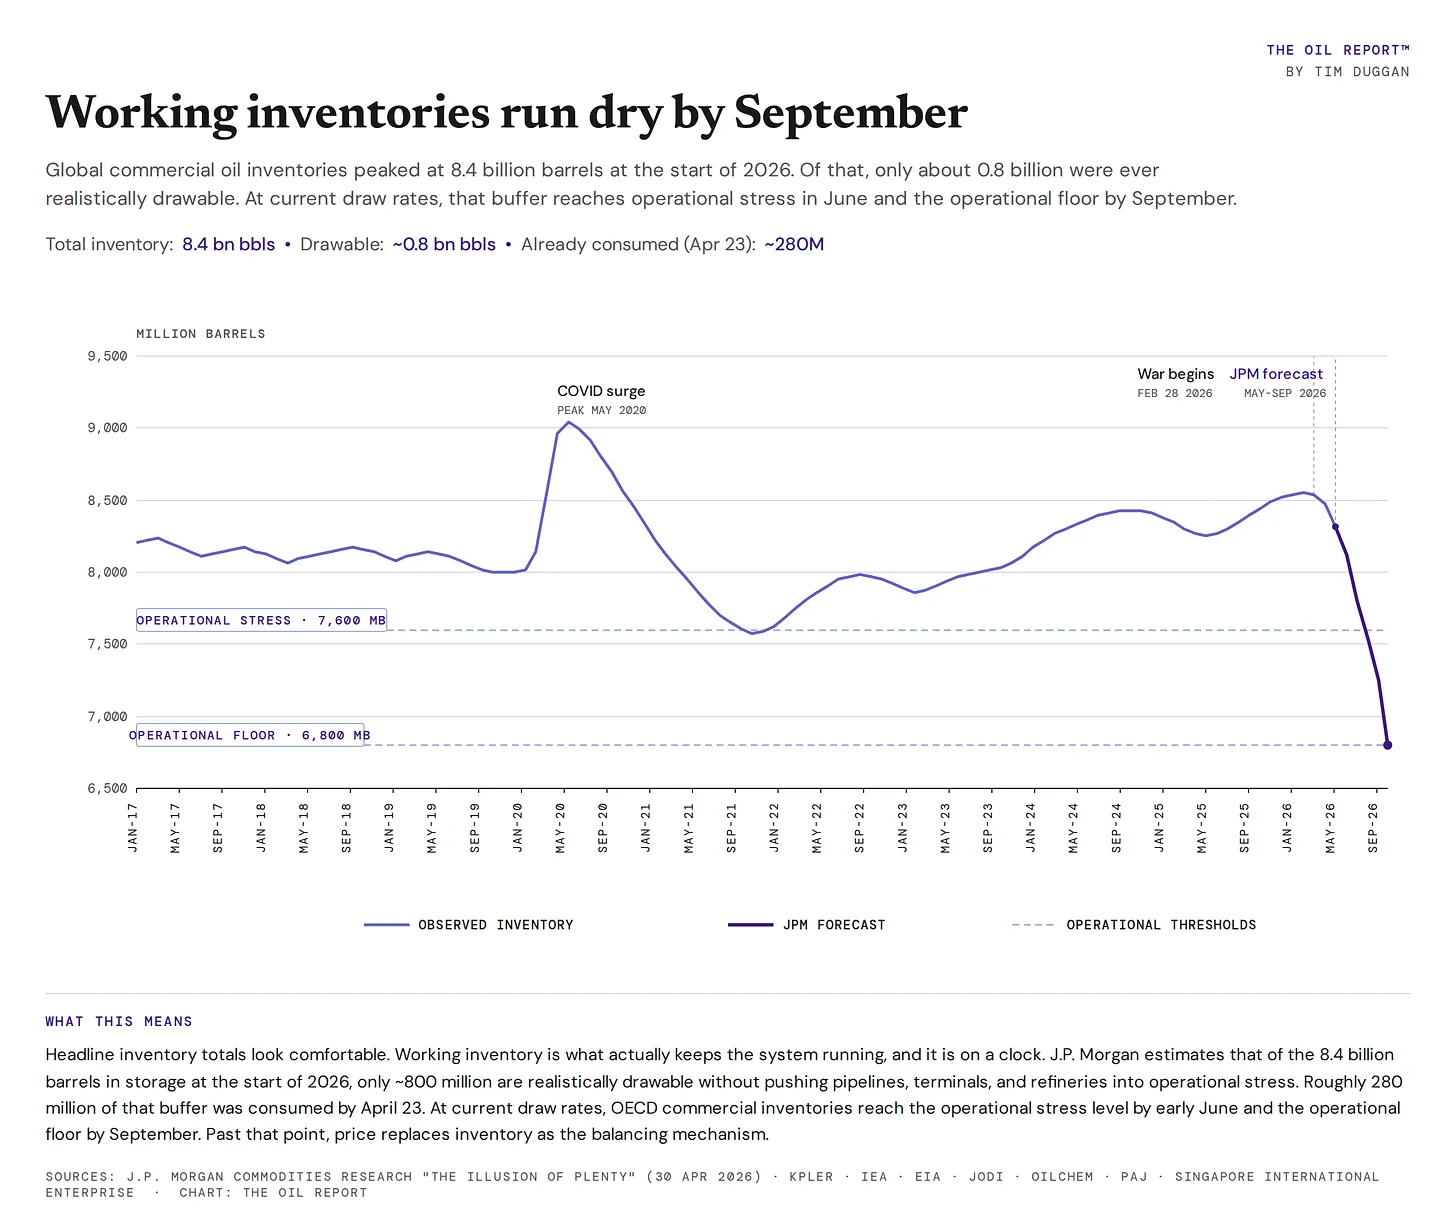
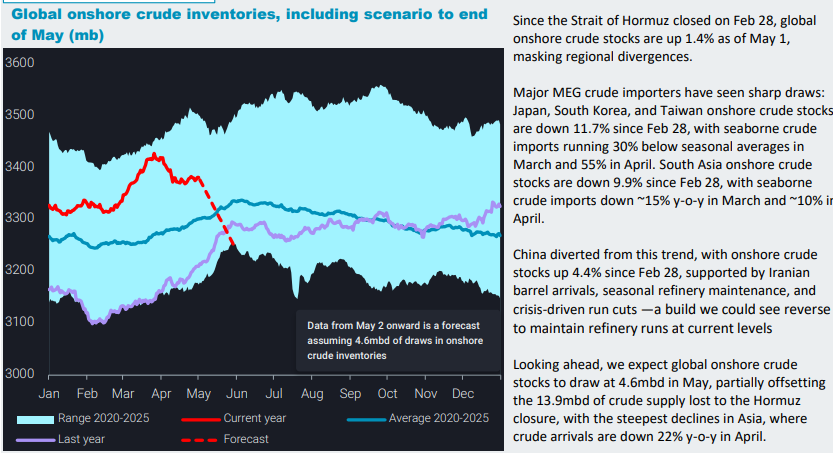
As I talked about in several previous reports to date, we have entered into an energy timeline that terminates in September. The cracks will become critical in roughly 4 weeks from today. This is elegantly drawn out by J.P. Morgans Natasha Kaneva in a private client letter last week titled ‘The illusion of plenty’. To summarize, the world holds 8.4 billion barrels of oil in storage. Only 0.8 billion of those are actually drawable, and at the current pace of withdrawal, OECD commercial stocks reach operational stress in June and the operational floor by September.
What is coming isn’t fully priced in. We have not seen the whites of the situation’s eyes yet. And we will in 4 weeks. We will see new higher highs on oil, be it on forties physical or on paper futures. Either way, this tepid, almost controlled market will not last- and yes, it is tepid. The world has grown accustomed to the less violent face of oil price action. We forget this market can do everything you think it can’t do.
As a business operator and family man, I want to be mindful of what I should be doing today, in order to react to the market in 4 to 8 weeks time. We need to be asking ourselves the question of what does my business look like at the end of June, what stress scenario can I take in September? What do I do in a 30% higher energy environment? If this was equity markets, I would be talking about a temporary ‘blip and dip’ scenario. This is not that. This is energy markets. This is diesel and petrol in your car, gas you cook with, bunker fuel that powers shipping tankers, fuel that powers your logistic chains. Where the stock market is not the economy. Energy access and price is the economy.
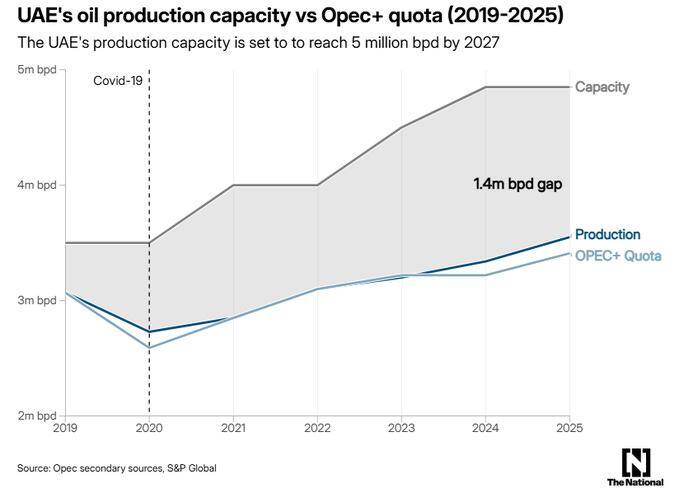
The UAE Is Out of OPEC
The UAE produced 3.42mbd in February 2026, 11.9% of OPEC’s 28.63mbd total. Lying third being Saudi #1 10mbd and Iraq 4mbd. In short, they left as they were constrained by production quotas that had haunted the relationship going back to the post COVID-19 landscape. They have ambitions to produce up to 5mbd from current 3.4mbd. Remaining in the group would constrain those growth targets and thus their GDP. For your information, Kuwait just went to zero oil exports for the first time ever.
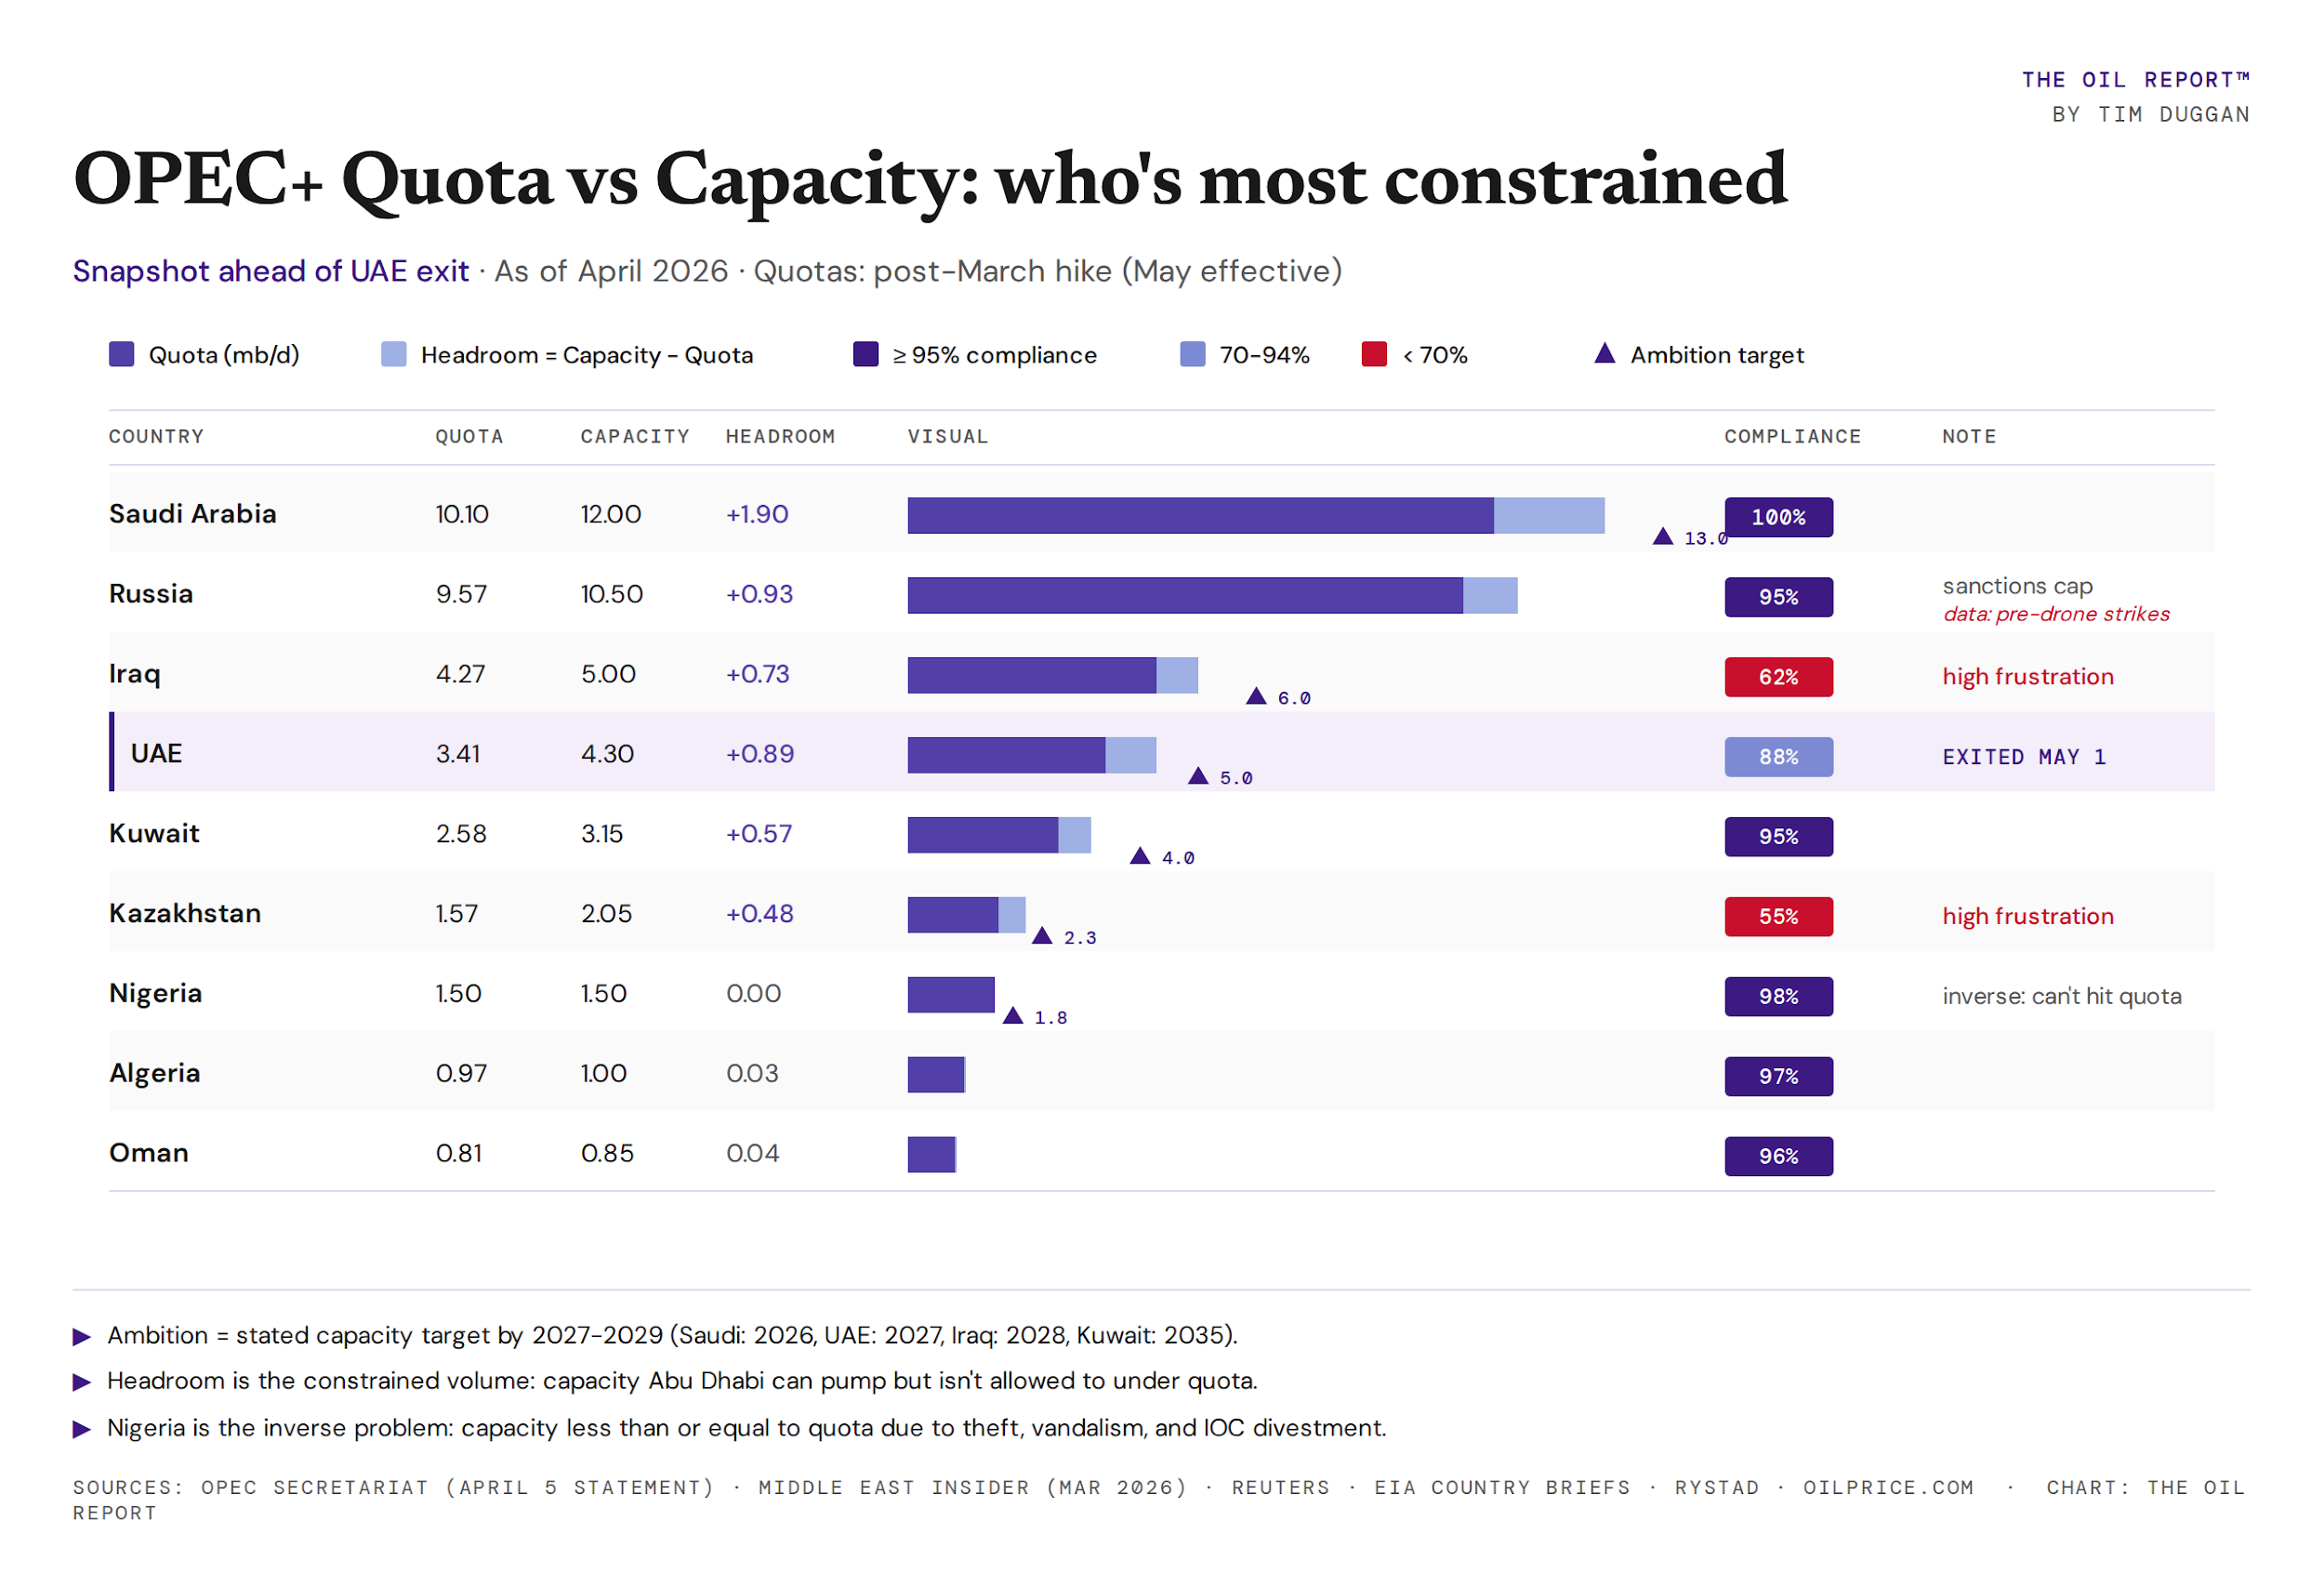
Until they left, they had only made 88% compliance, quietly producing about 190 kb/d above quota. The list of the bad boys of OPEC+ is Kazakhstan 430 kb/d above, Iraq 130 kb/d above, Russia 150-450 kb/d above.
There is a lot of further talk of more dissent, with little evidence. The chatter is entirely based on the fractious nature of this Iran crisis. One member country (Iran) attacking another member country is bound to lead to a bust up at the annual Christmas dinner. But with Iran remaining in the group producing 3.4mbd others may also look to leave. See table below. This is only the list of OPEC+ countries that are constrained by the quotas’ mechanism agreement. OPEC & OPEC+ totals 22 countries in all.
Brent Oil Price Forecast
Every new Brent Oil analysis as it publishes, today's technical signal and key levels, live price — on one page.
See all Brent Oil forecastsEuropean Gas Is Feeling the Shock
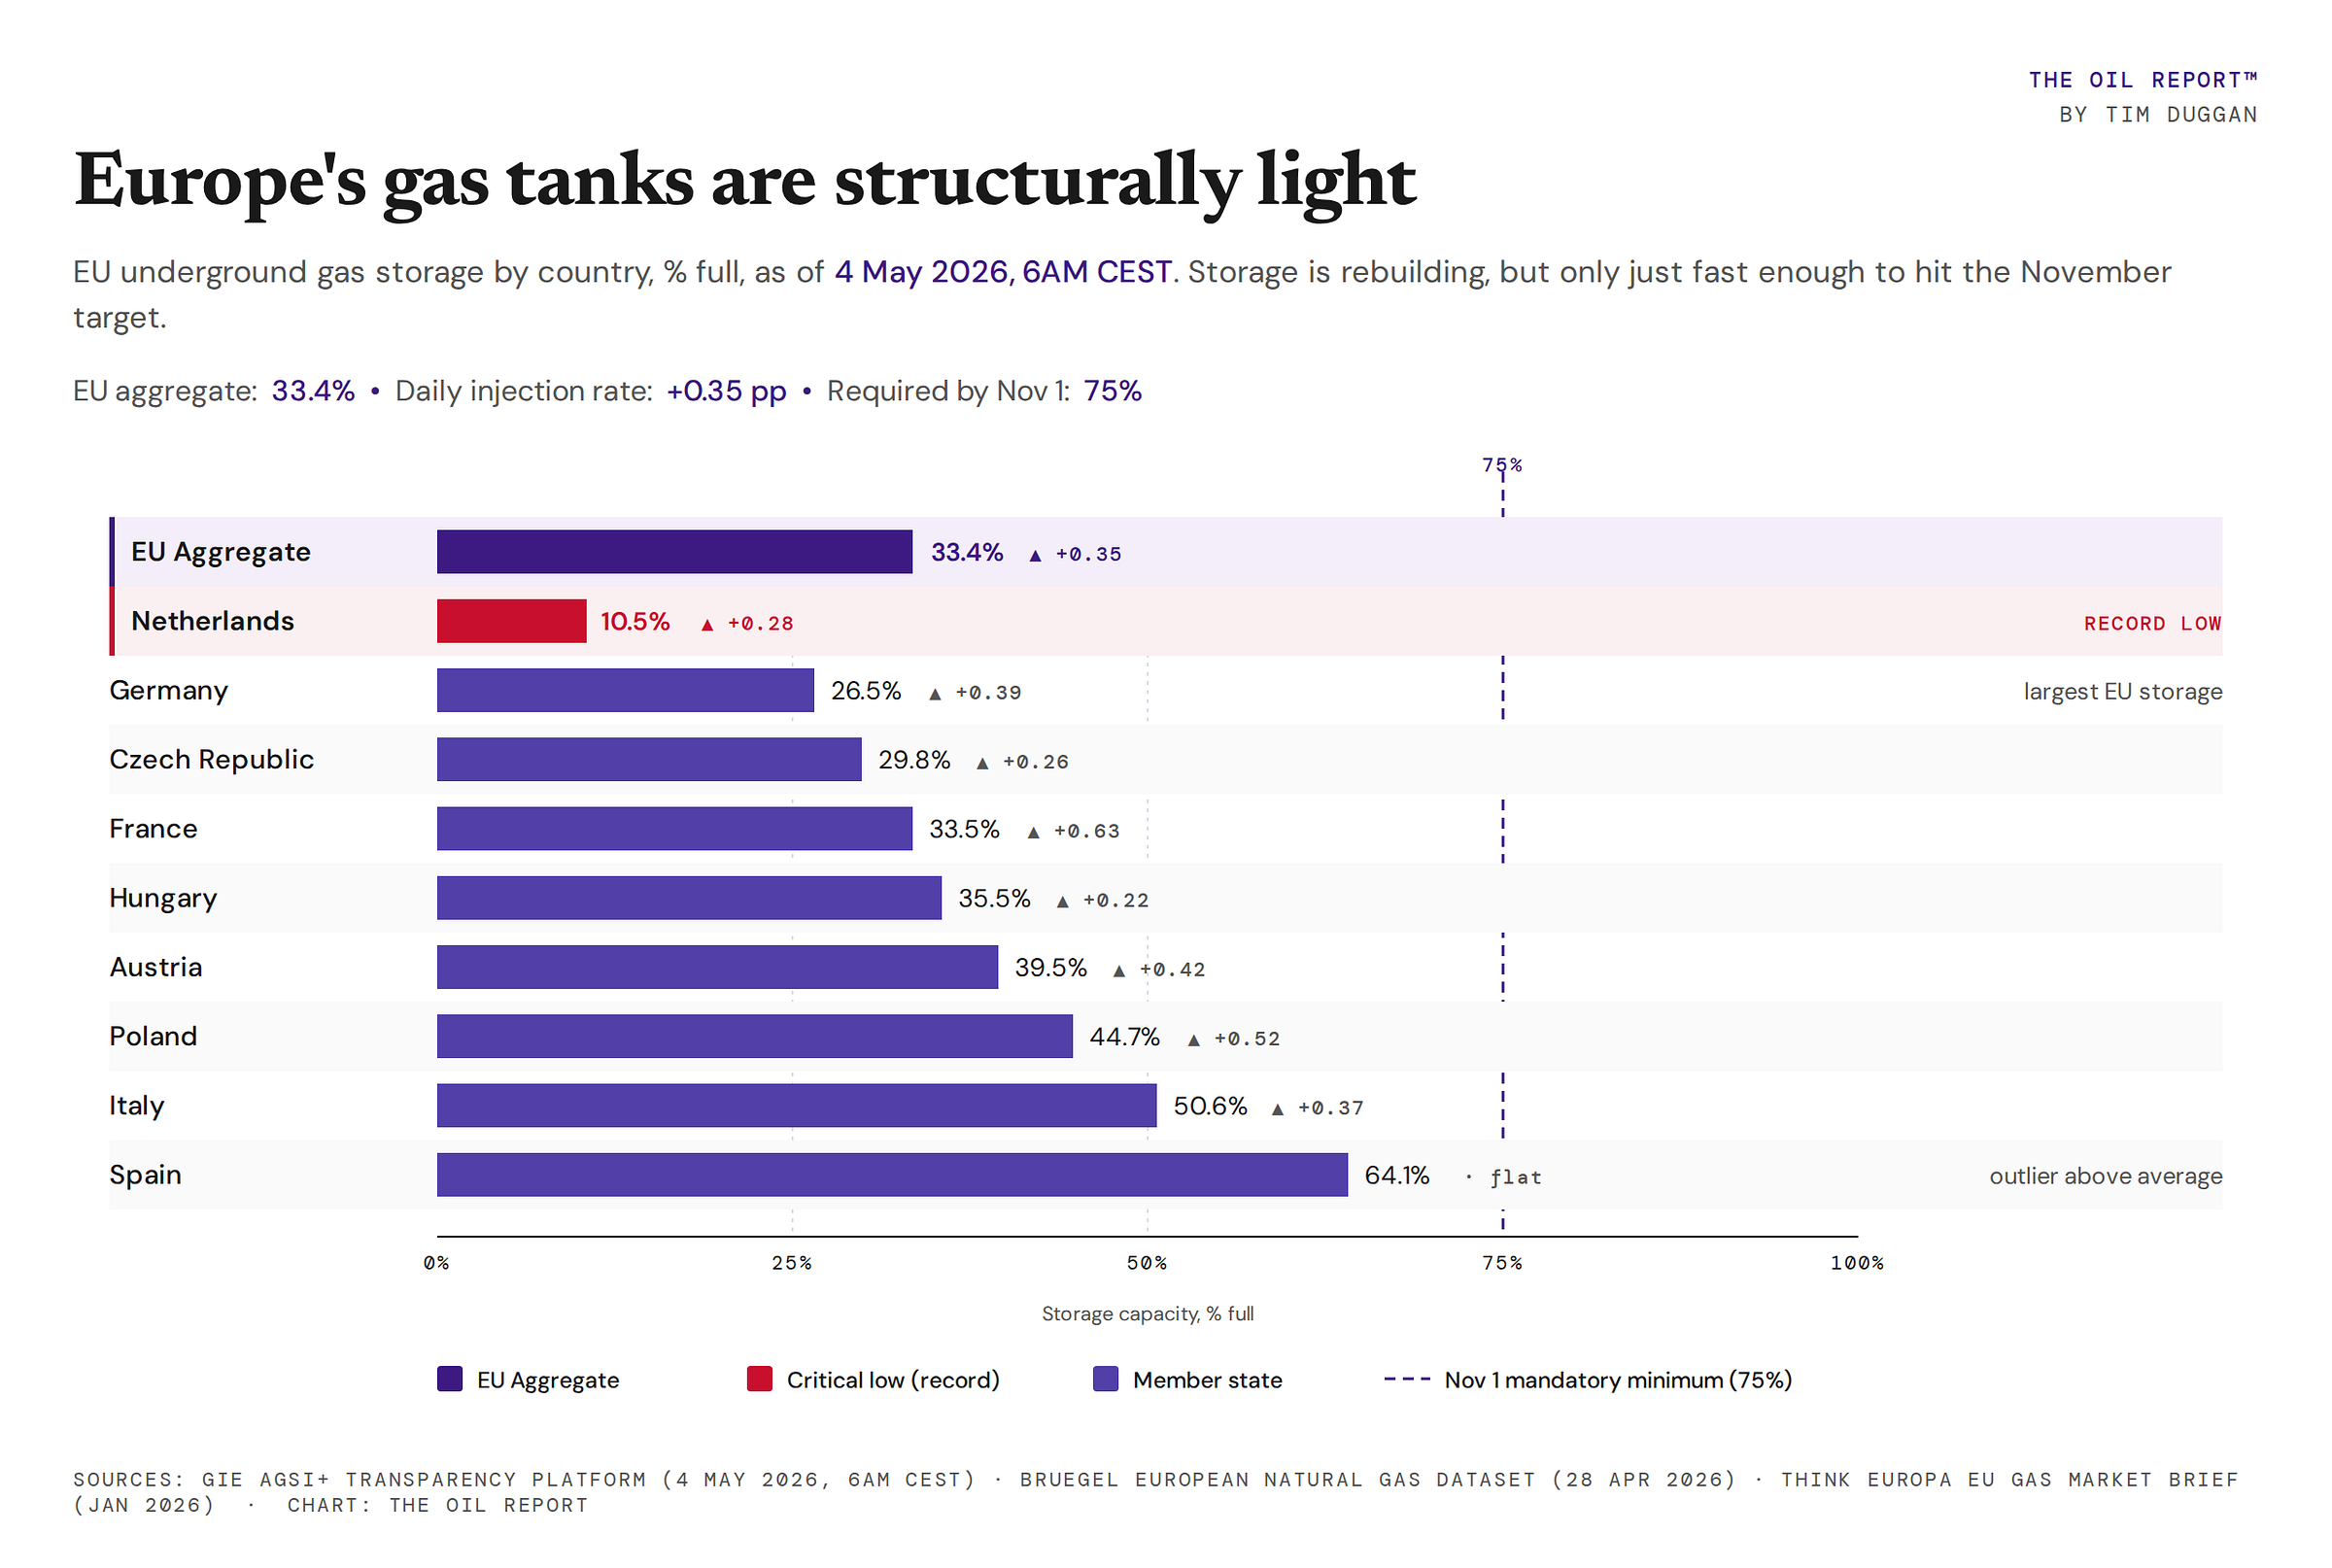
The EU is sitting at 33.4% on May 4. To reach the 75% mandatory minimum by November 1, member states need to inject at +0.23 percentage points per day for the next six months. Current daily rate: +0.35. The math works, and only because Brussels lowered the binding minimum from 90% to 75% in September 2025.
Netherlands at 10.5% is the structural alarm, sitting at the lowest stored level on record for the start of the injection season. Spain at 64% is the outlier, propped up by Algerian pipeline gas that does not flow through Hormuz. Every other major economy is more than 15 percentage points below where it would normally sit at this point in the year.
There is no margin if anything goes wrong: a hot Asian summer pulling LNG cargoes east, an early winter, or any further disruption to Qatari flows.
Everyone’s Got a Plan
Iran put forward a 13point plan with 3 phases. Tehran’s new proposal came in response to a Washington-backed nine-point peace proposal, which primarily sought a two-month ceasefire. However, in its latest peace proposal, Iran said it wants to focus on ending the war instead of extending the truce and wants all issues resolved within 30 days. This is good material talk from Iran. There is hope! As I mentioned before, this war ends when Iran decide, not The US.
The new proposal calls for:
- guarantees against future attacks
- a withdrawal of US forces from around Iran,
- the release of frozen Iranian assets worth billions of dollars and the lifting of sanctions,
- war reparations,
- ending all hostilities, including in Lebanon, and
- “a new mechanism for the Strait of Hormuz”
Iran is now materially coming to the table. It would be presumed that we are then within a 14 day sight of potential agreements; however, we have been here several times in US/Iran negotiations. The difference here is that Israel may be sidelined and forced into de-escalation. To date, they have not adhered to US orders to step down. Adding to the entire picture is the reported ill health of Netanyahu. Add to this, Bessant’s comments that the US blockade may last ‘‘months if needed.’’
There will be a lot of noise about Iran’s railway route to China. This really is a non factor. The pre-war capacity was 1.8mbd, however the railway is damaged and overland capacity for Iran is a small 250k-300 kb/d.
The Net Net
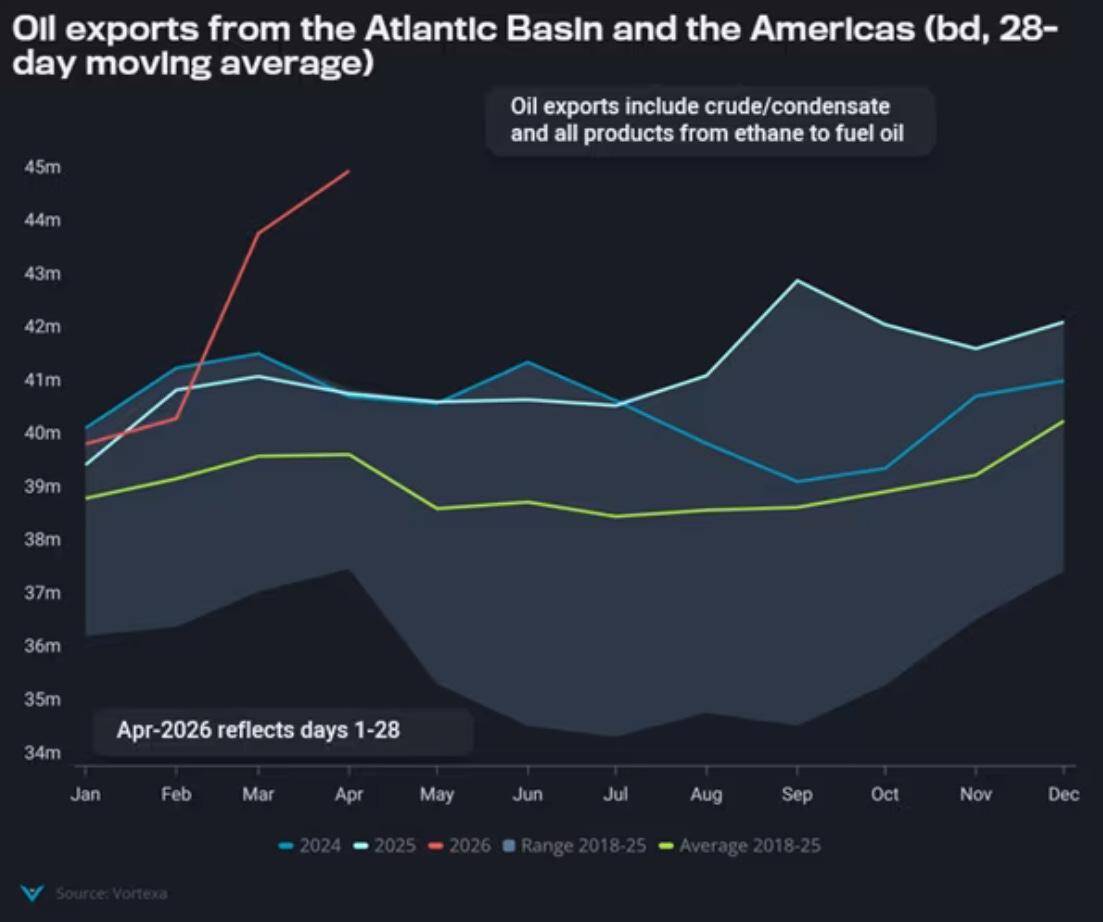
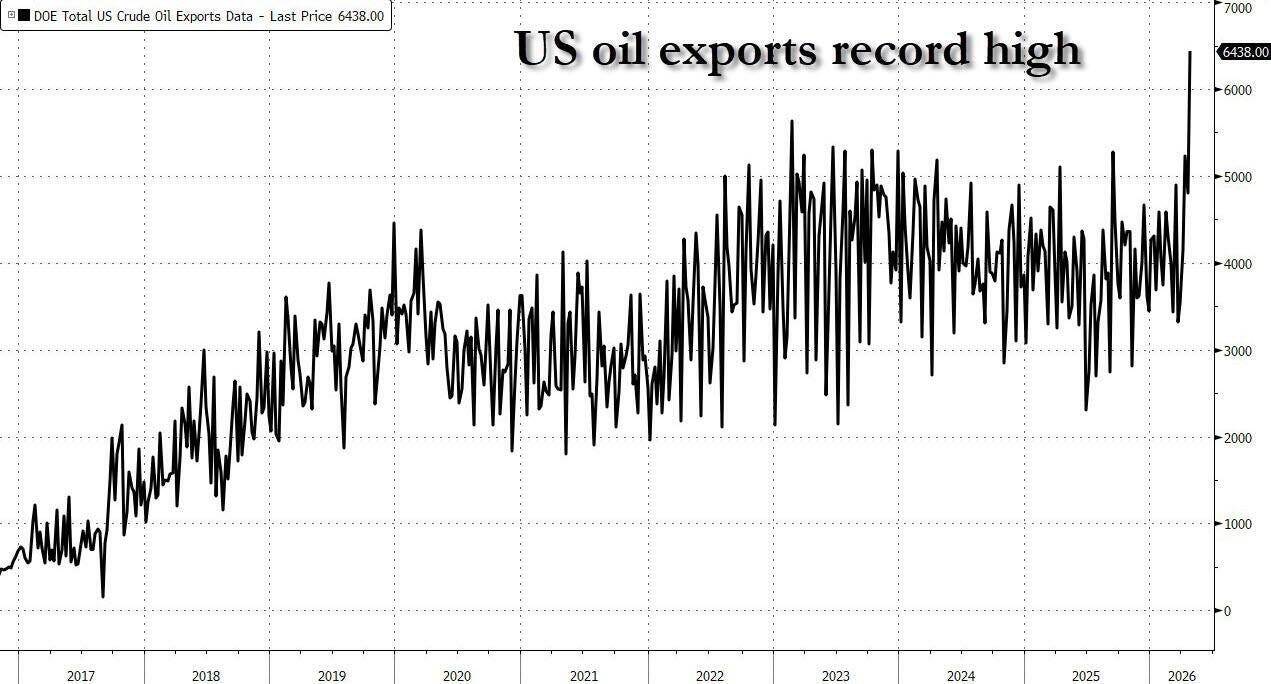
Stop asking when oil tops out. Start asking what your business looks like with diesel up 30% by mid-July. Buyers will buy every dip until the September floor or a signed ceasefire arrives, and both Iran and the US have shown they can talk for months while shipping nothing. The US is filling the supply hole it helped create through record exports, but at 570 rigs versus 621 last year (Baker Hughes), the rest of the supply chain is structurally smaller. American producers are not repeating the 2014 capex mistake (see Cap ex baby, Cap ex’. Dec 2024). The trade is long. The business question is operational.
Commitment Of Traders Report
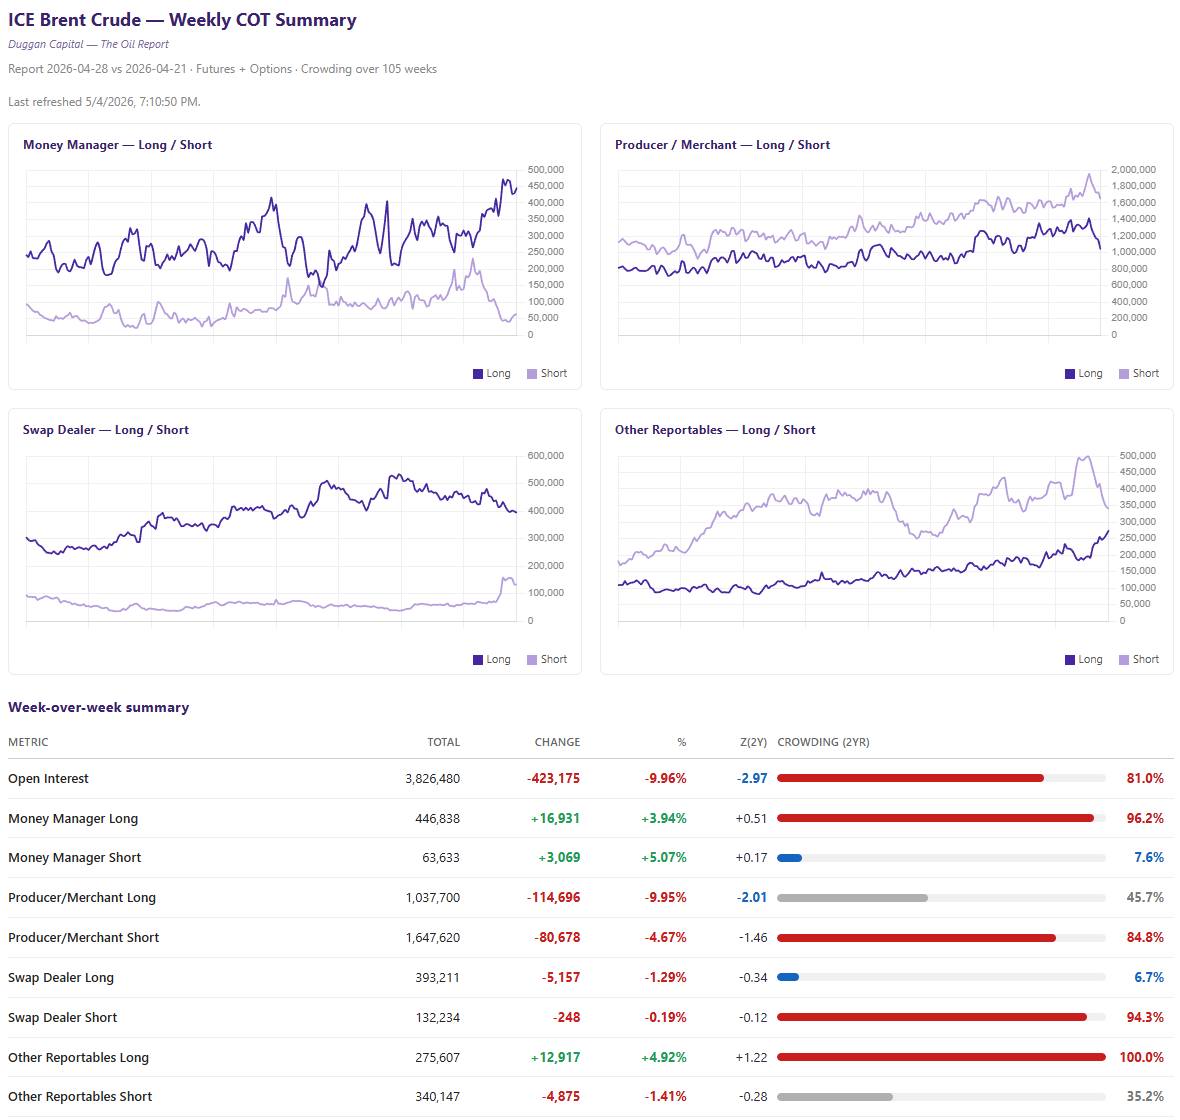
Speculators are crowded long and hedgers are crowded short. Historically, an alert filter to be mindful of a price, unwind. Given the unique scenario, I don’t see this happening. Any pullbacks on more empty potential ceasefire rhetoric will be rebought from key ‘cheaper’ levels. But increasingly, paper futures are grossly dislocated from physical real trade. The casino is jammed!
Hedge funds are 7:1 long (430k long vs. 61k short), with their long positioning at the 96th percentile of the past two years and shorts at the 6th. They’ve effectively given up on lower prices. Meanwhile, producers and merchants are aggressively hedged at near-record levels – producer shorts at the 94th percentile on both 2-year and all-time horizons, the people who actually pump the oil racing to lock in today’s prices for forward production.
The swap dealers sitting between them are warehousing all that producer hedging flow-their biggest short book in 13 years (95th percentile 2yr) and a net crowding score of 85th percentile, among the deepest hedger-tilts on record. The last two times we saw this configuration – late 2018 and early 2020 – Brent fell sharply within two months.
The constructive flicker this week: swap dealers covered 21k shorts (−14% WoW) a possible early sign the hedging surge is plateauing. One week isn’t a trend, but it’s the first cooling signal in six weeks. This has to be painful for someone. I suspect its the swappies trying to white-knuckle their books. Nothing, they are strangers to!
One new wrinkle worth flagging: Other Reportable – mid-size institutional traders hit a fresh 2-year peak at 275k longs, a quietly accumulating category that’s now at the 100th percentile. Likely family offices and discretionary funds adding length on the same thesis as the hedge funds.
Bottom line for next Friday -two numbers to watch:
- Swap dealer shorts under 120k = the producer hedging wave is plateauing
- Hedge fund longs above 425k = speculative conviction is holding
If both hold, the crowded setup unwinds without much drama and price stays firm. If either fails-hedge fund longs slip OR swap shorts re-expand – we likely see distribution and price weakness. Positioning typically moves before price, so these two numbers tell you the direction before the chart confirms it. Again, this is a dip that will be bought to new all-time highs.
What’s the Next Move?
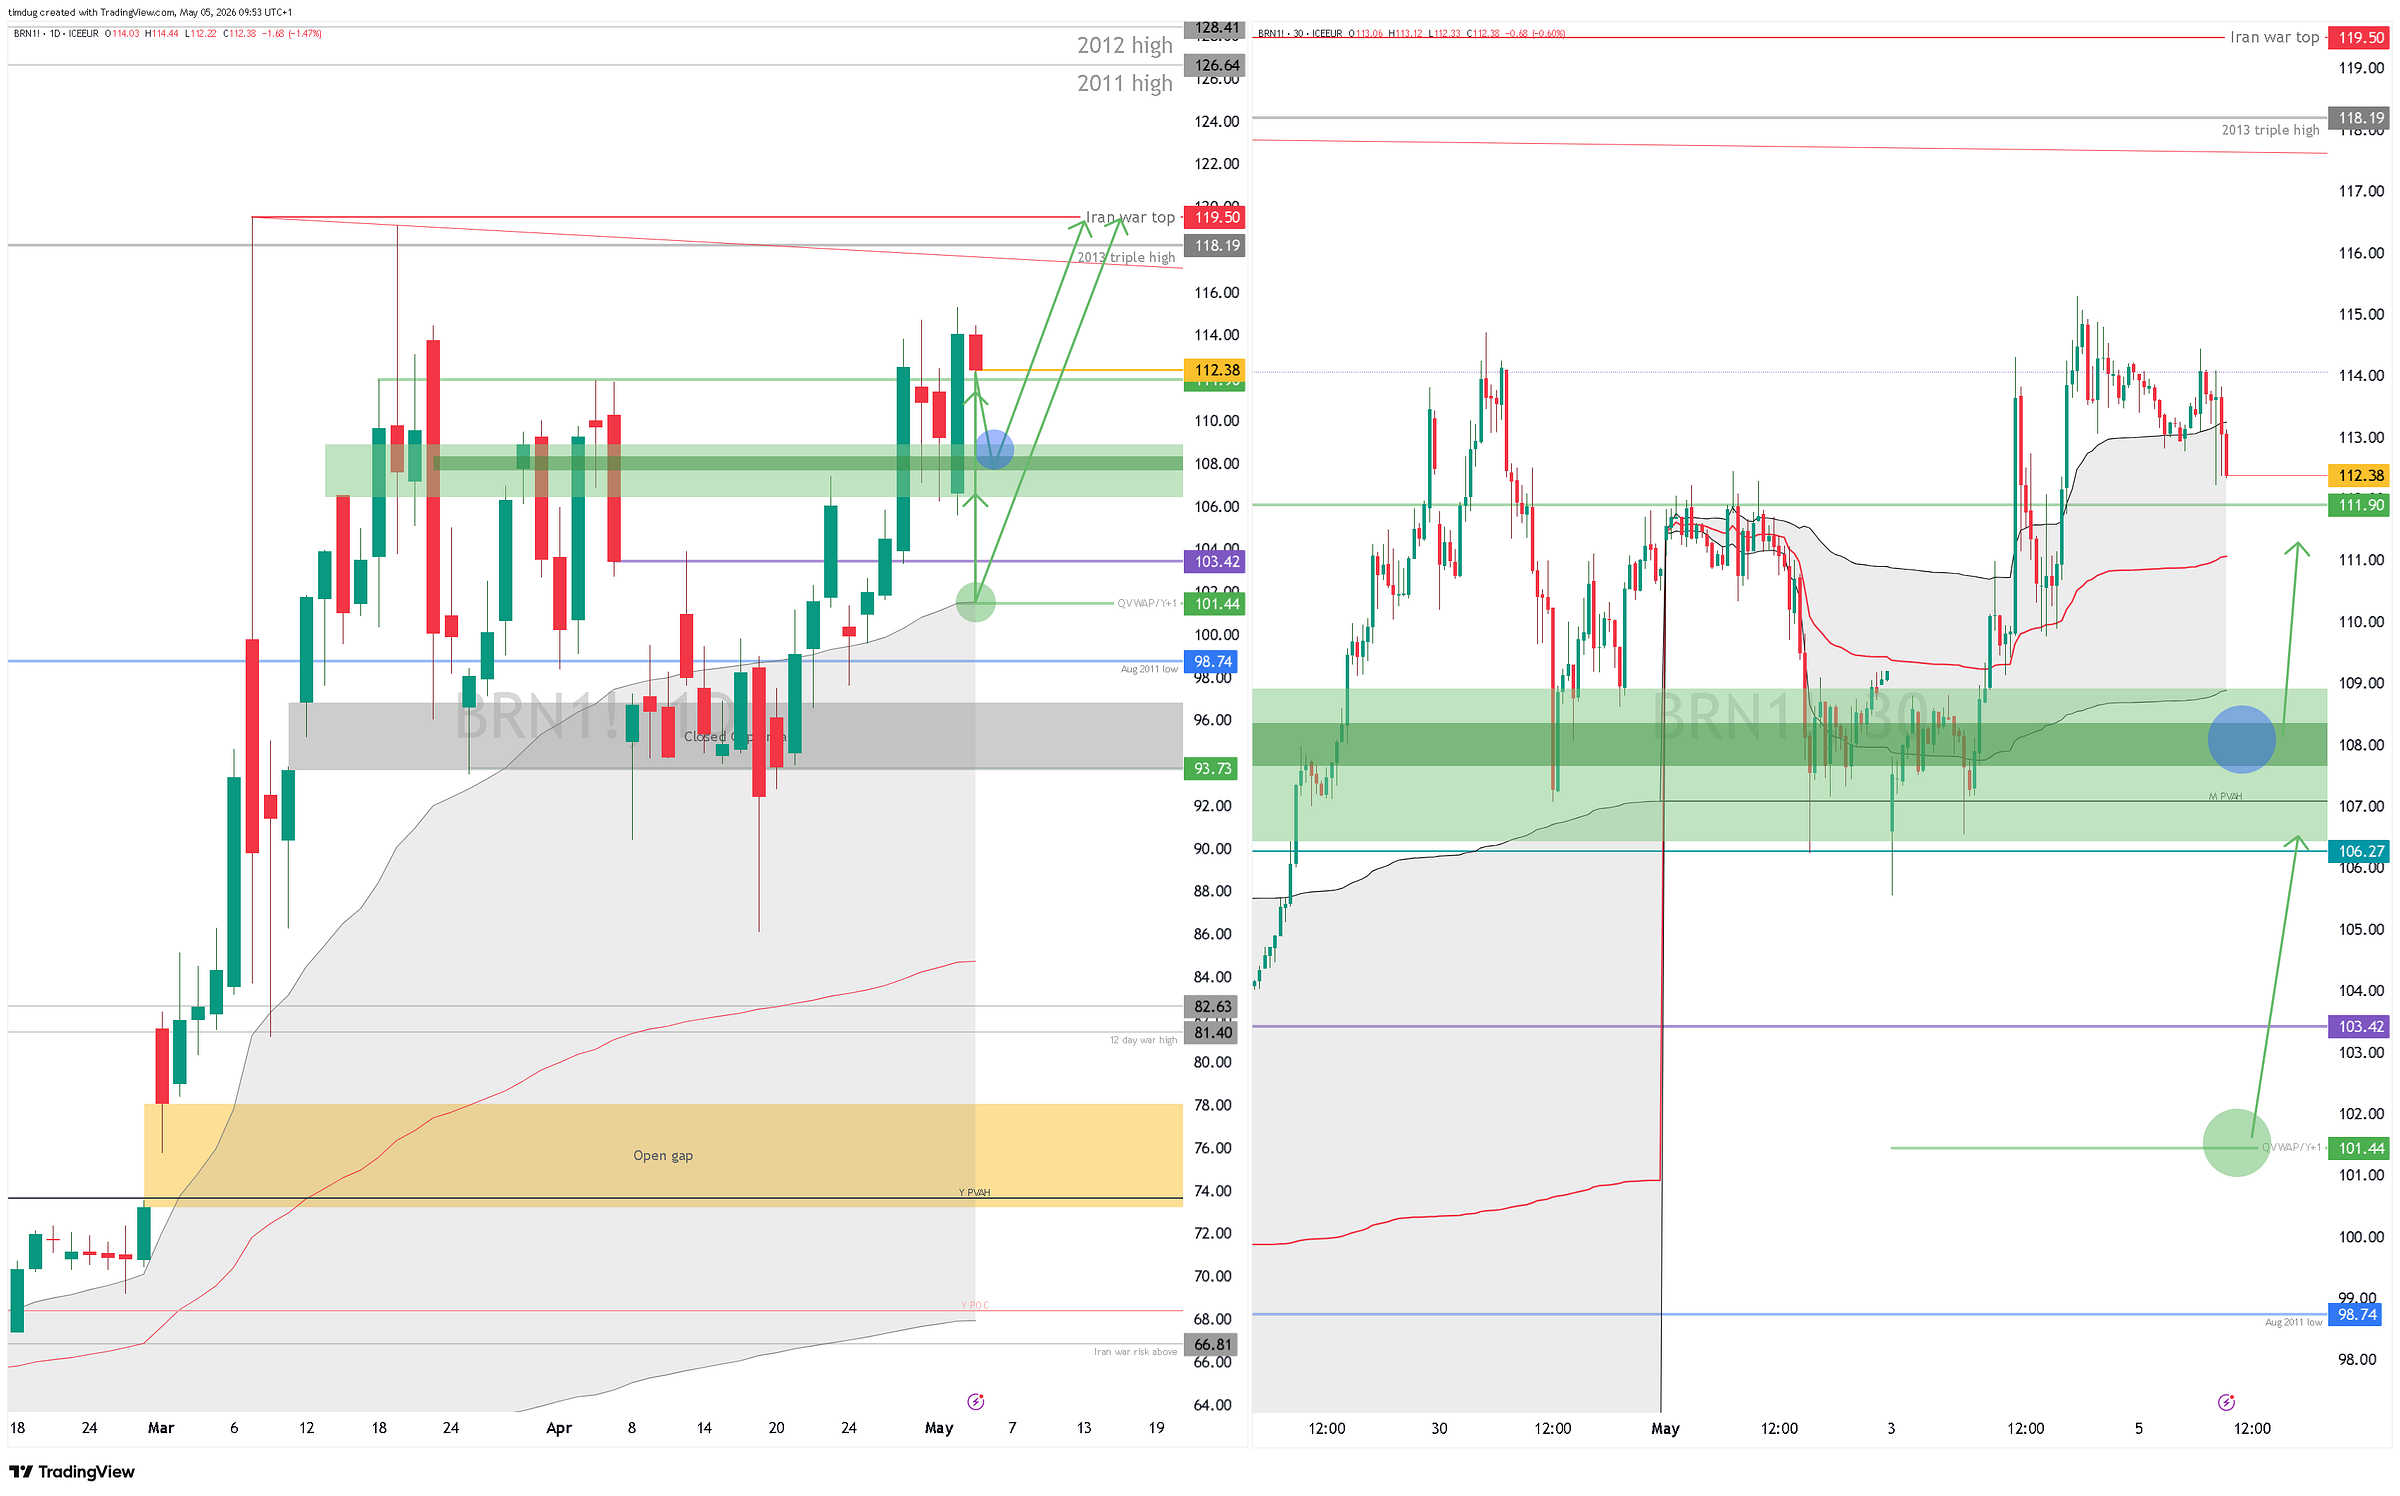
The general tone of the market is now fully accepting that we are higher for longer on oil. The only thing that can change this is a material peace deal agreement that Iran and The US both agree on that last for more than 24hrs. Several attempts at such an agreement have not lasted.
Remaining on the long side, we aim to buy as cheap as possible. I outline the areas that I think merit such cheap longs while the status quo holds. I firmly believe that once we reload buyers at these levels we will take out the existing highs at $119 Brent to then move to the 2011 high $126.64 and the 2012 high $128.41.
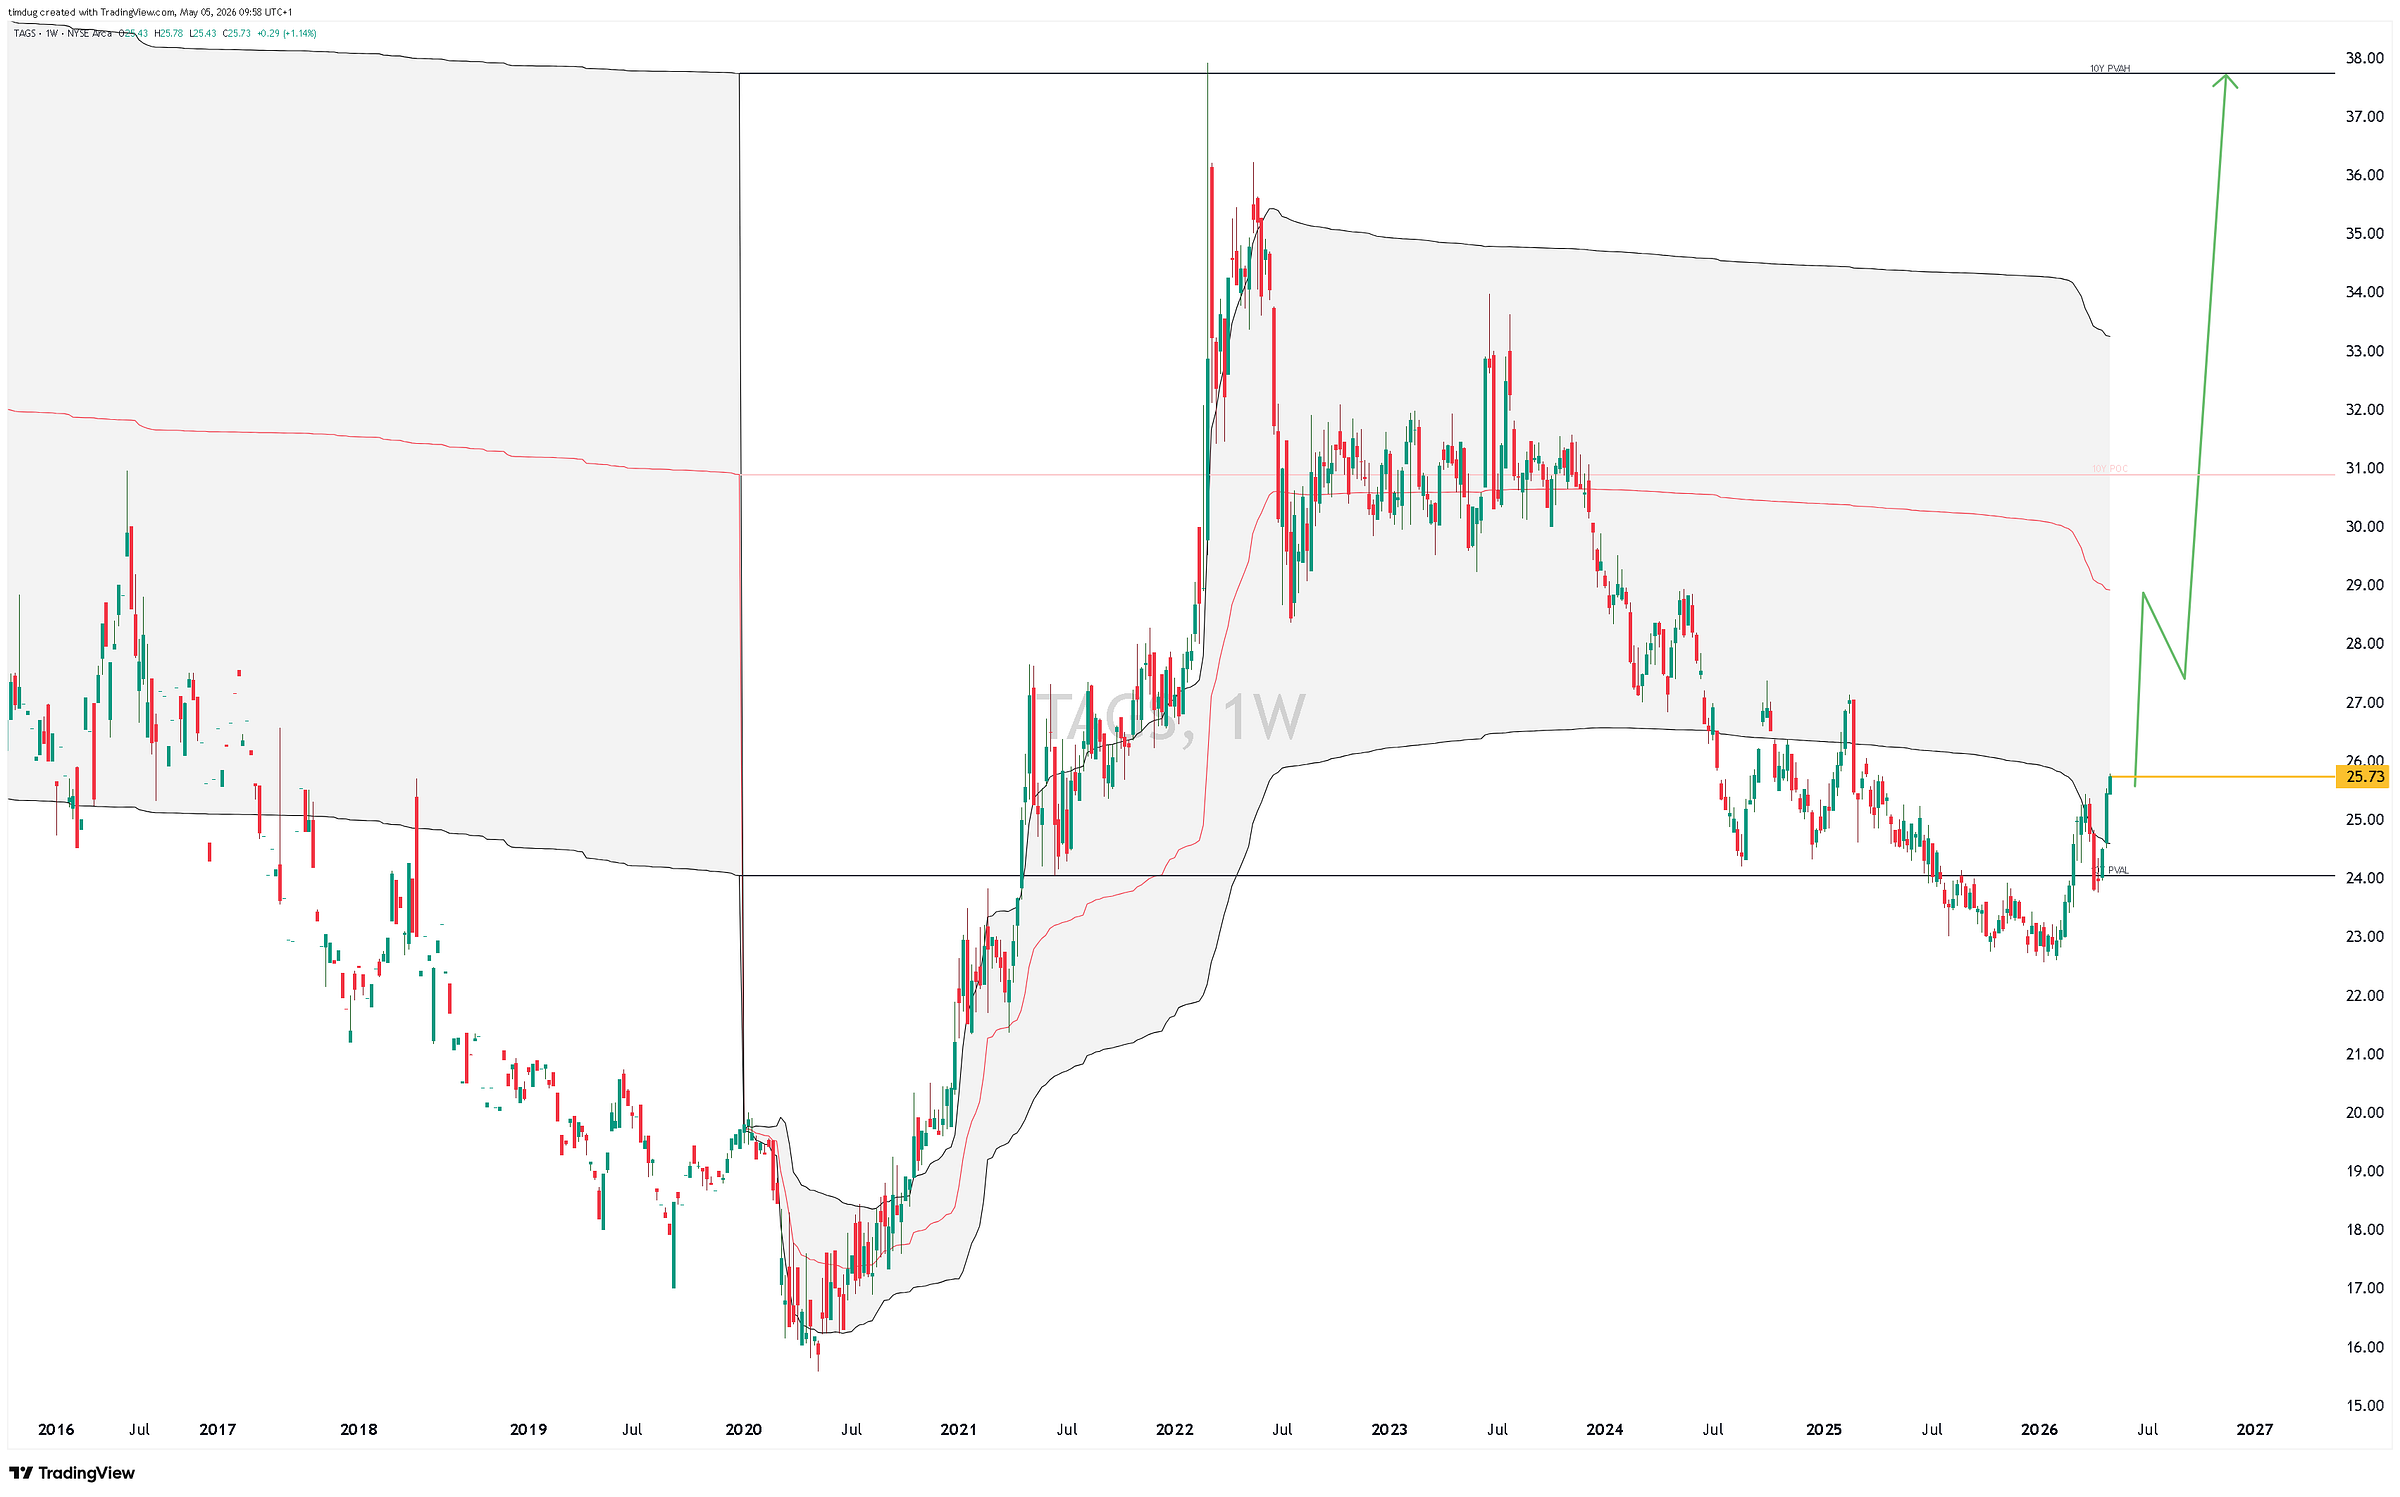
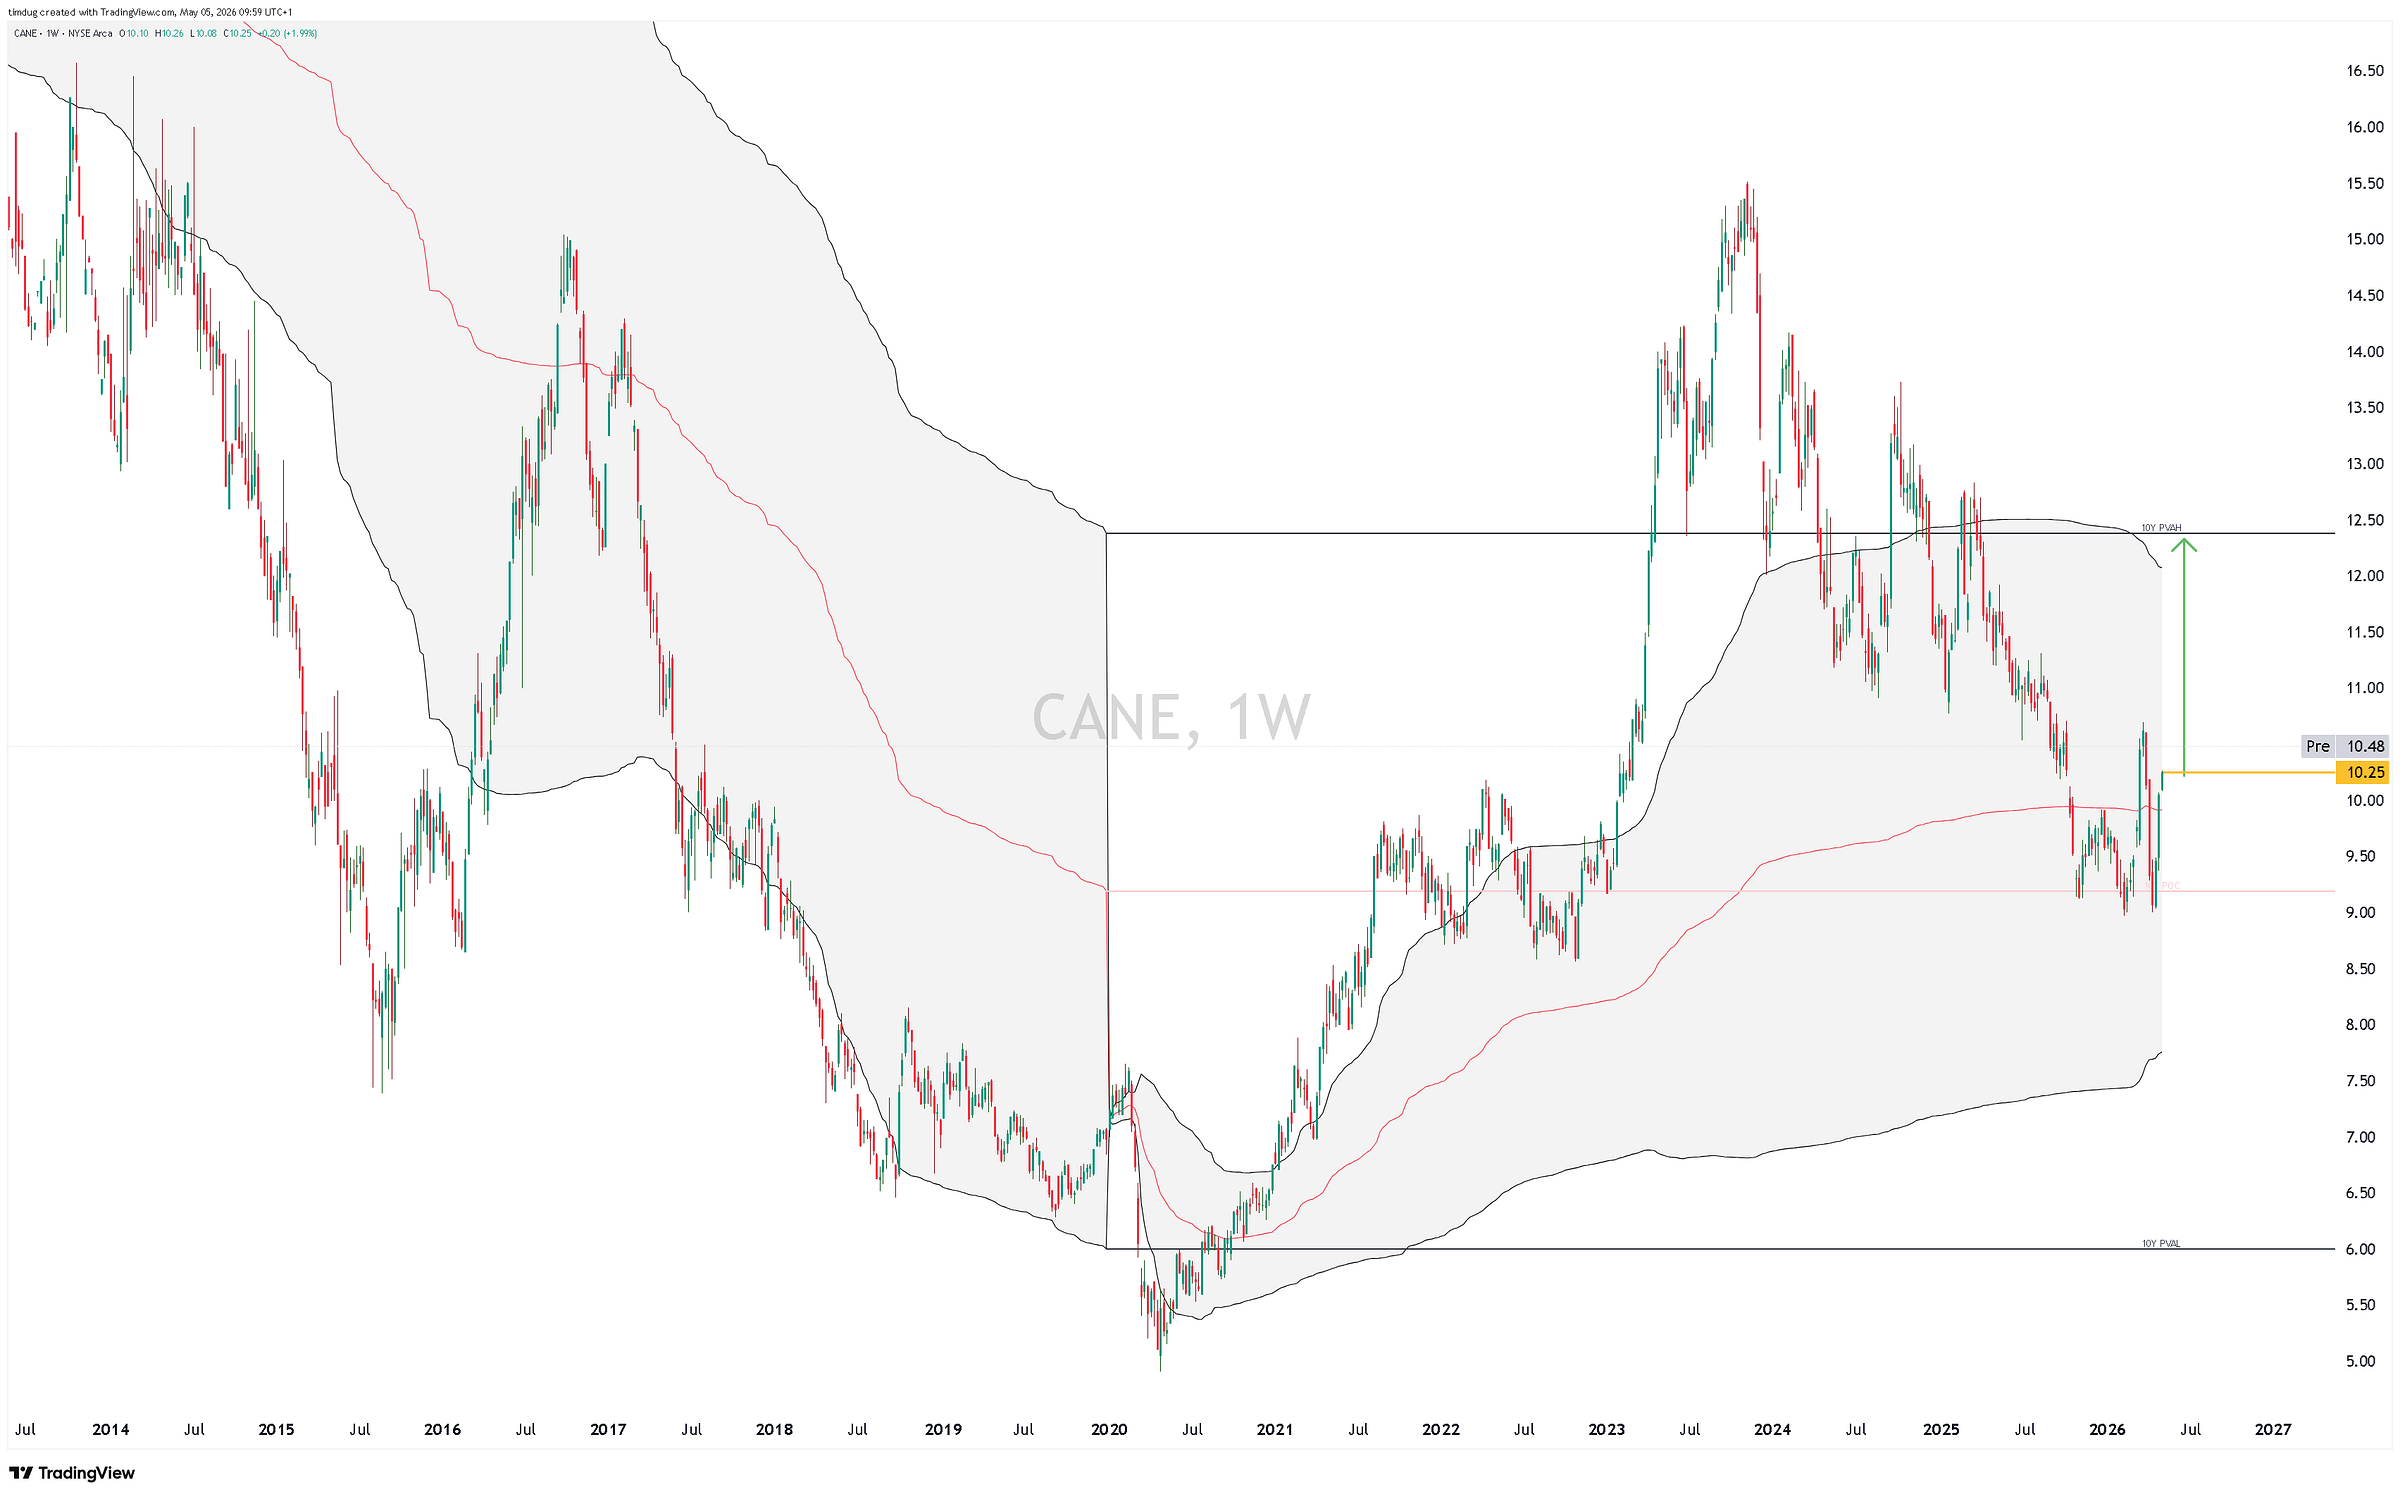
As a bonus to the trade section, here are two side impact markets that I’m looking at and have an active position in. TAGS 1.06%↑ and CANE 3.76%↑ . I have been in these positions since the war started. Looking for a lot more out of these.
Stay safe out there folks!