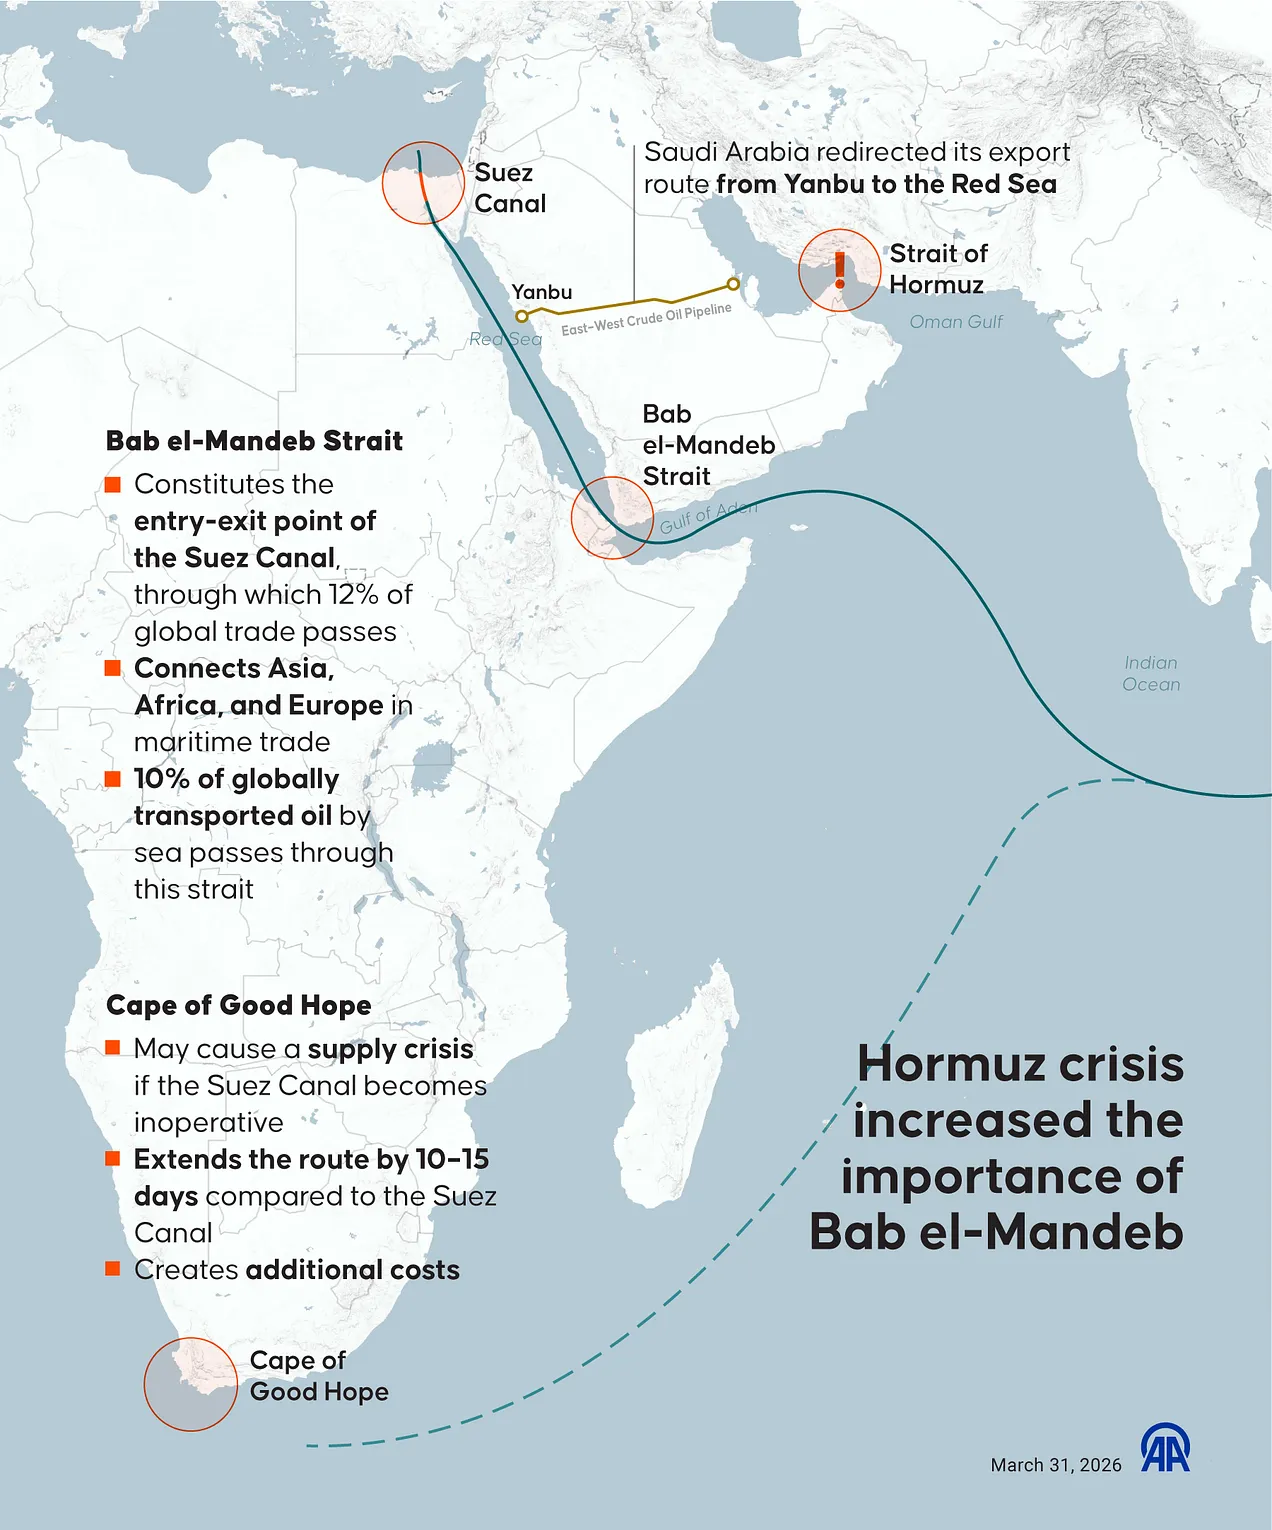
I’m normally not interested in rehashing the enormous news flow on the week gone, unless there is significant price impact. This week was that exception. We started off the week with failing talks in Islamabad, where Vance took the lead with Iran. Indirect talks (both parties in separate rooms) really only found they are at a Structural deadlock on their sets of goals. Trump deployed a US blockade of the blockade on the outside of The Straits to stop all traffic completely. This served a purpose to spread the pain to China and India, who were still receiving Hormuz exports. The Iranians instantly countered with ‘The Yemini’ option. That the Houthis would subsequently attack ships entering the Bab el-Mandeb straits, destined for loading at Yanbu port. This directly puts another 5mbpd of supply at risk. Currently, it is still rumoured that the Houthis are attacking in this area, not a fact. There is no scheduled or agreed second round of talks.
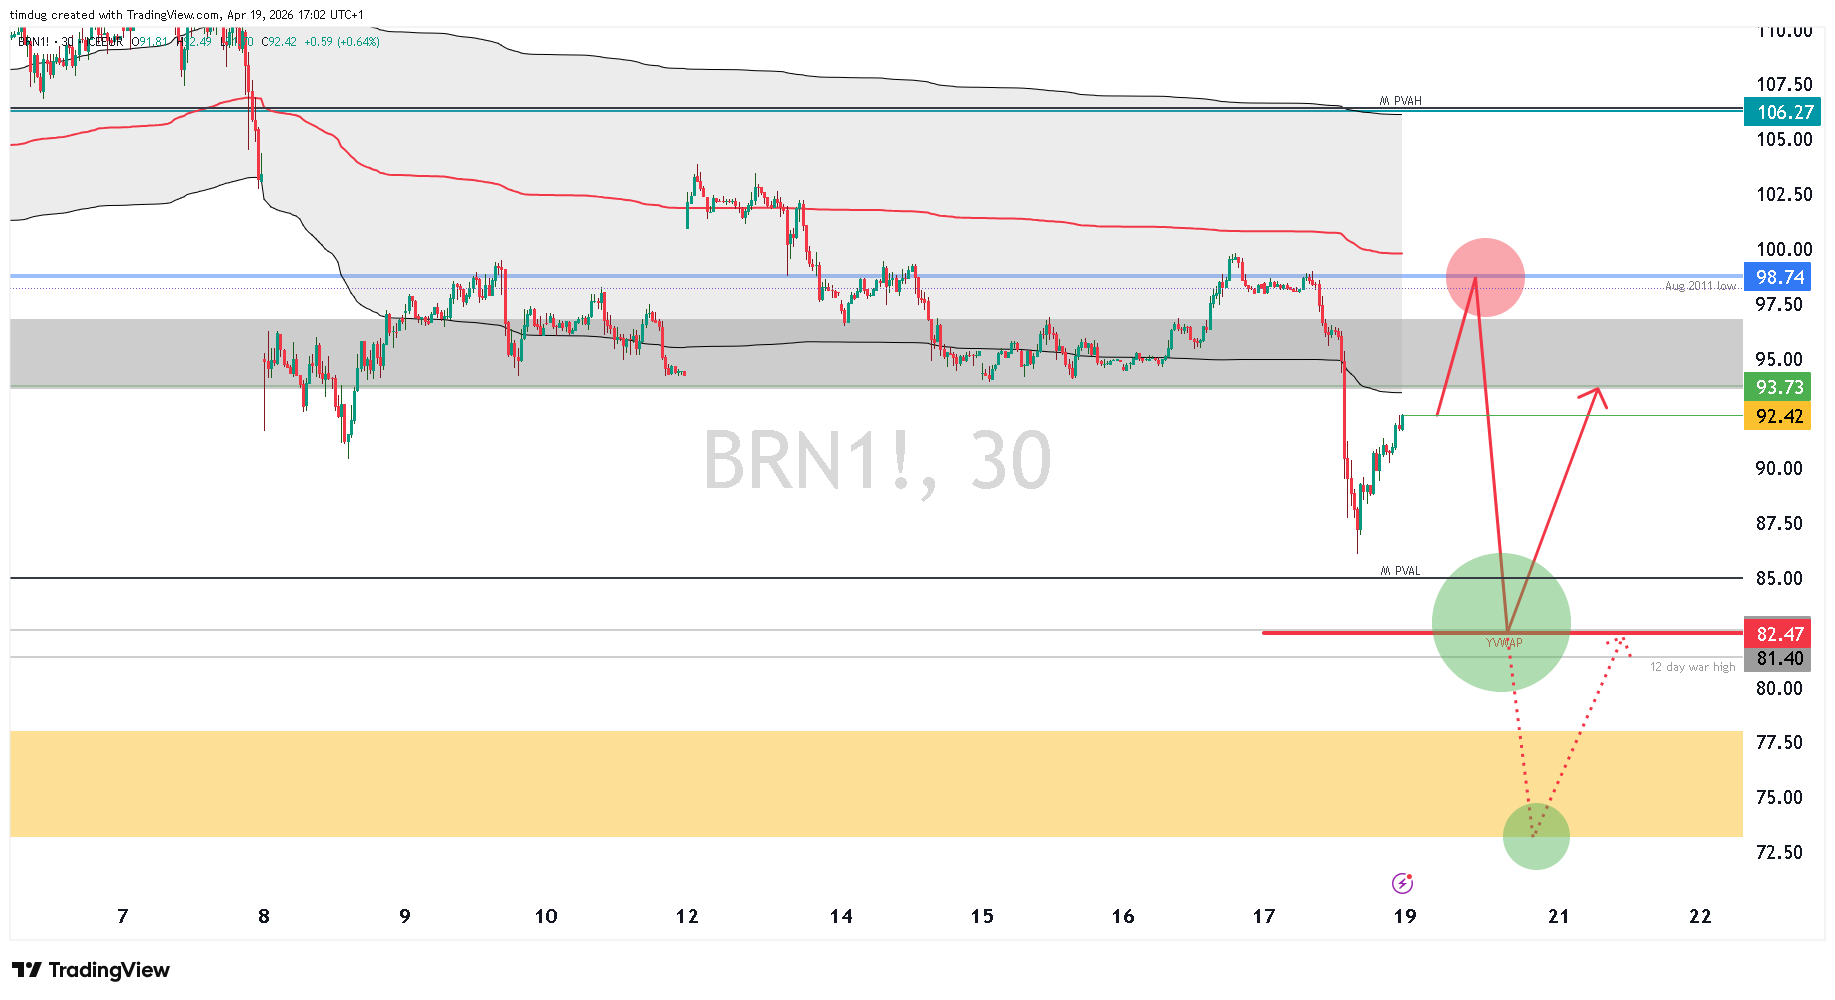
On Friday, at about 13:30 BST, it was announced that Trump was about to do a deal to unlock $20bln of Iranian funds in exchange for uranium. The market instantly reacted to this. The selling kicked off on oil, buying on equities, rally in metals and Bonds. About 60mins later, Trump announced that The Straits were now 100% open, confirmed also by Iranian officials. Oil pushed -10% on the session. The market took this as all great, done deal. However, the details then started to trickle through over the next 90 mins. Oil started to steady its descent a little.
The Iranians said that ships would have to stick to a prescribed route and that it was conditional on Israel abiding by the ceasefire with Lebanon. Oil was now -13% from electronic open. Then Trump dropped the detail that no Iranian ships would be allowed to travel through until the peace AND uranium deal were signed and fully agreed. 4hrs later, Israel bombed Beirut, Iran then closed The Straits again and the ships that were by then already traveling, had to do an about-turn. So as it stands now, the monster rally we had on equities and selling we had on oil Friday, MUST be rewound.
NET-NET: The Straits is still very much closed.
One Step From Getting Critical
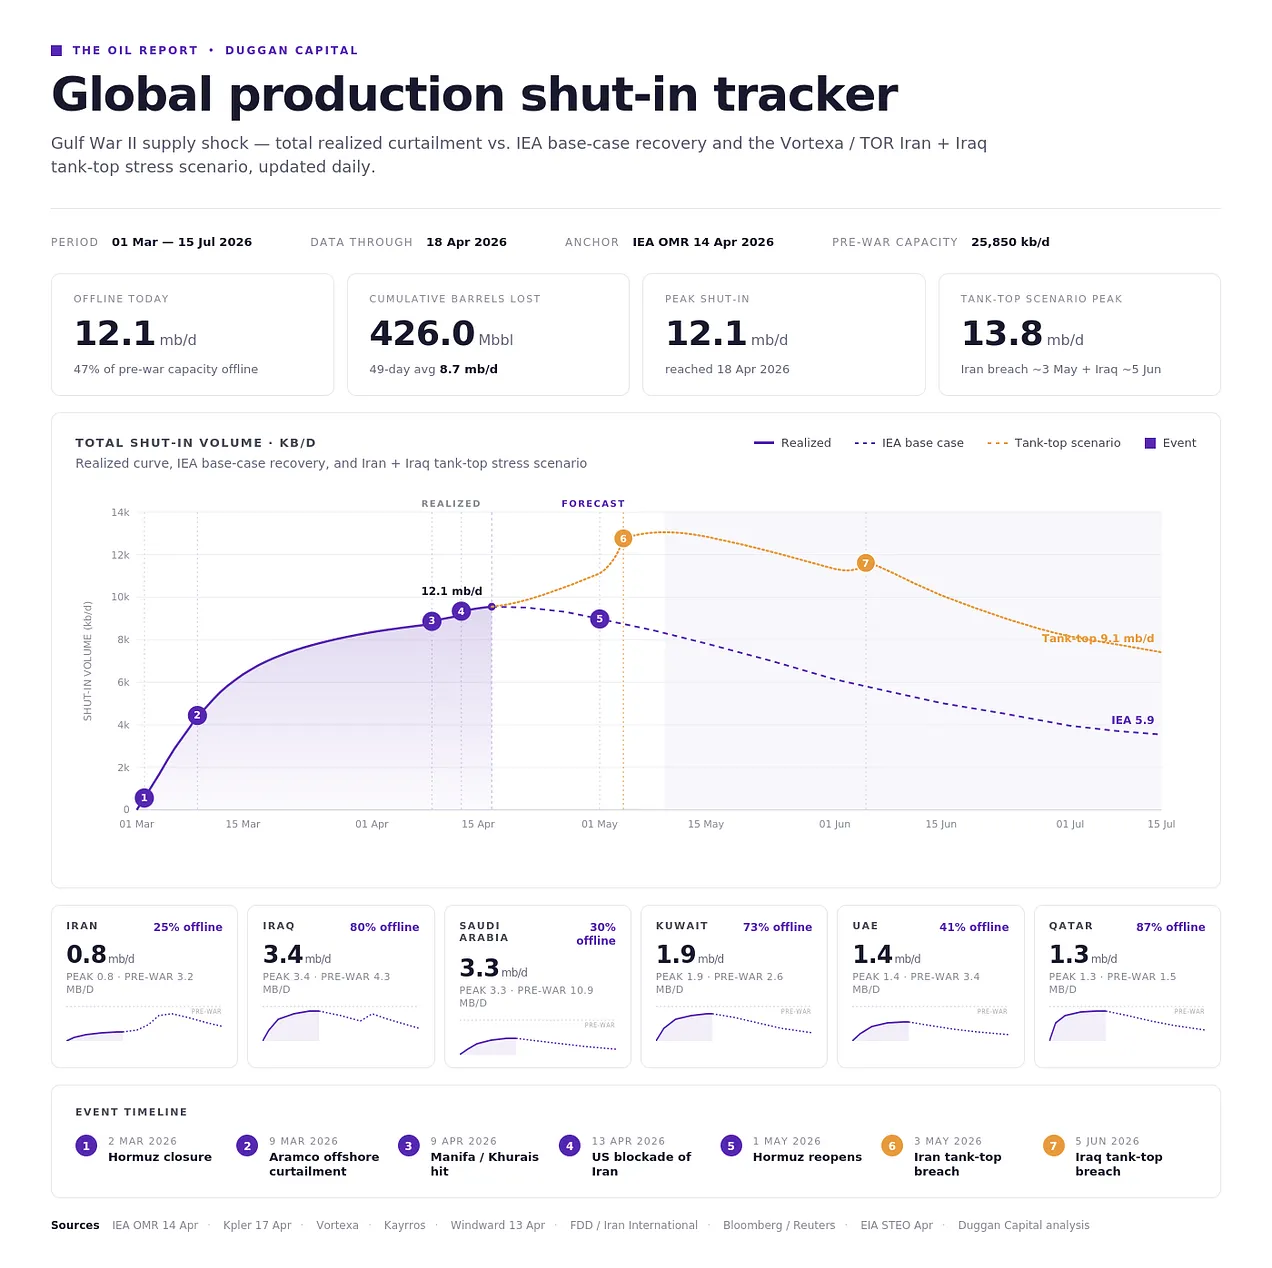
We are now at 401Mbbl shut in on production. Over 100% of the G7 SPR release is offline.
The last ships to have left Hormuz (Asia excluded) arrived last weekend at their destinations in Europe and around the world. Hormuz-Rotterdam is about a 21 days transit. Add 15 days if you have to go around the Horn of Africa. Countries are now going directly to reserves for the blends they were getting out of Hormuz and will continue to do so until 21 days after the straits are truly open.
We need to consider the second round effects of the blockade, which the world and front month pricing seems not to care about.
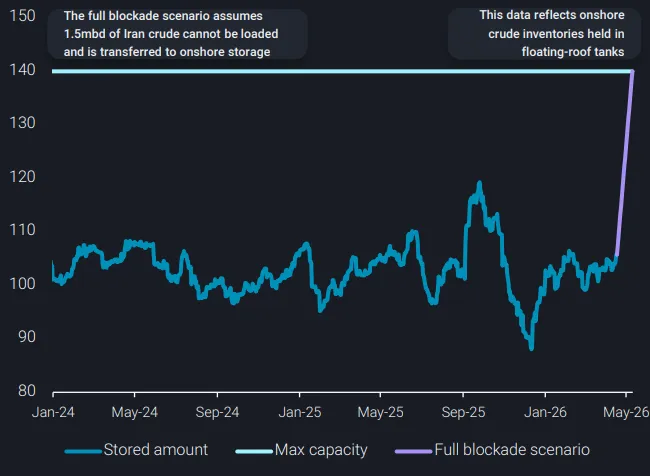
No more oil out, means that Iran are approaching capacity of their on-shore storage. They have about 35mb of space left until they have to shut in production. If this is the case, it will mean the path back to normal will last even longer. The third round effects therefore will be potentially well into 2027 if not 2028 before production globally normalises. Doomberg recently talked about $30 dollar coming soon after war is over. Well, if that’s the case, I’m selling the house and buying as much as I can on the next major dip. Stay tuned here as I will be tracking it.
There is an imminent threat to European air travel as we move our thoughts towards summer. European airlines are already grounding planes. SAS has cancelled at least 1,000 flights in April alone. KLM is cutting 160 flights next month, roughly 1% of its European routes, citing kerosene costs that make certain services “no longer financially viable to operate.” Lufthansa has shut down its City Line feeder airline immediately, a closure originally planned for 2027, and pulled 27 older, less fuel-efficient aircraft from service. Irish airline Aer Lingus is cutting 500 flights as of today-Sunday.
Ryanair CEO Michael O’Leary has warned of further summer cancellations if fuel shortages persist. EasyJet is projecting a first-half pretax loss of £540-560 million. In Asia, the disruption is already worse: IATA Director General Willie Walsh.
(a good local Irishman) confirmed flight cancellations due to physical fuel shortages are “already happening in parts of Asia,” and estimates European cancellations could begin by the end of May. In total, the IEA estimates that air traffic across Gulf hubs has collapsed to 40% of pre-crisis levels in the UAE, 25% in Qatar, and near zero in Iran, Iraq and Kuwait.
The retail trading crowd loves a good old manipulation story. The Hunt Brothers cornering Silver in 1979, Sumitomo copper affair in 1996. Barron Trump is the latest focus, supposedly front-running crypto markets and oil markets. The new senate investigation is into market about information asymmetry rather than price manipulation. Two different things. I thought it might be interesting to think about the numbers at play if you were to think about manipulating the oil market.
Normal market conditions
- ICE Brent + NYMEX WTI combined open interest is typically 3-4 million contracts
- Each contract = 1,000 barrels at $95 = ~$95K notional per contract
- Total notional open interest: roughly $285-380 billion
- Normal daily volume: 1-2 million contracts = $95-190 billion in daily turnover
The manipulator with $950M = roughly 10,000 contracts, or 0.5% of a normal day’s volume.
Brent Oil Price Forecast
Every new Brent Oil analysis as it publishes, today's technical signal and key levels, live price — on one page.
See all Brent Oil forecastsThe Market Dislocation
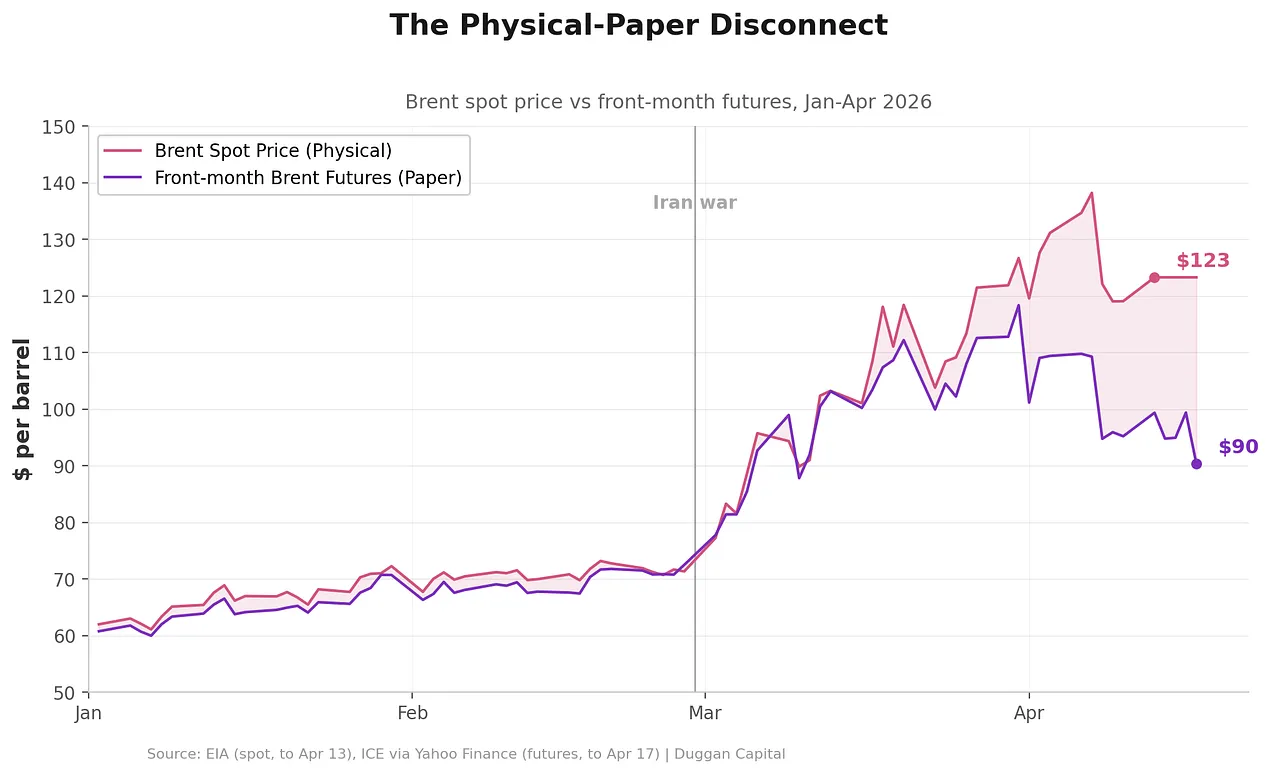
What we can point to with better evidence is the market dislocation. Physical crude is different to ‘paper’ or what is often called ‘virtual’ crude. For those interested in getting into the weeds and finer detail, have a watch of Ilia Bouchouevs series on youtube to accompany his book ‘Virtual Barrels’. There is little Ilia does not know about trading oil. He is a frequent consultant to OPEC and a fellow at Oxford Research, having retired from energy quant trading.
Okay, back to Physical vs. paper barrels. You can see from the chart below, that oil delivered at spot ie. right now, deliverable trades as per last Monday was trading at a $33 premium to where front month futures May deliver was trading. This is not normal to have such a spread. Normally, there is a tight spread between the two, as such the front month future daily settlement is taken as the spot rate, with minimal difference. Also account for different grades etc.
Reasons For The Dislocation
Below: why the front month has stopped functioning as a spot market, what the VaR roll means for the next two weeks, and the COT signal that says where this breaks next.
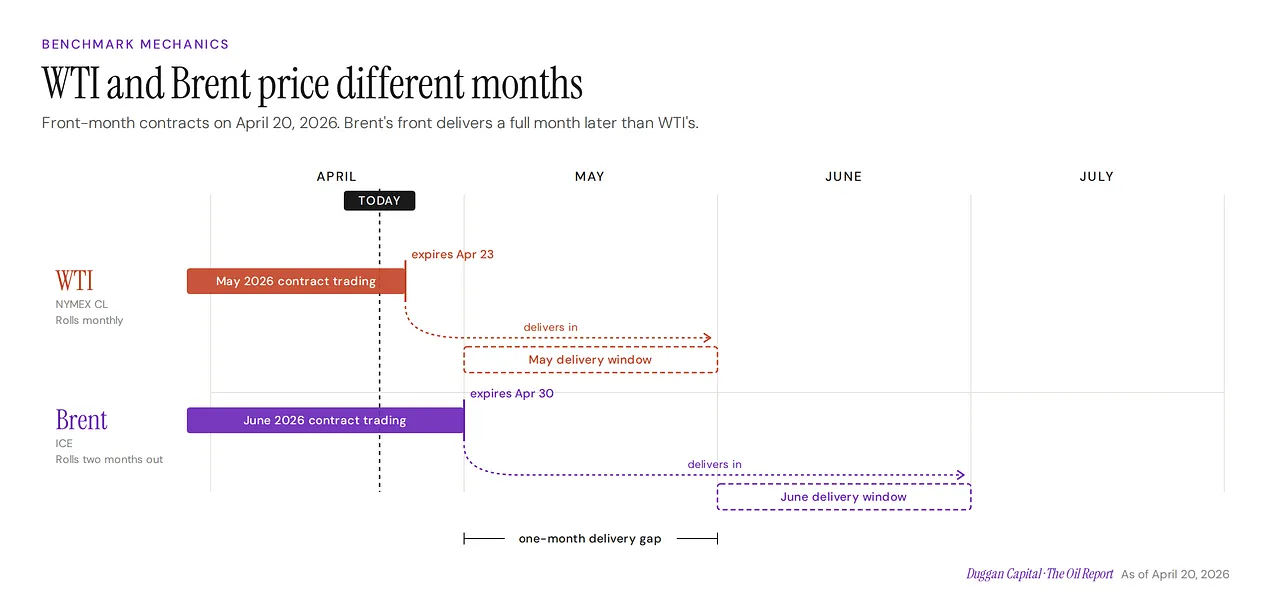
Risk management and roll difference. One thing has to be made clear before we get into the broader expiation. The difference between WTI and Brent roll offs. We have already closed trading on Brent May with June now the front.
There Is No Manipulation
The volumes have dropped because the major participants in front month 1,2,3 (May, June, July) use VAR risk sizing models. The main component of the var risk model is the 20 to 60 day ADR (average daily range). This then dictates the amount of size you can trade for that specific product. If the ADR explodes, then your model cuts down the amount of size you can trade. So that’s why there is reduced overall volumes in the futures front curve. The VAR model also has a score for each spread.
So you have reduced volume, due to VAR model change AND we are nearing delivery on K. So people roll to M- June as early as possible to trade in the month where it is more likely we get a softening in the situation, rather than earlier. This type of behaviour is normal where on increased volatility, the market volumes actually shift forward 2 to 3 months. Occasionally, the volumes will skip an entire month forward, to essentially leap- frog the volatility to lower volatility points on the curve.
Ok, so pack that aside. You then need to realise the actual real players looking for real delivery are going OTC on physical effectively. Think traders on phones buying/ selling physical for delivery right now. Yesterday BRENT physical was trading $147 while K futures was $98.
The NET NET:
The front month is normally the spot market, however NOW you have a mad scramble for supply that spot is basically over the phone and $50 higher. The front month is then left with algos and retail trade, with very little meaningful ‘real’ trade.
For those interested, the risk model is called a volatility targeted position sizing. We use a hybrid of this in Duggan Capital on futures. Similar to what Bridgewater use for their risk parity models.
Storage Levels
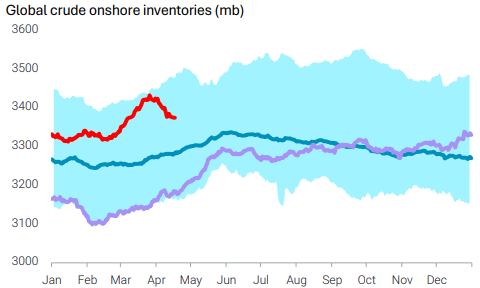
- OECD -v- Non OECD A tale of two regions. The ‘West’ OECD countries under 10year averages with Non OECD well above the same.
- China storage continuing to climb. This now should get severely slowed down with a US blockade in effect. ‘‘China onshore crude inventories rose further by 0.6% this week, up 1% in the past 4 weeks’’- Vortexa
- Japan is toasted- Asia (ex-China) onshore crude stocks are down 1.7% w-o-w, bringing the 4-week decline to 7.2%- Vortexa
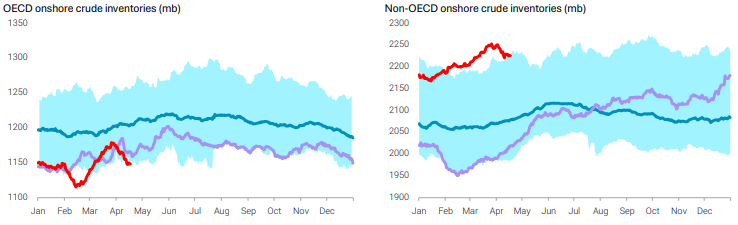

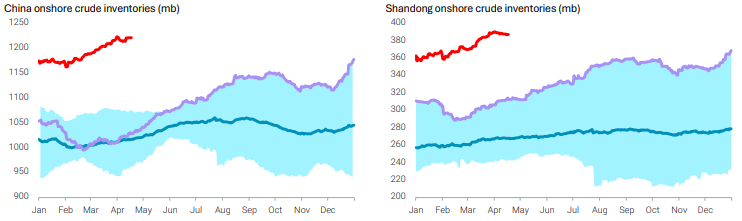
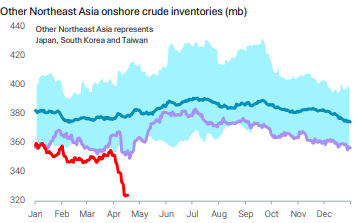
Source: Vortexa
Commitment Of Traders Report
Product: Brent ICE EU
Report: Disaggregated
Report date data captured: 14th April 2026
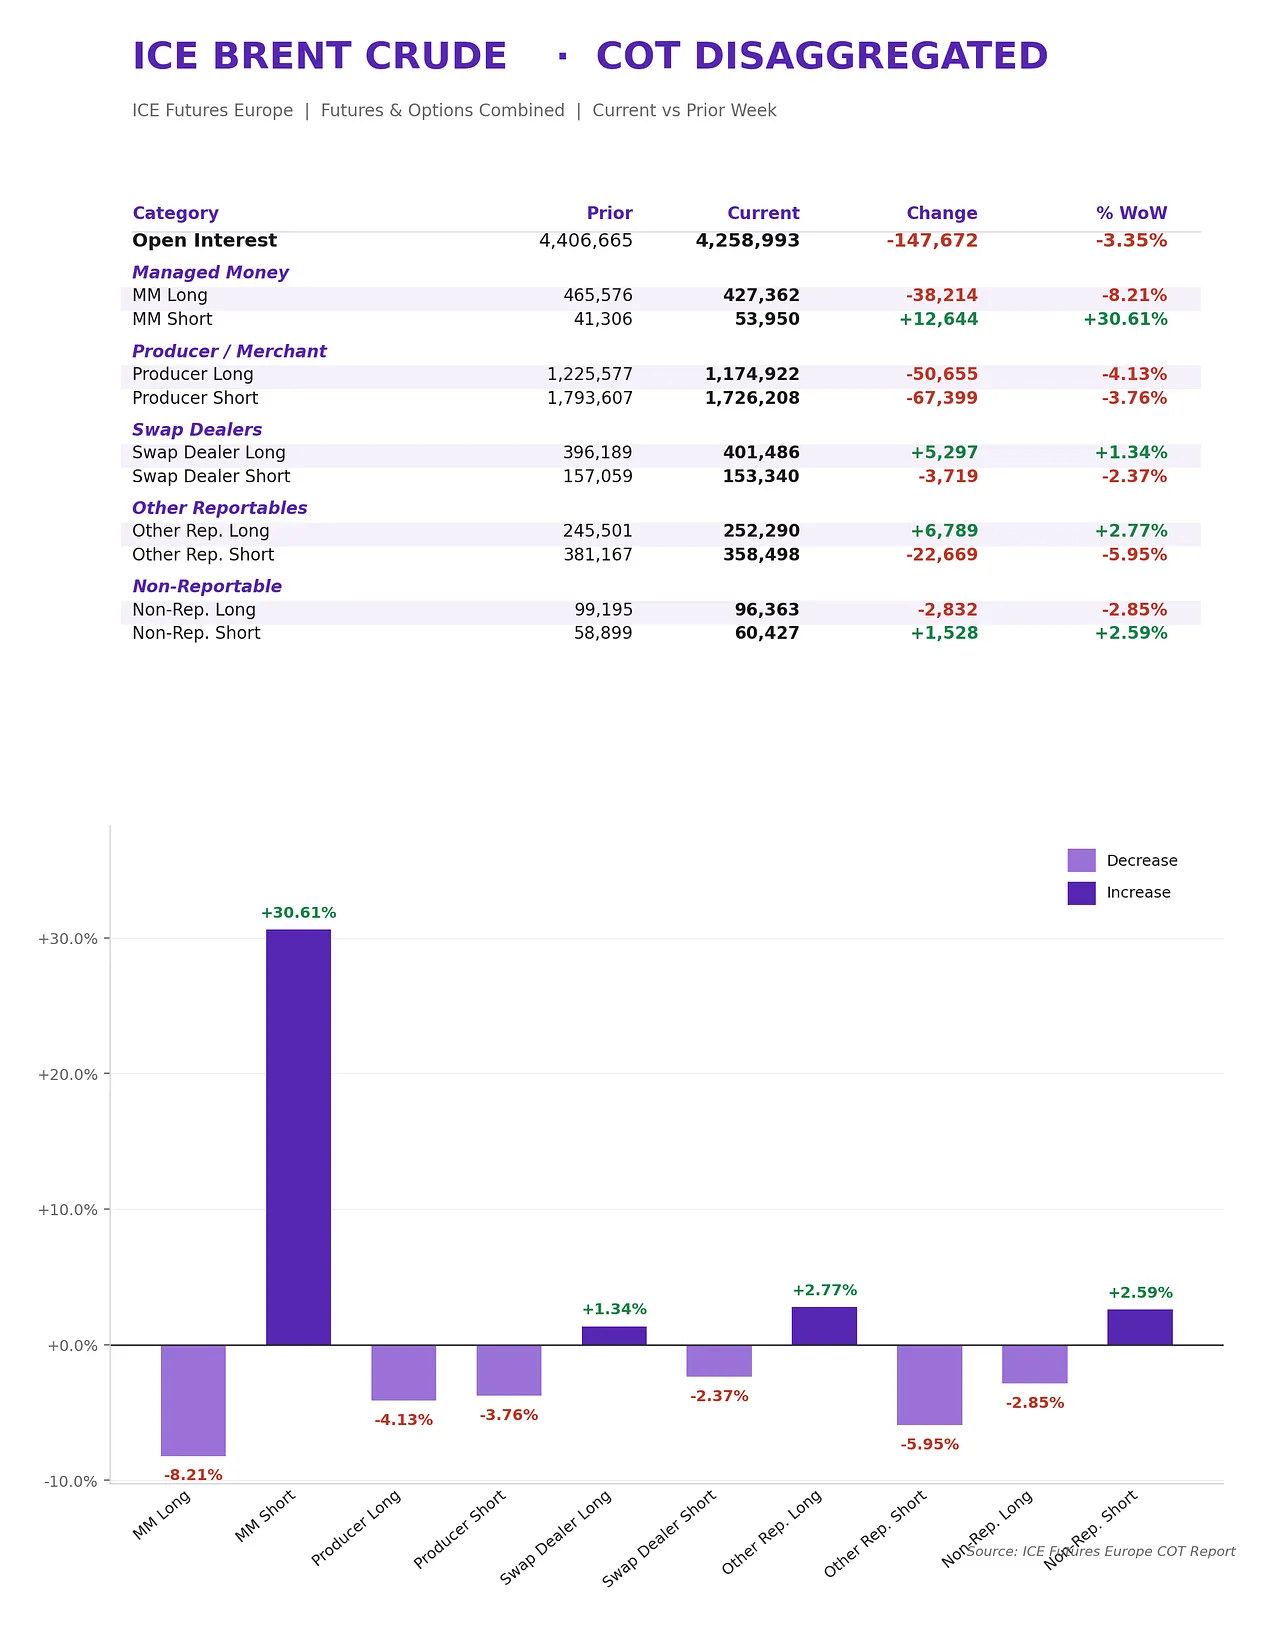
In summary: This is a week of long liquidation from specs, not fresh bearish positioning. Worth watching whether MM shorts continue building next week – that’s when a short-covering reversal setup would start to form. The Briese-style interpretation: extreme MM net long unwind, but not yet at the extreme short side where contrarian longs typically win.
- Open interest down 3.35% – broad-based de-risking, not a one-cohort story
- Managed Money: aggressive de-grossing. MM longs cut 8.21%, MM shorts up 30.61% from a low base – but note shorts are still only 53.9k vs 427k longs. Ratio is still lopsided long. When you boil it down though MM Shorts aggressively increased.
- Producers cut both sides – Long -4.13%, Short -3.76%. Net hedge ratio barely moved. Physical hedging programme is stable.
- Swap Dealers drifted short-to-long (Long +1.34%, Short -2.37%). When Swap Dealers cover shorts their clients are reducing longs. Fitting in theme with the MM activity. The ‘sophisticated’ money to me seems to be trading the headlines.
- Other Reportable covered shorts aggressively (-5.95%) while adding longs – this cohort (prop shops, algos) often leads directional shifts.
Swap Dealers
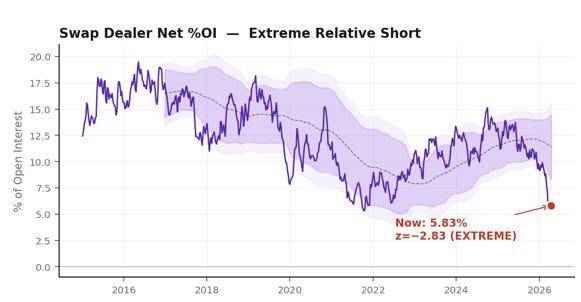
Swappies are vacating the market. The OTC/physical call on barrels for delivery now means that they will get run over trying to take the other side of OTC demand. What is remarkable is the Z score WOW change was 2.83. An almost 3 sigma change.
What’s The Next Move?
We continue to be at the mercy of headlines and insane whiplash price action. This is no place to carry outright front risk in size.
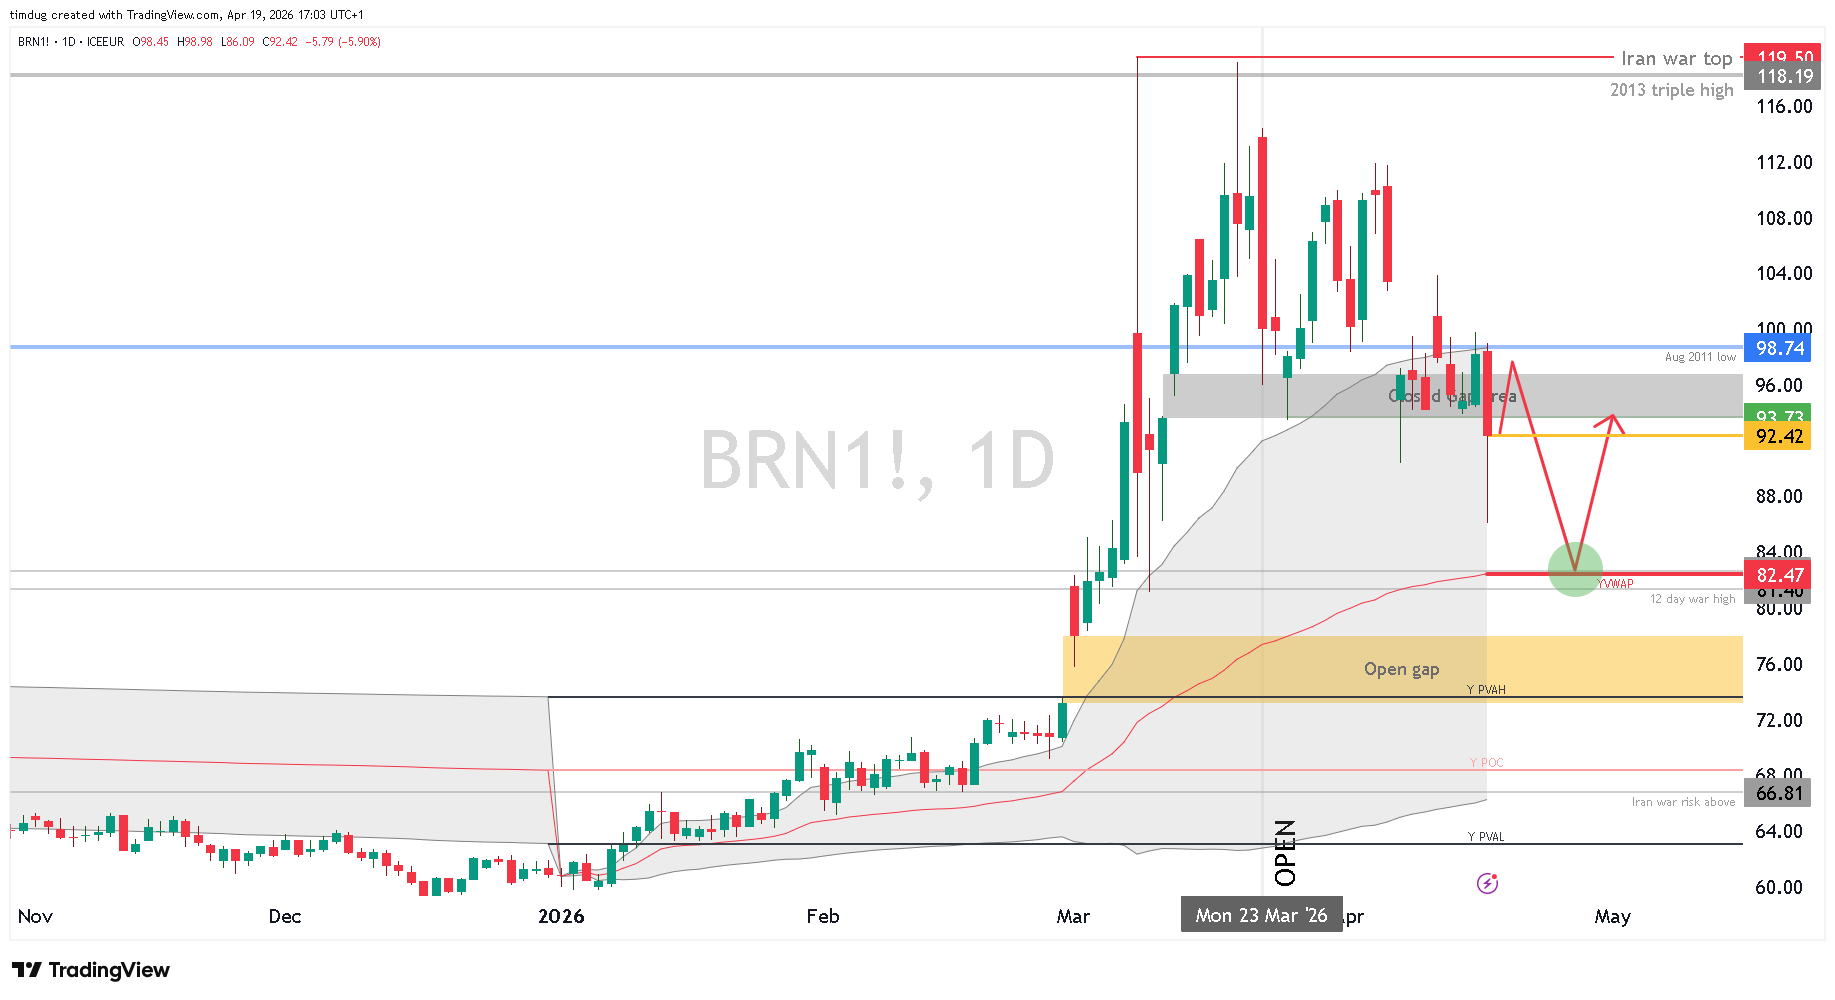
One thing that I need to see is how the market wants to react to overselling Friday’s ceasefire and opening that got fully reversed. Will price reverse? Will equities reverse? It is my belief that the entire oil curve is in complete tatters. The market is still in full price discovery mode still. We will see A LOT more upside by the end of September.