


Oil prices are rising as the supply shock in the Persian Gulf transforms from a geopolitical risk to an inflation, growth and supply chain threat. I think that a sustained breakout above long term resistance could open the way for a bigger move towards $200 if the Strait of Hormuz crisis persists and physical oil shortages emerge. This article explores the supply shock, recession risks, early signs in the real economy and technical levels that could determine the next big move in oil prices.
Persian Gulf Supply Shock Pushes Oil Prices Toward Breakout
The latest rally in oil prices is fuelled by the collapse of negotiations between the U.S. and Iran. Both sides appear to believe they still hold leverage. This makes it less likely that negotiations will be swiftly resolved. This means traders are now anticipating a longer war and a longer disruption to oil exports.
It is not just the Strait of Hormuz. The U.S. blockade of Iranian ports is also important. Iran has reportedly stockpiled large volumes of oil in tankers outside the Persian Gulf. The U.S. Navy may be able to limit these flows which could take away a critical supply buffer. This would put more pressure on the physical markets.
The supply crunch has so far been confined to Asia. China has been able to cope by tapping reserves. But other Asian refiners have already curtailed production because of crude shortages. Europe has been able to stave off a more severe shortage by importing more oil from the U.S., but that also draws down the strategic reserves.
Oil Shortages Raise Recession and Inflation Risks
The real risk comes at the end of May. The market has been supported by crude already afloat, refinery stock releases and China’s drawdown of reserves. But these are only temporary measures. When these expire, the shortage could be exposed. If China returns to the market to build stocks, oil prices could surge.
Dow Jones Price Forecast
Every new Dow Jones analysis as it publishes, today's technical signal and key levels, live price — on one page.
See all Dow Jones forecastsIf crude oil prices move towards the $200 per barrel, it would send shockwaves through the world. Crude is used in transportation, food, mining, aviation and manufacturing. Economic activity would likely slow because of a deficit of about 12 million barrels a day. This will increase the risk of a recession from this oil shock. It does not just increase prices. It can also reduce output.
The secondary effects of this shock will be bad. Diesel shortages can affect farming, mining and long-distance transportation. Jet fuel costs can cause airlines to increase prices and reduce services. Helium, sulfur and fertiliser shortages can also put industries under stress. Helium helps make semiconductors. Sulfur is used to purify copper (XCU), gold (XAU) and silver (XAG). Lack of fertilizers can affect crop yields, particularly in the developing world.
Stock Market Strength May Hide Early Warning Signals
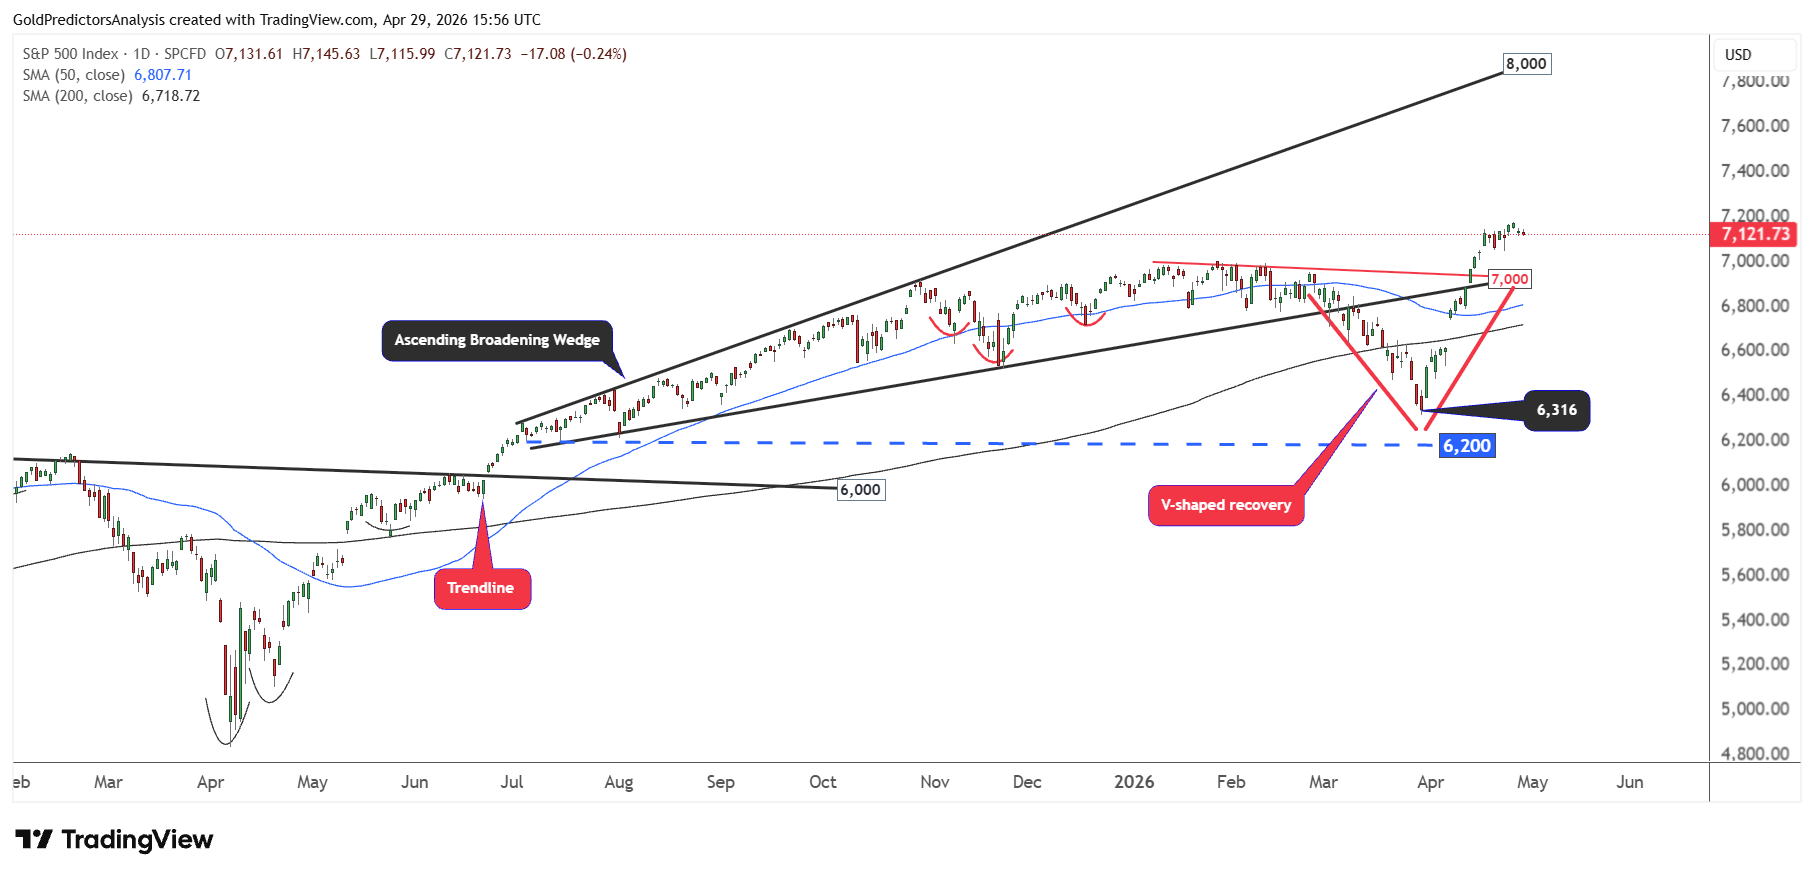
The Persian Gulf conflict is not showing much impact on the S&P 500. The index remains in a bullish trend with a breakout above 7,000, supported by solid earnings in Q1 2026. The chart below shows constructive price action in the S&P 500. But this might not be the full story.
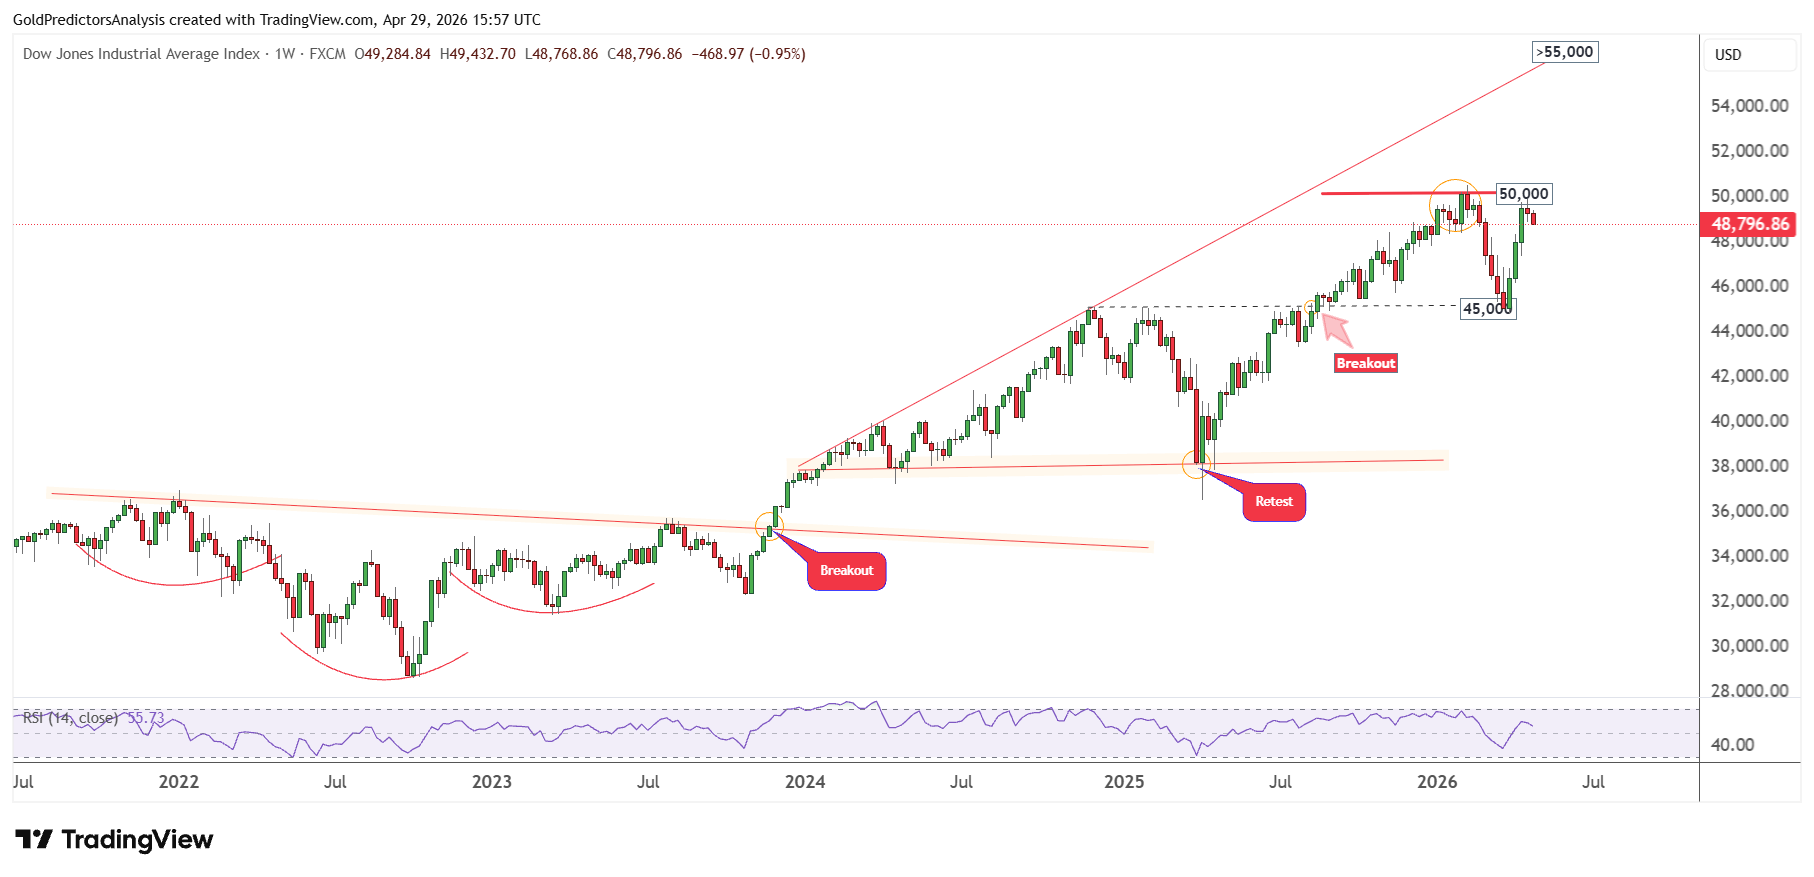
Other market indicators are not that positive. The Dow Jones Transportation Average has already fallen. The chart shows that the index failed to break above 50,000.
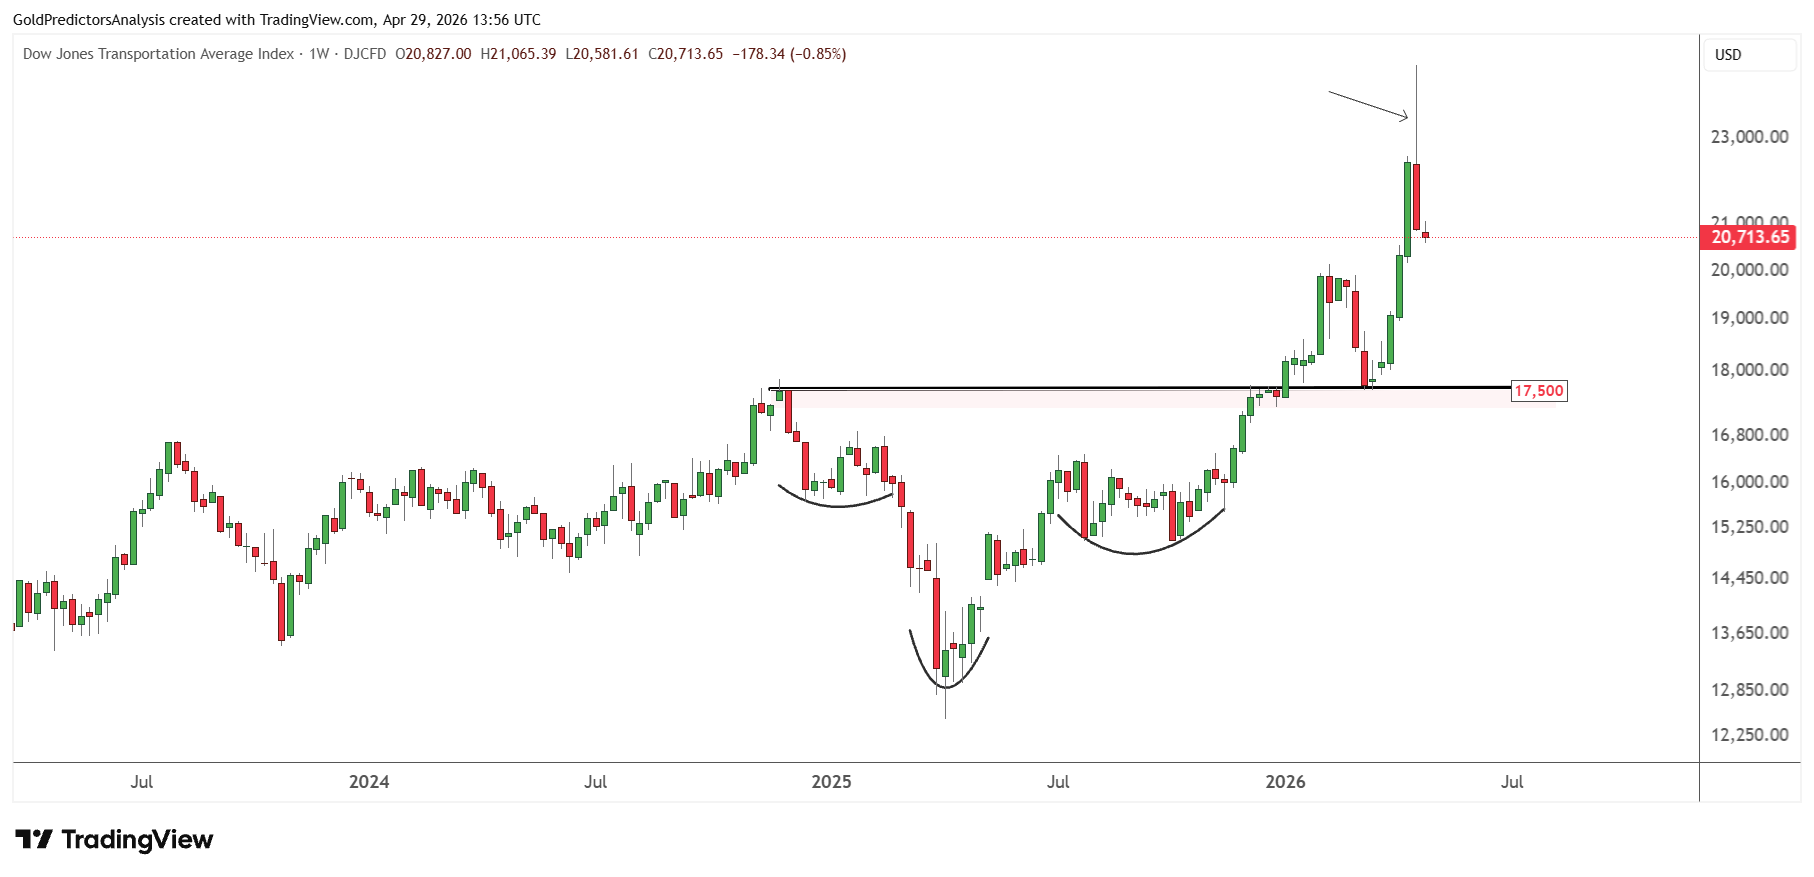
That is because stock prices in the transportation sector respond quickly to the effects of higher fuel prices and weaker demand. Continued weakness in transport stocks might signal that the oil shock is feeding through to the real economy.
The chart below shows that the Transportation index has formed a strong bear hammer candle last week which indicates further weakness. The long-term support in the index remains at 17,500.
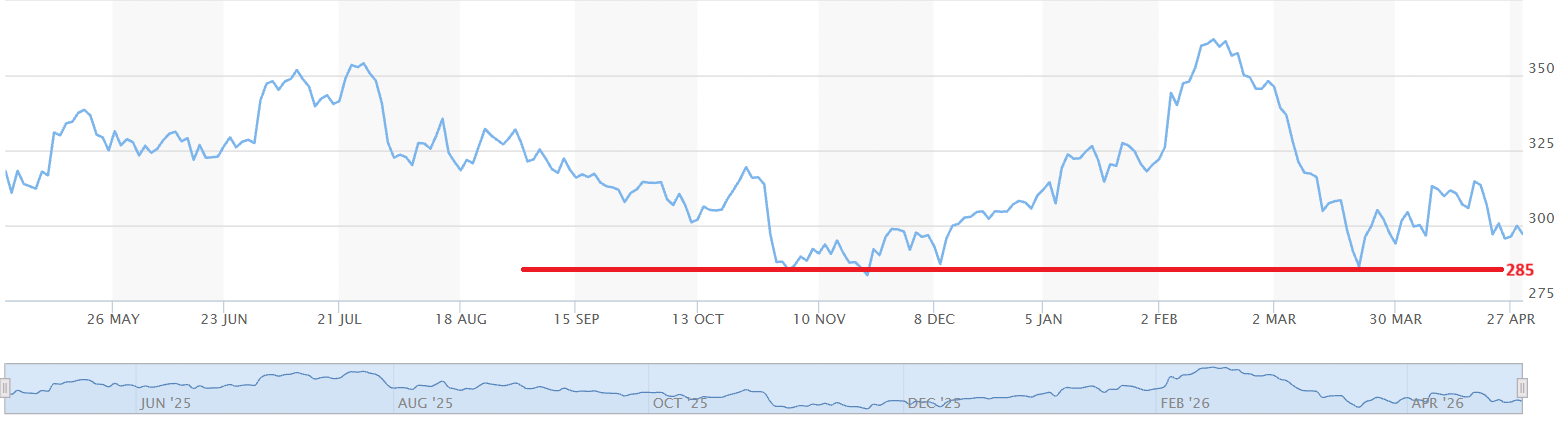
The S&P 1500 Containers & Packaging Index is also an important index to watch. A dip in the index points to slowing Main Street. The chart below shows a bearish trend. A break below 285 will indicate further downside.
Meanwhile, 10-year Treasury yields above 4.3% indicate that inflation expectations and budgetary fears are on the rise. With inflation persisting and growth slowing, the Fed will have to make a tough decision. That would make negative real interest rates more likely and oil inflation the main focus for the markets.
Real Economy Data Confirms the Slowdown Risk
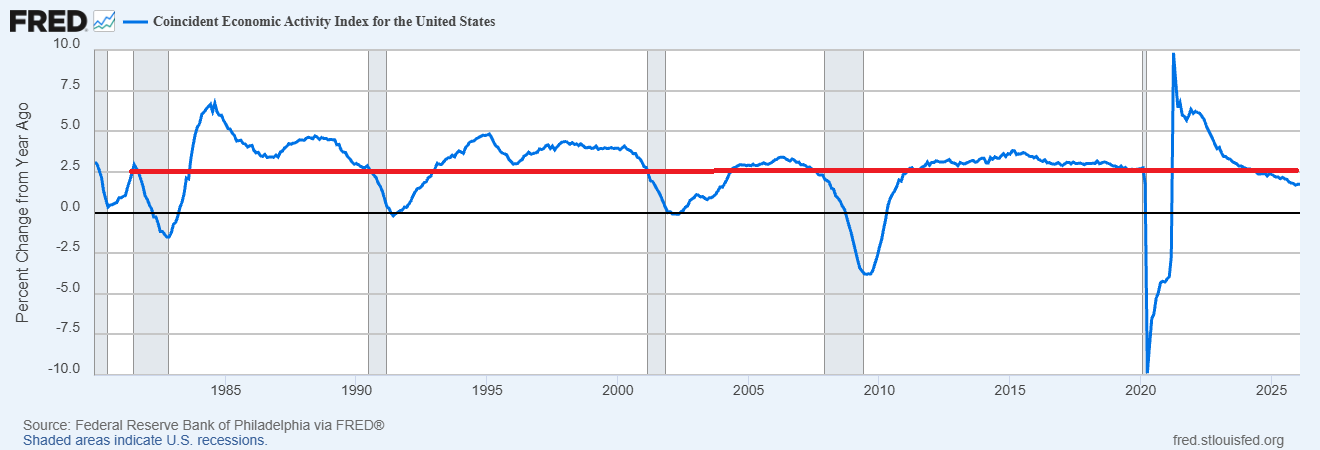
The slowdown risk is not just affecting transportation companies. The data from the real economy also shows the risks of a slowdown. The growth rate of the Philadelphia Fed Coincident Economic Activity Index dropped to 1.7% in December in February 2026. This is significant because this level has been historically associated with recession. It signals that economic growth is slowing even as major stock indexes are growing.
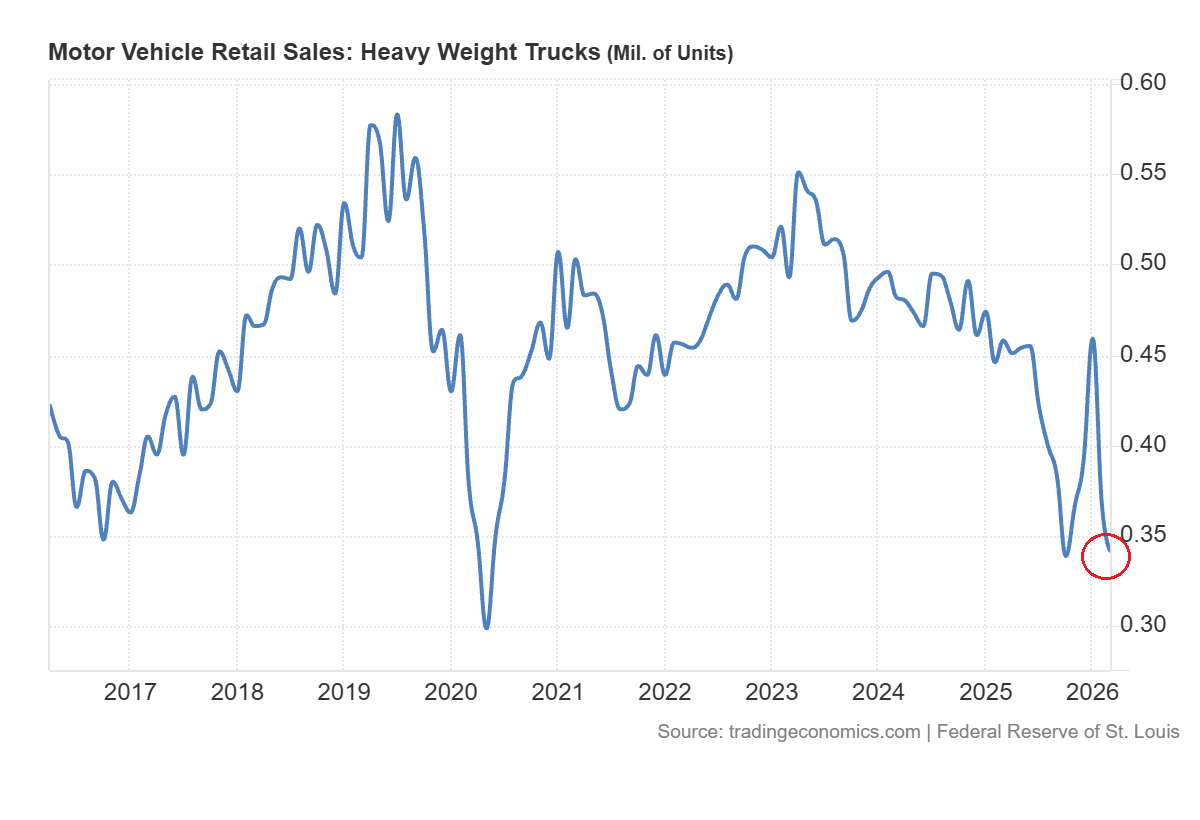
Sales of heavy trucks are also falling. This is another warning sign. Businesses typically purchase heavy trucks in anticipation of higher demand and freight activity and improving business conditions. When companies are buying fewer trucks, it may be sign of weaker activity. The oil shock is therefore more worrying because it is occurring at a time when demand for transport is expected to fall.
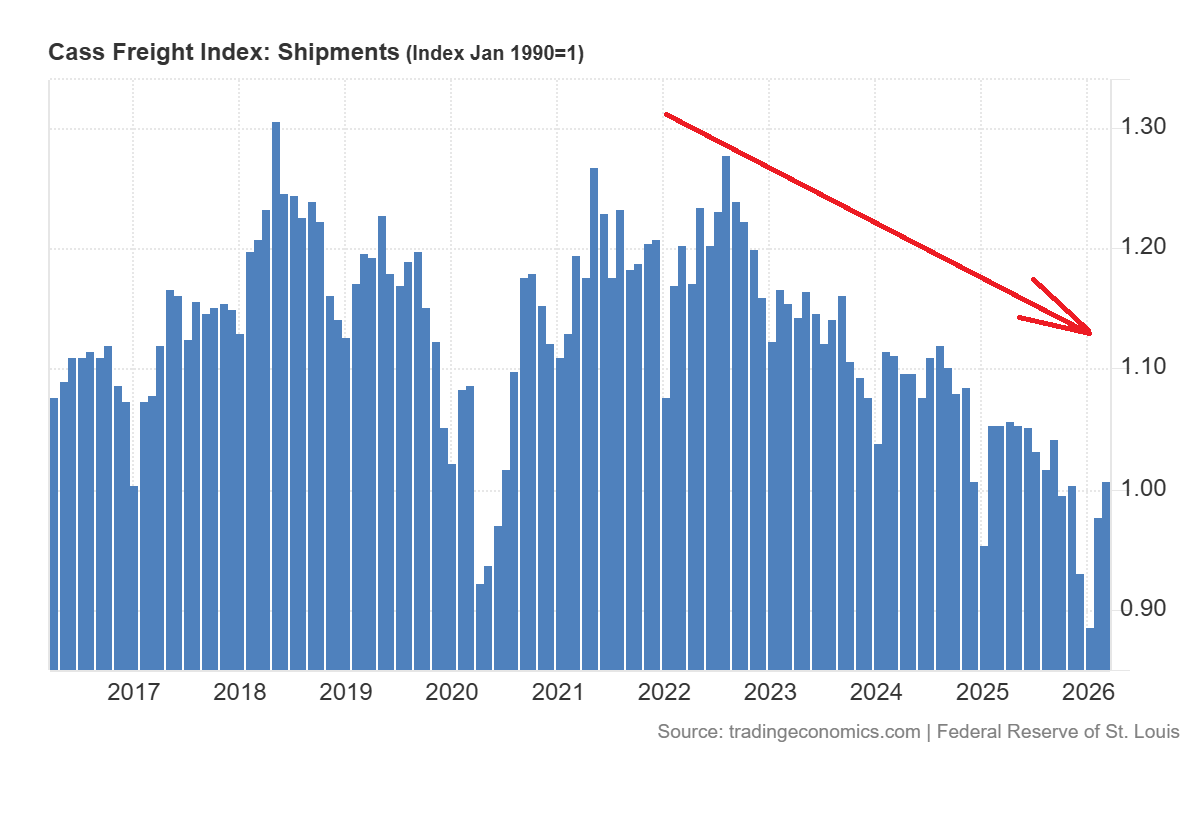
This is also reflected in the Cass Freight Shipments Index. Freight represents the transport of goods. When this index slows, it implies a cooling of demand, shipments and business. This is important because freight shipments reflect Main Street demand. The chart confirms that the index is weakening since the 2021 peak.
So the oil shock is occurring at a time when some activity indicators are weakening. This means there is a greater likelihood that more expensive oil will not just boost inflation but also slow the economy. And this poses a big risk for markets.
Oil Technical Analysis: Long-Term Breakout Points Toward $200
From a technical perspective, the oil price is on the verge of breaking the strong long term resistance at $106. This requires quarterly close above this level to confirm the upside momentum. This means that the oil prices must close above $106 in Q2 2026.
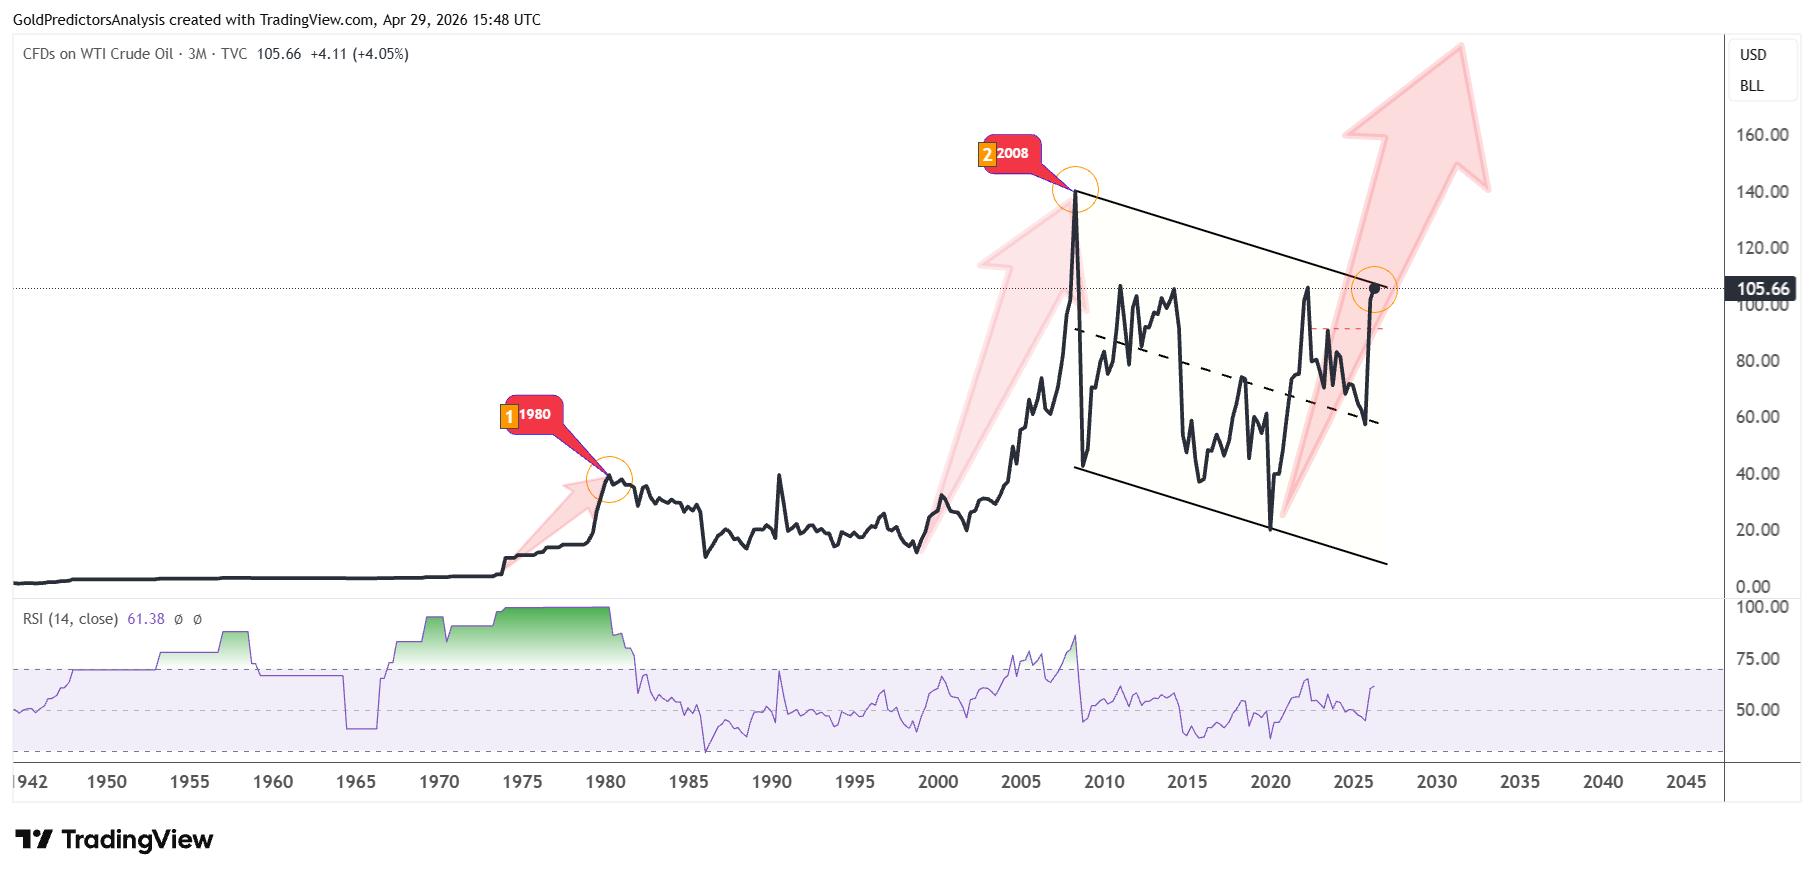
This breakout will open the third wave in oil history that may push prices towards $200.
The chart shows that the first wave of oil surges occurred from 1973 to 1980. The second wave developed from 1998 to 2008. Now, the third wave appears to be breaking out at the Strait of Hormuz closure and this will likely push prices towards the $200 area. However, if the oil supply stabilizes by June 2026 and prices remain below $100 by Q2 2026, then possibility of further consolidation below $120 will persist.
Final Words
Oil prices are now at a critical stage in the cycle. The Persian Gulf supply shock transforms the market from the usual geopolitical risk into an inflation and recession risk. Supply shortages, declining freight volumes, truck sales and transportation stocks are all evidence that the shock is already rippling through the economy. If oil prices remain high, they can increase transport, food, mining and manufacturing costs while decreasing real activity.
The technical view also points to a tipping point for oil. A quarterly close above the long term resistance around $106 would increase the likelihood of a third major oil wave to target $200. But the risk outlook is crucial. A stabilization in supply by June 2026 and failure to sustain above $100 in Q2 would likely keep oil consolidation below $120 for longer.
If you’d like to know more about how to trade crude oil, please visit our educational area.