



The US administration has lost control of the narrative. In the parlance of poker, Trump tried to pressure the pot with a 24hr, then 5 day window or else he would ‘destroy’ Iran’s entire power grid. Iran called the raise. Now the US are locked into representing their hand with 2,500 additional marines now moved into the theatre, with an assault on Khrag Island whispered as the first deployment ground. There are currently over 50,000 US troops in The Middle East.
The administration is now u-turning away from the unquestionable support seen thus far for Netanyahu. Vance is stepping in to front peace negotiations with Iran. If he can successfully extract the US from the situation they are now locked into, it will serve to bolster his presidential run in the next elections. A topic for another day.
But where does all of this leave oil? In short- A lot higher. We are still on the upswing, not the top of the swing of this conflict.
In oil pricing terms, there are some important indications that we will not see sub $70s Brent for a long time and with good reason, with Dec 26 futures at $84.97 at time or writing.
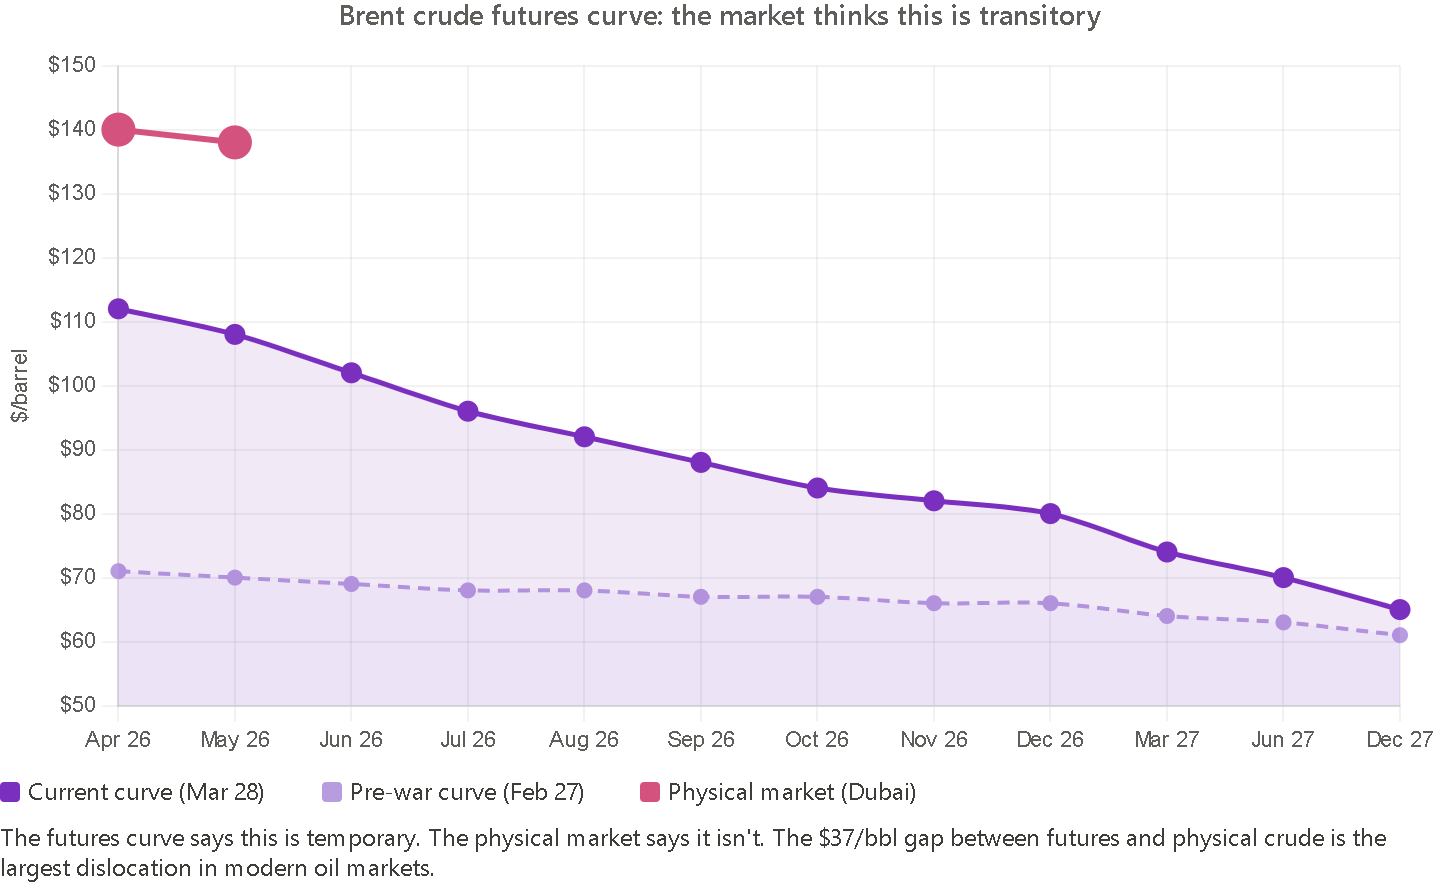
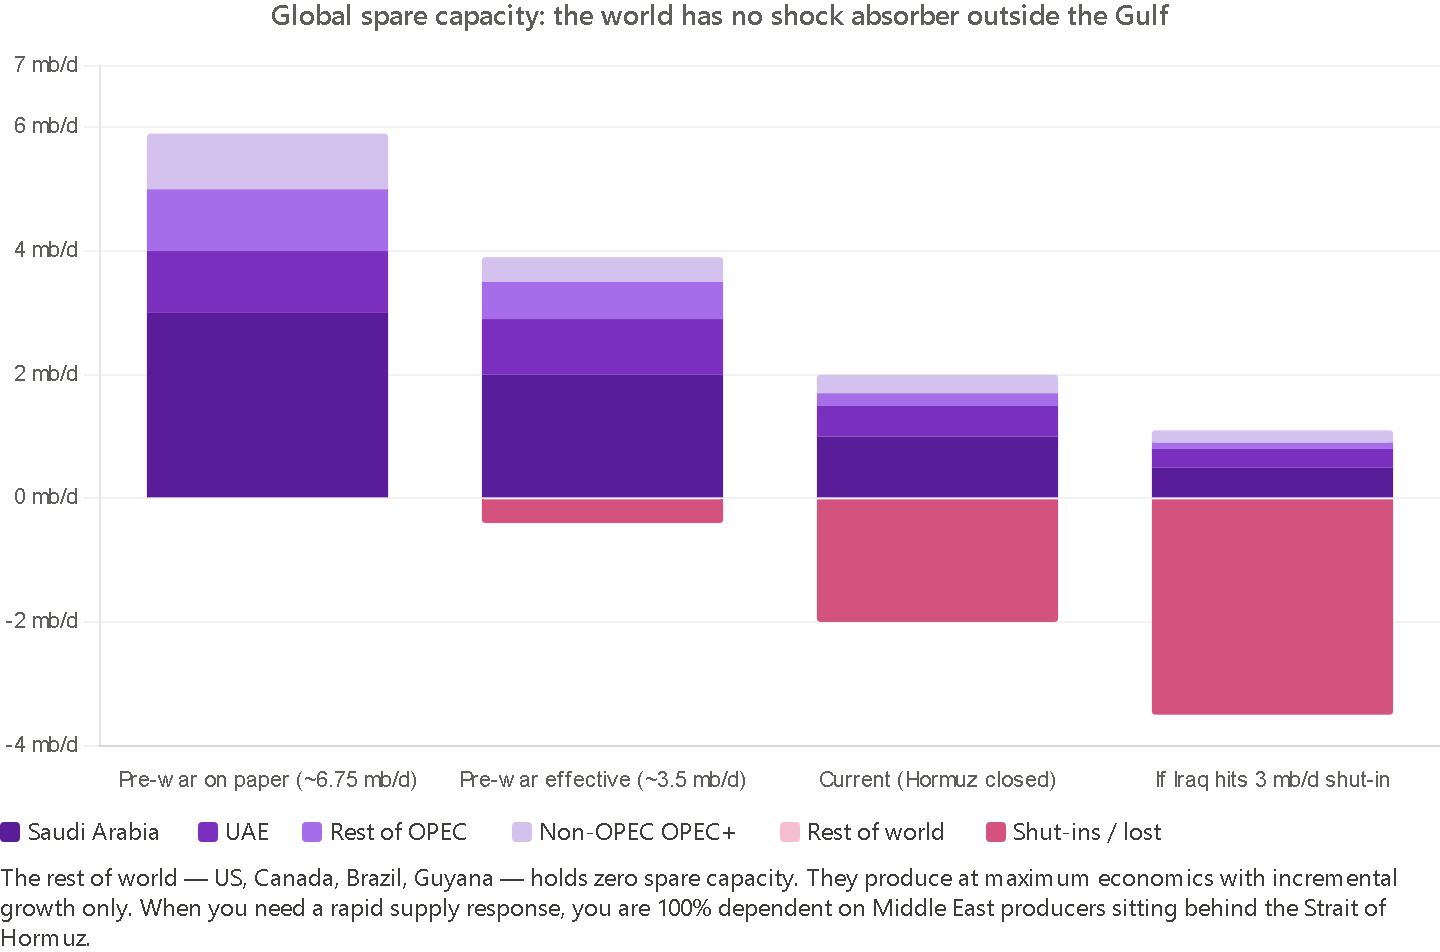
The main reasons we are higher for longer on price are.
- Backwardation curve Dec 26 is pricing 10+% over pre-war Dec 26.
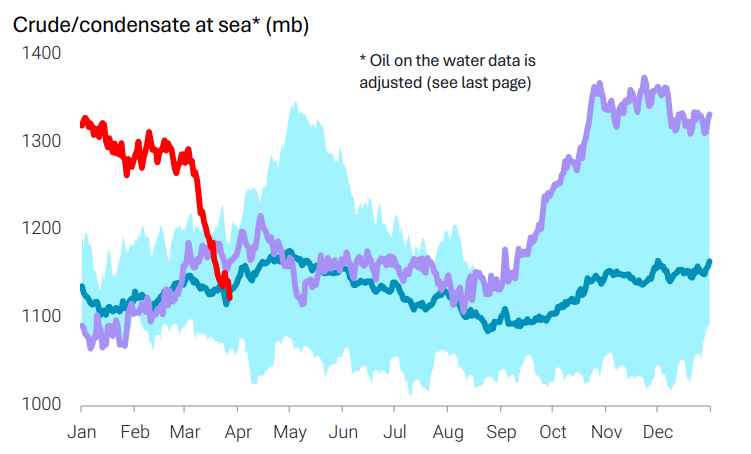
- The spare capacity picture that was previously on paper: 6.75 mb/d. Effective: 3.5 mb/d all sits locked in Saudi Arabia. Yes, they can get almost 5mbpd out to Yanbu port, but what about the other 15mbpd stuck in Hormuz. We have to recognize though that India and China are getting some shipments through. Also- The floating Glut is now drained down.

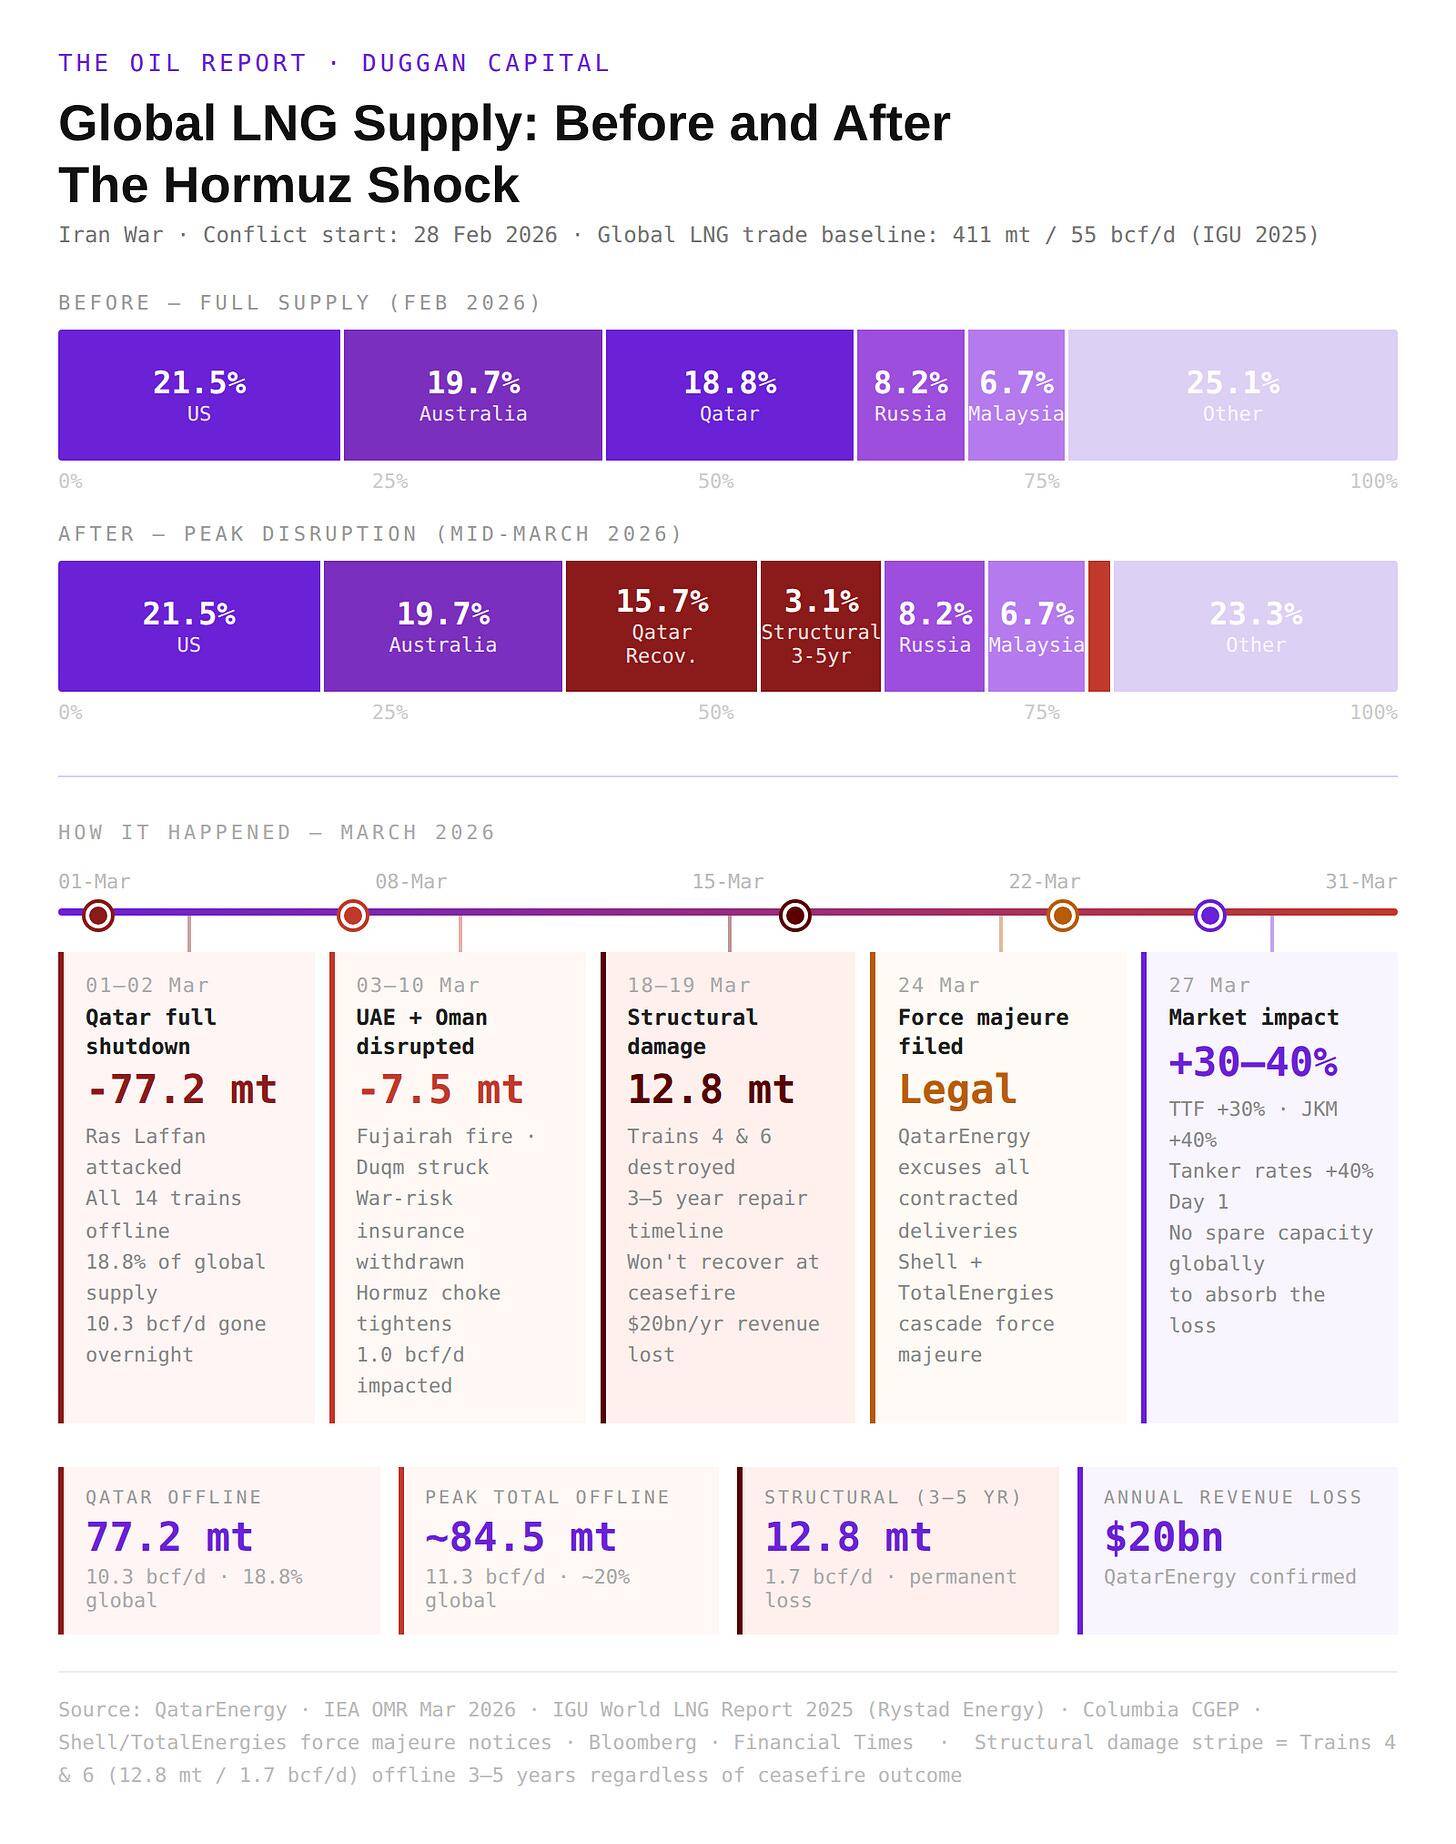
LNG Framework is currently broken. With significant amounts of oil shut in on production. Qatars LNG is down 17% for 3-5years. This will not heal overnight.
See our tracker below for the current shocks to production on LNG, in physical trading terms, measured in metric tons.
Quiet Economic Cracks
UBS froze its $469 million Euroinvest real estate fund last week – locking investors out for up to 36 months after redemption requests drained liquidity. Ares, Apollo, and BlackRock have all capped withdrawals from private credit funds under the same pressure. The first major European property fund gating since the war began. It will not be the last.
Lagarde laid out three ECB scenarios for the energy shock – look through it, measured adjustment, or forceful response. That is the head of the ECB publicly admitting she does not know which door she is walking through.
And then there is the number nobody is talking about. Steve Hanke of Johns Hopkins and David Walker, former US Comptroller General, published a Fortune piece last week drawing directly from Treasury’s own FY2025 financial statements – released to near-total media silence. $6.06 trillion in assets against $47.78 trillion in liabilities. Include unfunded Social Security and Medicare and total federal promises exceed $136 trillion.
Their frame: divide every number by 100 million. That household earns $52,446 and spends $73,378. Its liabilities amount to $1,361,788 against $60,554 in assets. Uncle Sam is $1.3 million in the hole. The GAO (Government Accountability Office) has declined to certify the books for 29 consecutive years.
Brent Oil Price Forecast
Every new Brent Oil analysis as it publishes, today's technical signal and key levels, live price — on one page.
See all Brent Oil forecastsExceptional US Debt?
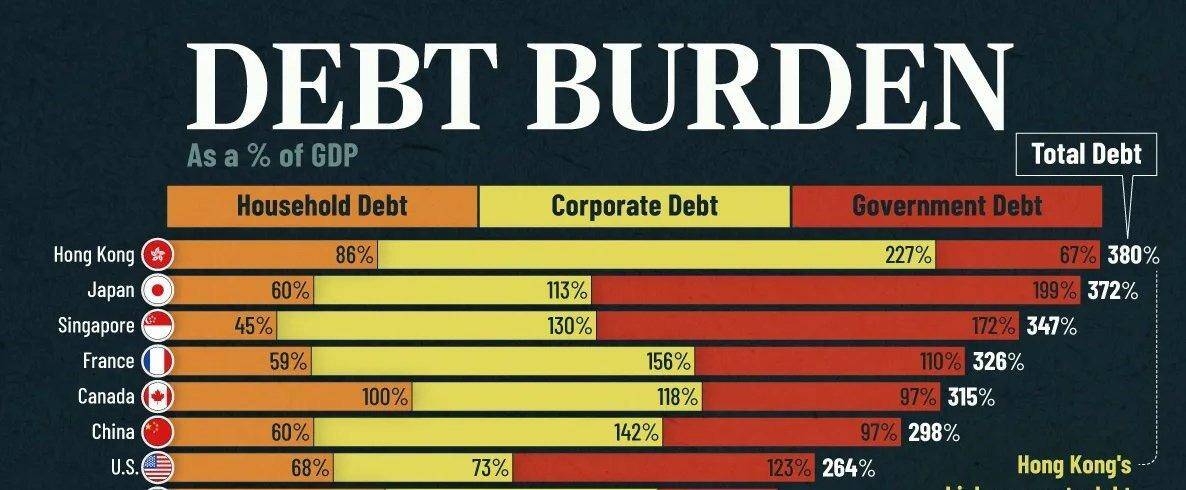
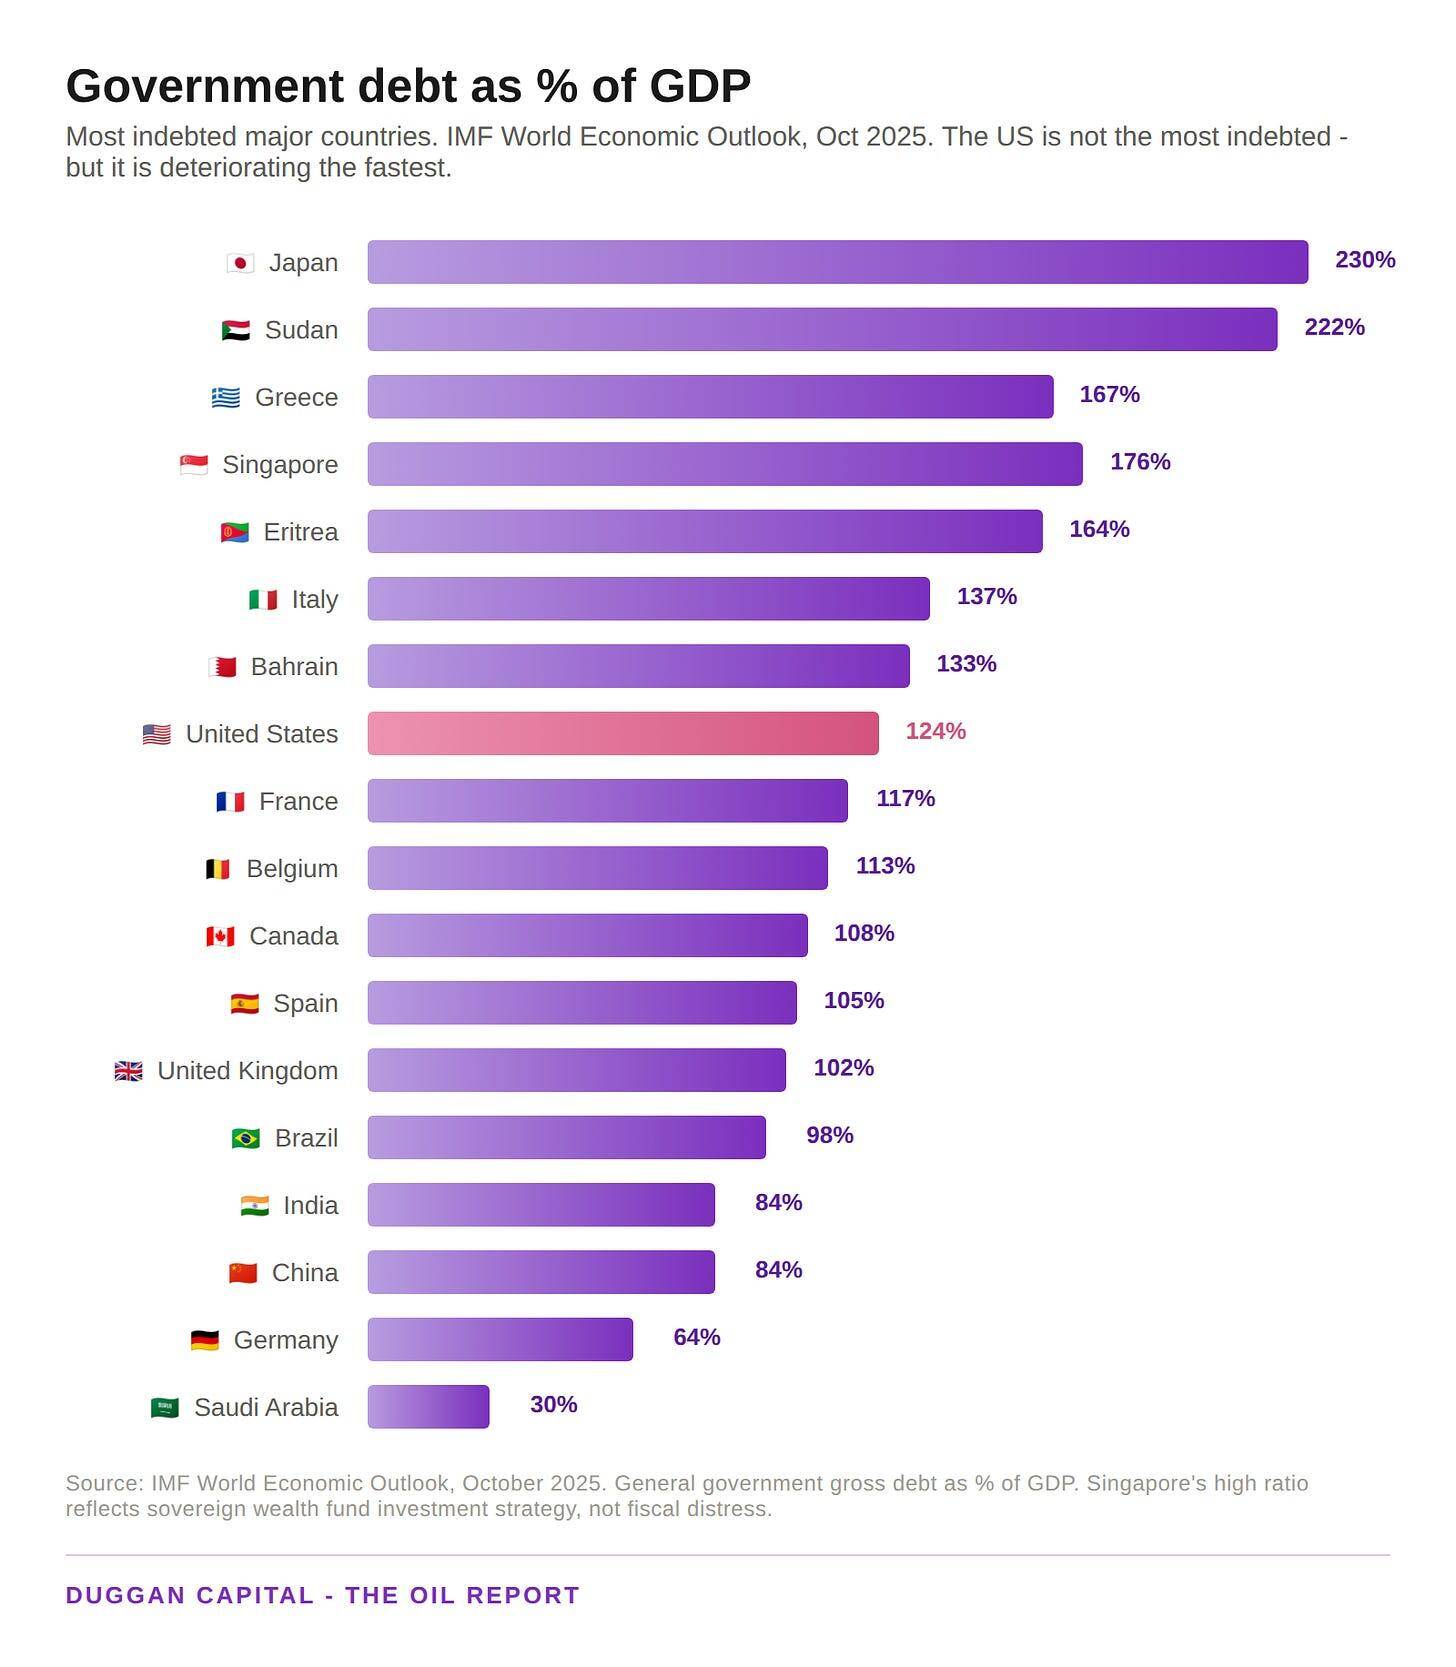
The US total debt-to-GDP ratio at 264% is actually lower than Japan (372%), Hong Kong (380%), or Singapore (347%). The headline debt is not exceptional. What is exceptional is three things. First, the speed. The US is adding debt at roughly 7% of GDP per year, in peacetime, with full employment – faster than almost any developed economy. Second, the hidden tab. That $136 trillion includes Social Security and Medicare promises that sit off the official balance sheet. No other country carries unfunded entitlements at that scale relative to its tax base. Third, the dollar. Japan can carry 199% government debt because almost all of it is held domestically in yen. The US depends on foreign buyers of Treasuries – and those buyers are watching $112 oil, rising inflation, and a war with no exit ramp.
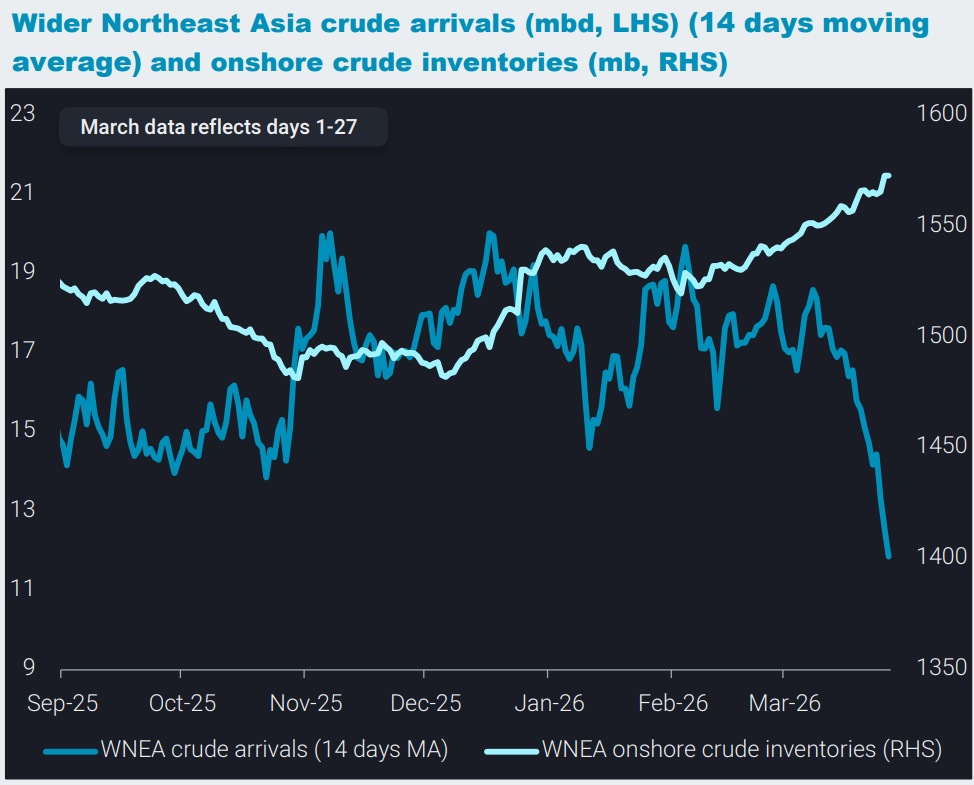
Last Orders From Asia
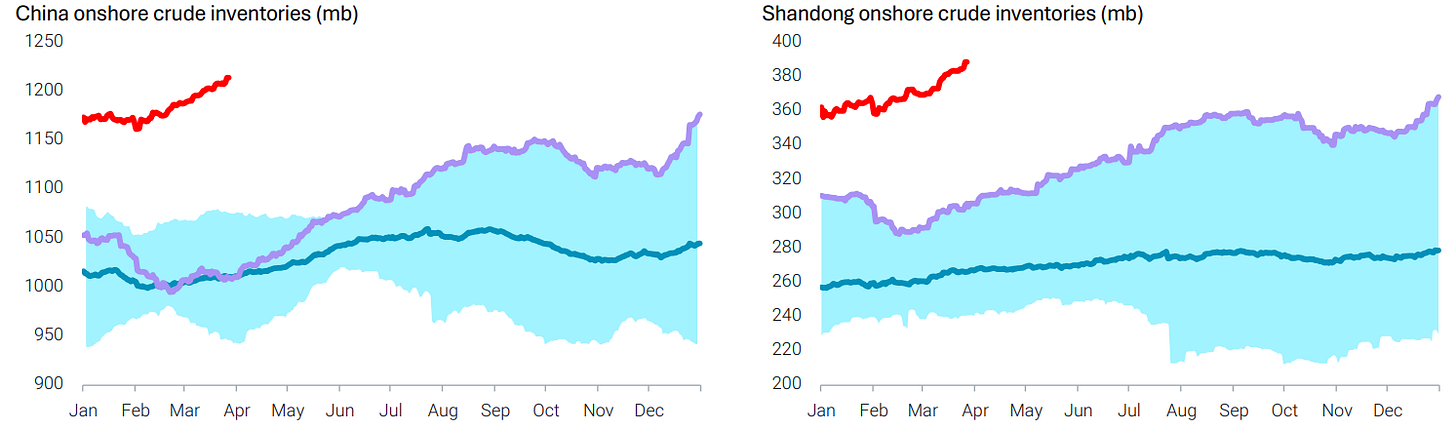
China loading in all they can get as crude arrivals crash.
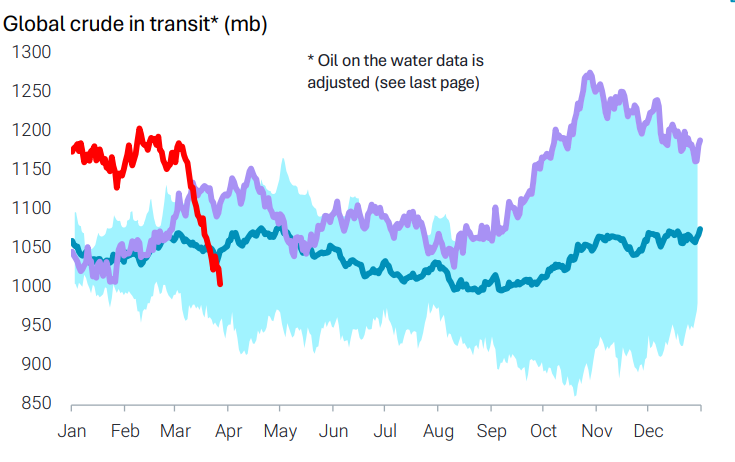
In conclusion, this paints a very stormy next 24 months ahead, and the forward curve is NOT currently pricing the extension to hostilities that are about to unfold. Iran’s battlefield is now not so much physical in the Straits of Hormuz or Bab al-Mandab, it is in the global economic landscape, and they are winning that game. A battlefield of higher oil prices, reduced global shipping logistics and long tail effects that will force central bankers to act just as much as politicians and generals. Rate hikes not cuts boys. Net Net– get me long 1000 contracts of double ply cushion toilet paper at market.
Commitment Of Traders Report
Product: WTI Oil, Symbol: CL.
Report: Disaggregated
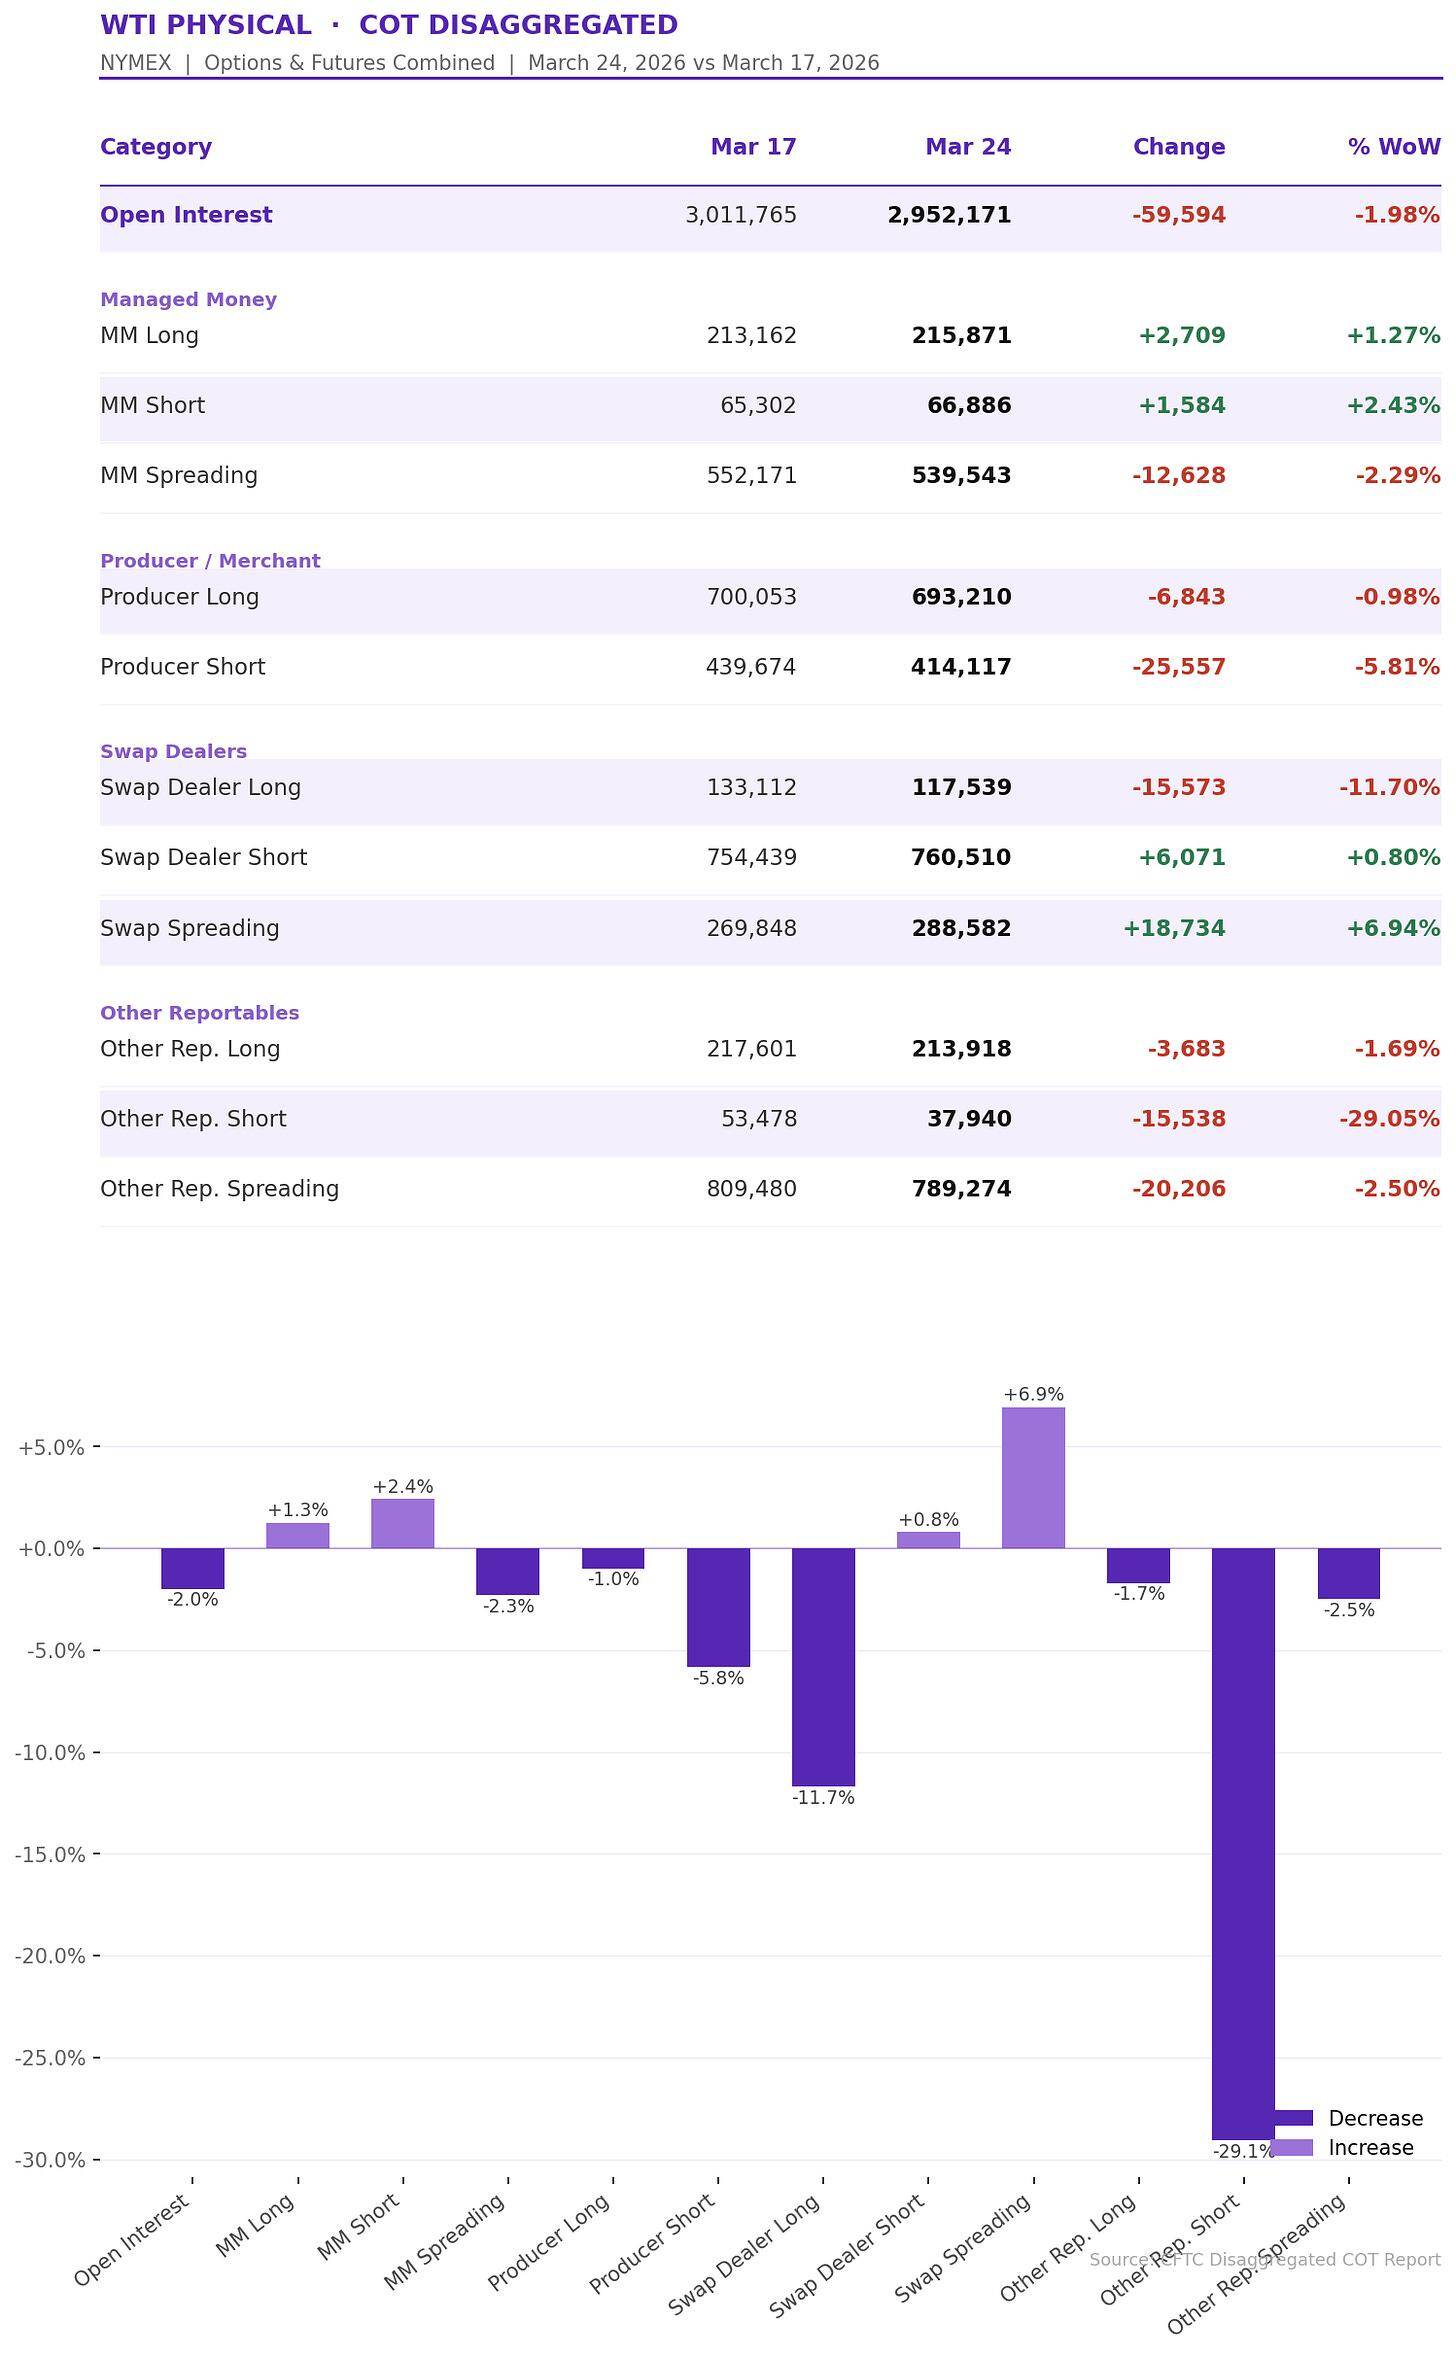
In summary: The market is heavily positioned long with shorts getting lifted. Big change in other reportable here, the ‘catch all’ cohort’. These guys puked a large amount of shorts held -15,538 29% WOW change.
Last week in Brent, Swap dealers shorts moved to an all-time high i.e clients long. On WTI this week last, Swap dealers clients are not letting up, building in WTI a small 0.81% WOW on longs.
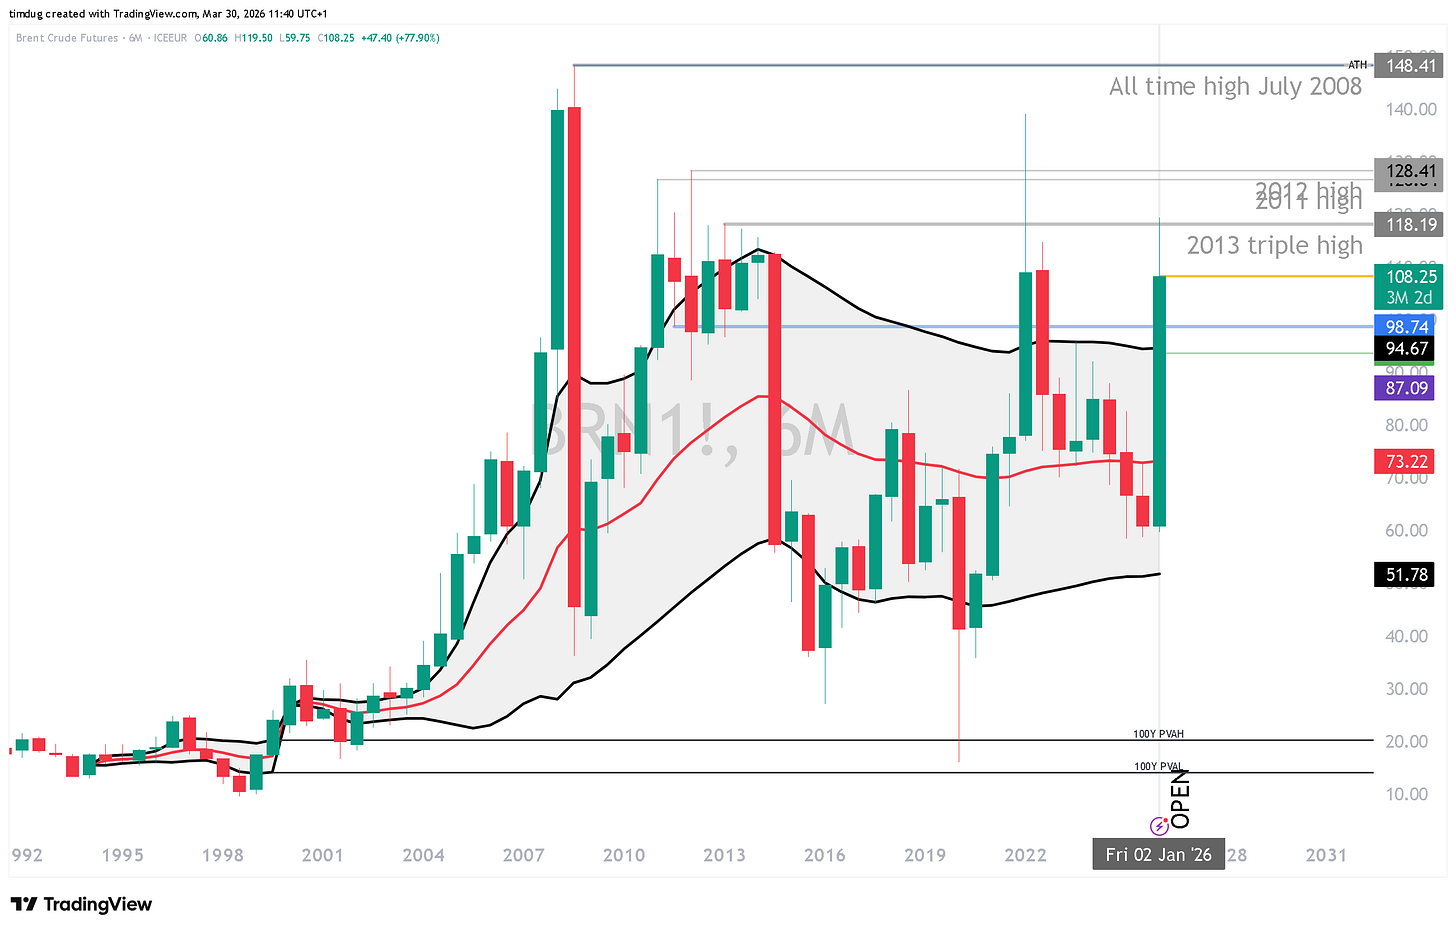
Every now and then I like to look at where is average price on the biggest picture. Here is Ie. Average price paid since 2000. Brent Century VWAP lies at $73.22.
Okay, lets get back to something more short to medium term. I see prices holding firmly as long as hostilities remain at current levels and that Iran DOES NOT engage in any negotiations with the US or emissaries via Pakistan or other. Should this change, we will rewind down as fast as you can say sell. Regarding the short side; last week, I did say that Swap dealers going so long was now putting shorts on my radar. HOWEVER we are nowhere near being active on that trade, it simply means that, should we over stretch from current prices, there may be an opportunity.
We would need to see 1. A light at the end of the war tunnel 2. Swap dealers continuing to push their short length.
For this week, the weekly contextual structure is all important. Should we fail to hold above $106.27s area, there will be selling down to the prior gap area at the least. I do however see it more probable that we test $106.27 and rally.
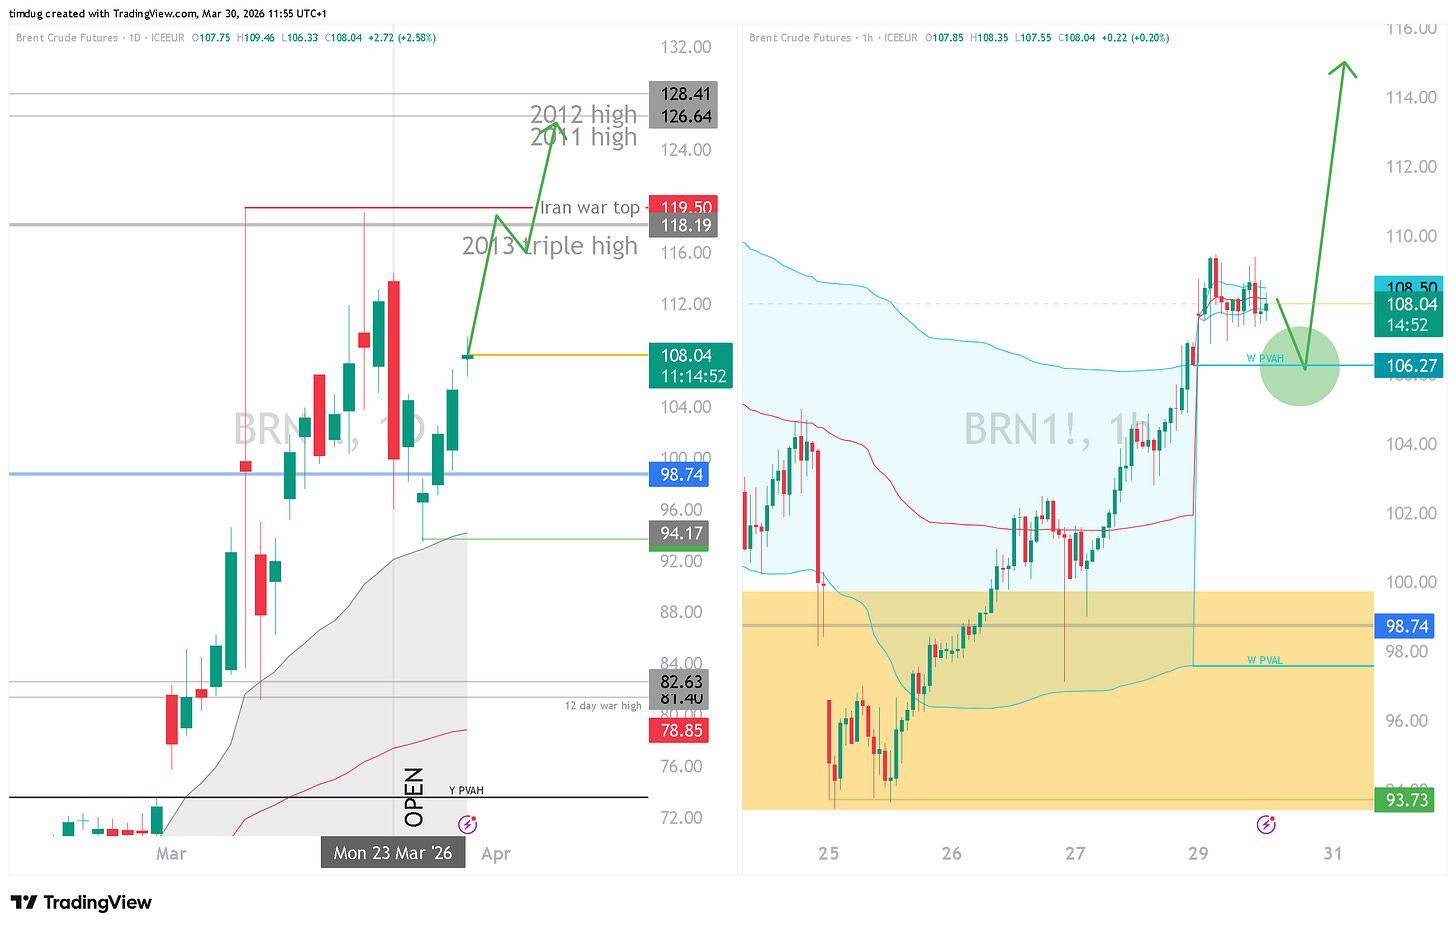
I won’t spend too much time on this as prices and volatility is wild. And as mentioned before, trade hypothesis issued on a Monday 8am can be traded and over with by 10am the same day.
Stay safe out there and Happy Easter.