


Platinum (XPL) prices continue to drop as the U.S. dollar and Treasury yields rally from higher oil prices and persistent inflationary pressures. The metal is now trading at a key support level and is looking for the next direction. This article presents the macro drivers, the technical range of platinum, the gold to platinum ratio and the key risk levels that may decide whether prices rebound or extend the correction.
Fed Risk and Oil Inflation Weigh on Platinum Prices
Platinum remains under pressure as precious metals markets slide ahead of U.S. nonfarm payrolls data. The latest market shift reflects investors’ fears that the Fed will keep interest rates higher for longer. This keeps the pressure on the precious metals. That is important because the price of platinum is not only influenced by industrial demand but it is also impacted by the same drivers as gold (XAU). These drivers include the U.S. dollar, the U.S. Treasury yield and Fed policy expectations.
Oil Surge Keeps Inflation and Rate Risks Elevated
Inflation and interest rates represent the most significant short-term risks. Energy markets are trading at a higher level due to the Middle East tensions which keep inflation fears alive. The chart below shows that the 1-year inflation expectations have increased after the US-Iran conflict. The expectations increased to 4.8% in May 2026.
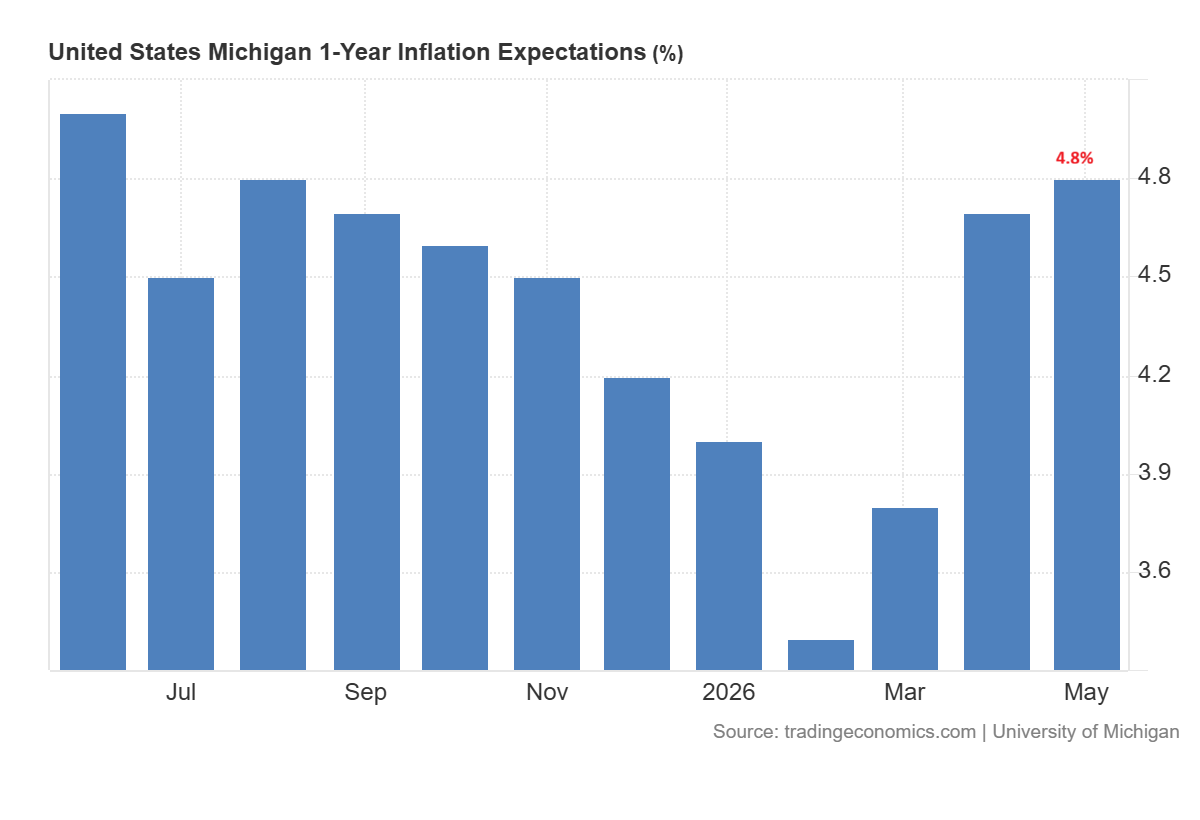
The higher inflation provides Federal Reserve less room to cut interest rates. If the inflation keeps increasing, it may further increase the likelihood of rate hikes. This is bad news for platinum as a stronger dollar keeps the precious metals under pressure.
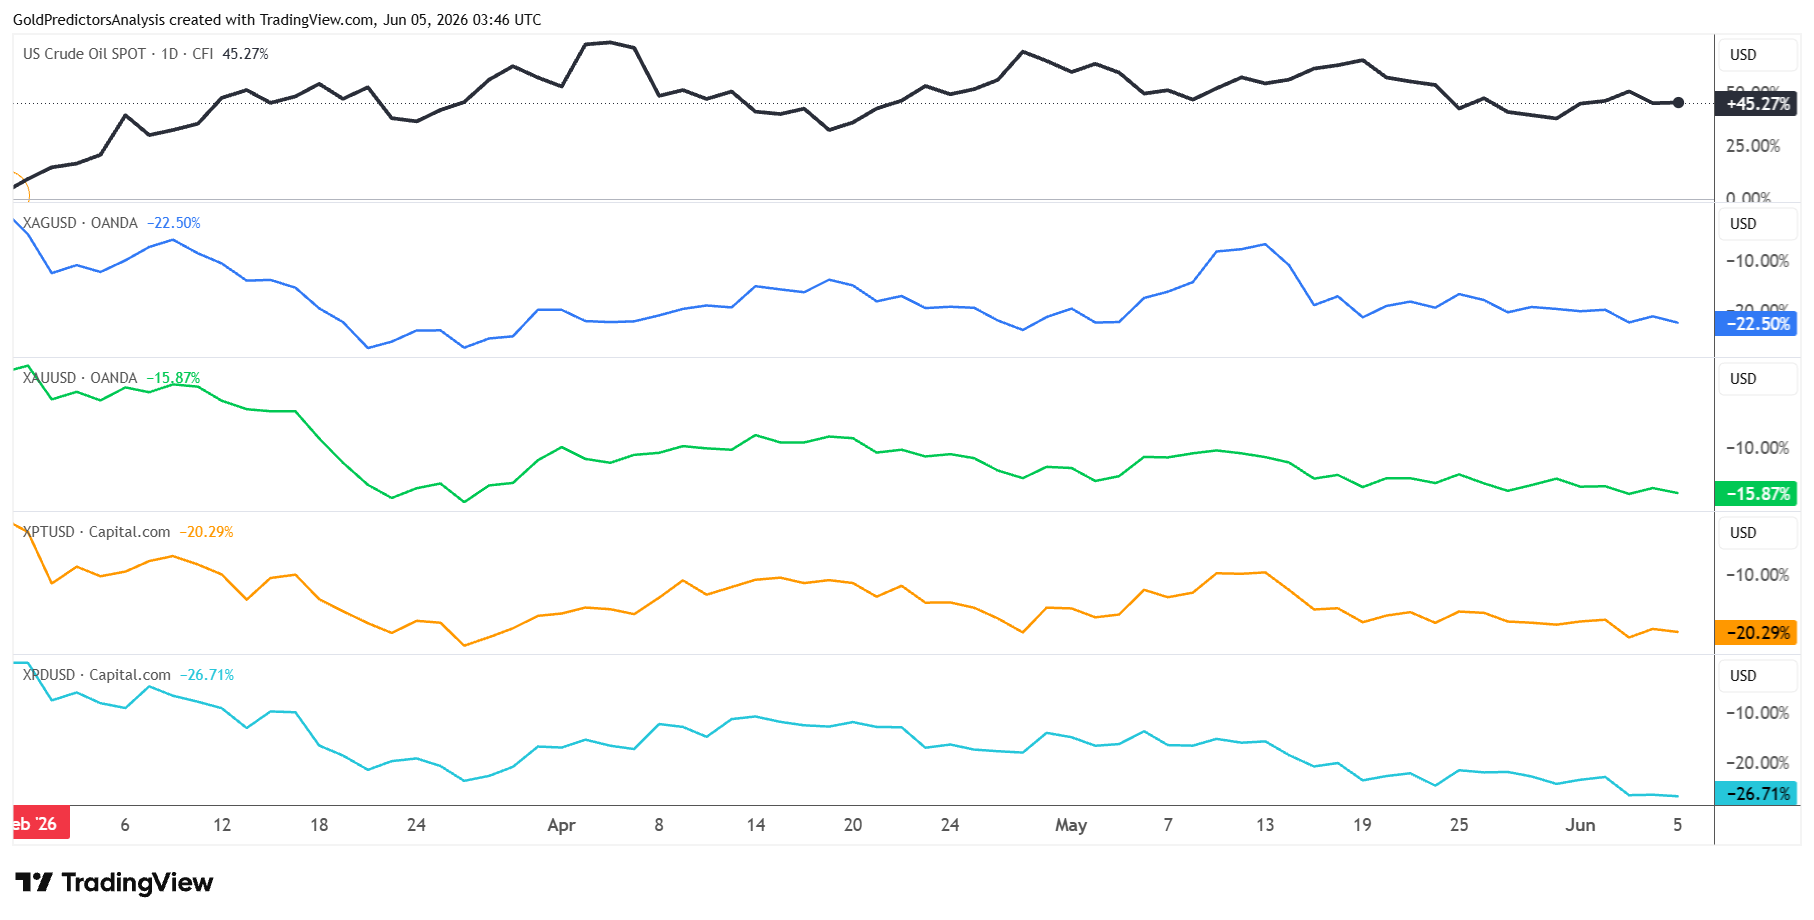
The chart below shows that the WTI crude oil price has surged by 45.27% since the start of U.S.-Iran war. This surge in oil prices has pushed down the gold price by 15.87% and silver (XAG) by 22.50%.
But palladium (XPD) dropped the most by 26.71% and platinum dropped by 20.29%. It is observed that platinum and palladium were affected by the surge in oil prices due to the U.S.-Iran war.
War Risk and Industrial Demand Send Mixed Signals
The U.S.-Iran conflict also sends a mixed message to the platinum price. Geopolitical risk can support precious metals since investors seek protection from it.
But a higher oil price can boost inflationary expectations and support the dollar. This effect is more significant in the case of platinum. Oil was poised to rally further on the week after the U.S.-Iran peace negotiations stalled and after concerns about supply disruptions grew.
Despite these mixed signals, the medium-term outlook is not that bearish. Industrial demand for auto catalysts, hydrogen technology, chemicals and refining will support Platinum. It also introduces an additional supply risk since production continues to be centered on South Africa, Zimbabwe and Russia.
These factors would need to align to give the market more reason to believe in a stronger recovery that requires both lower yields and a weaker dollar. For the time being, it seems that platinum trades like a pressured precious metal rather than an industrial metal.
Platinum Technical Support Comes Under Pressure
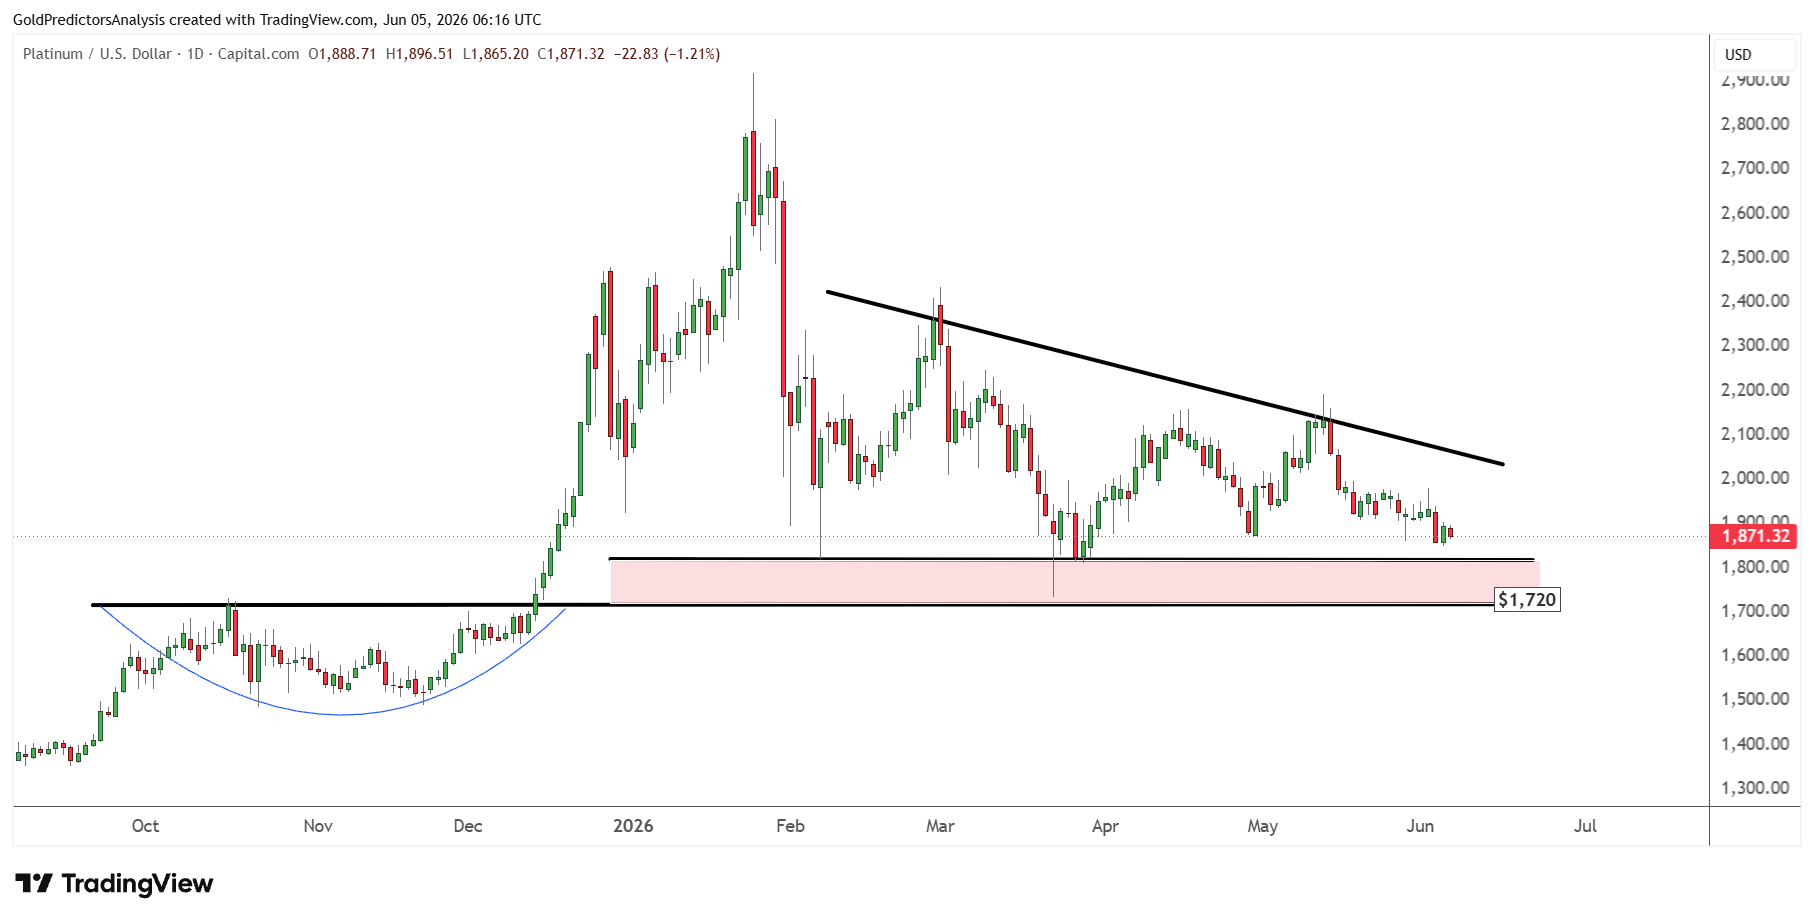
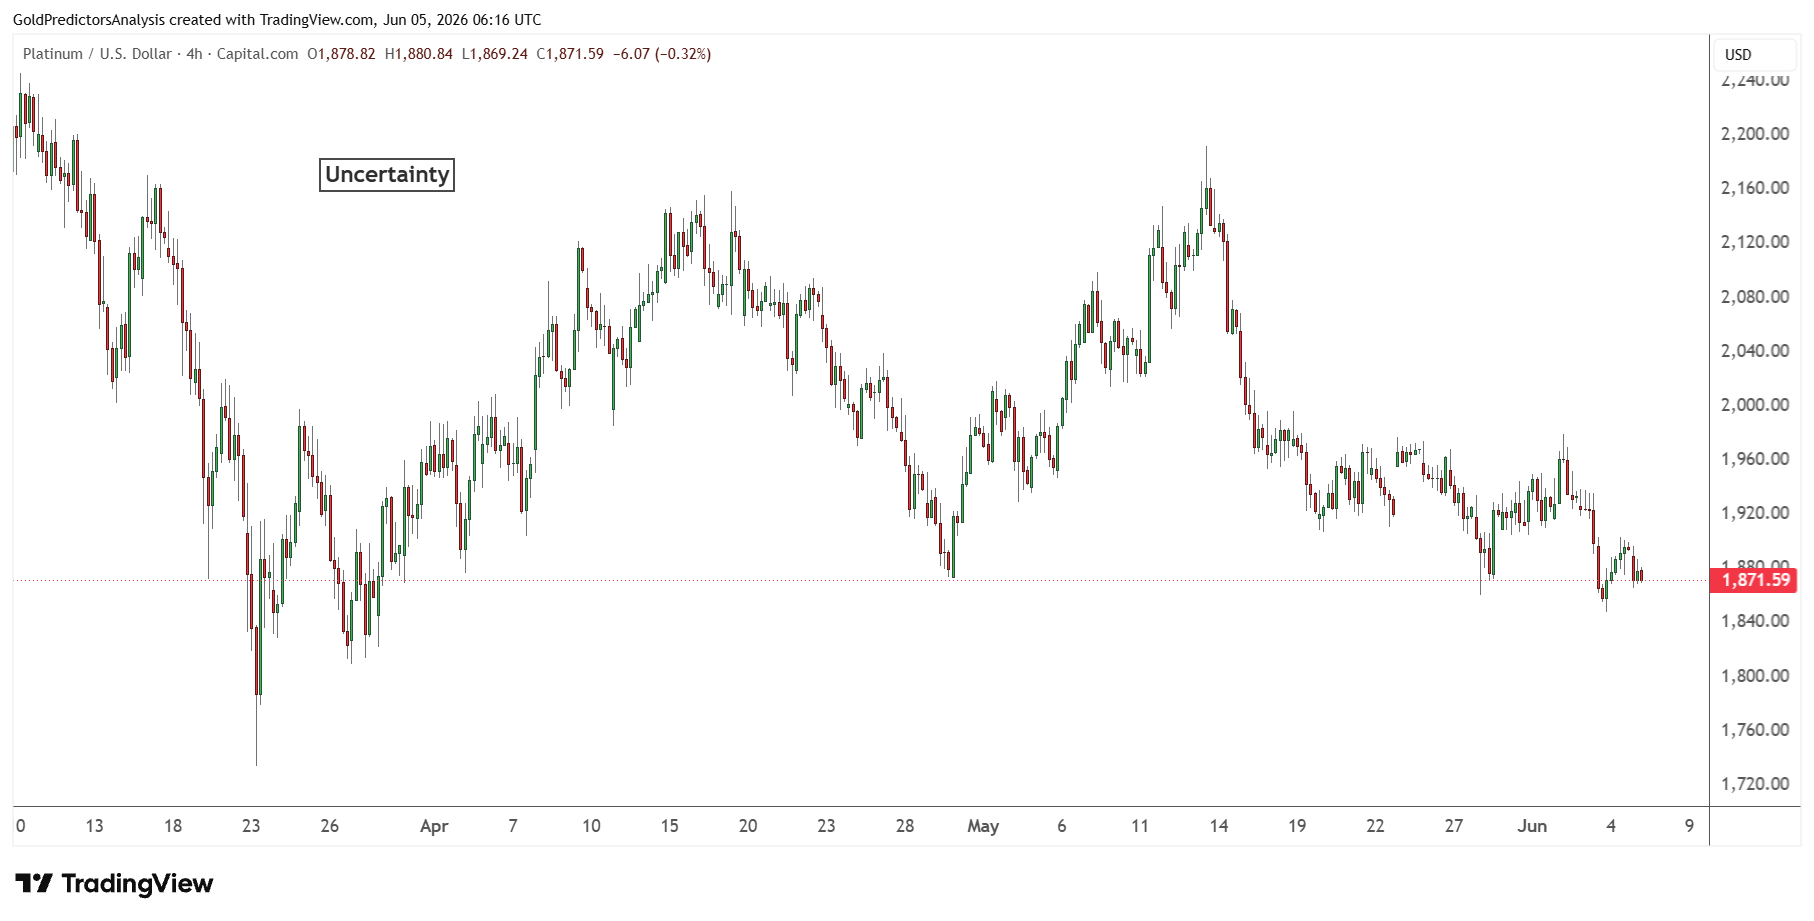
Platinum prices have been compressing in a tight range, like other precious metals, during the past few days. The chart below shows that platinum prices have been dropping since the peak of March 2026 and compressing within the triangle pattern between $1,700 and $2,000.
The price continues to drop and shows no clear direction. A break of this triangle pattern will likely define the next move in the platinum market but the short-term outlook remains negative.
The 4-hour chart for platinum also shows no clear direction in the short term.
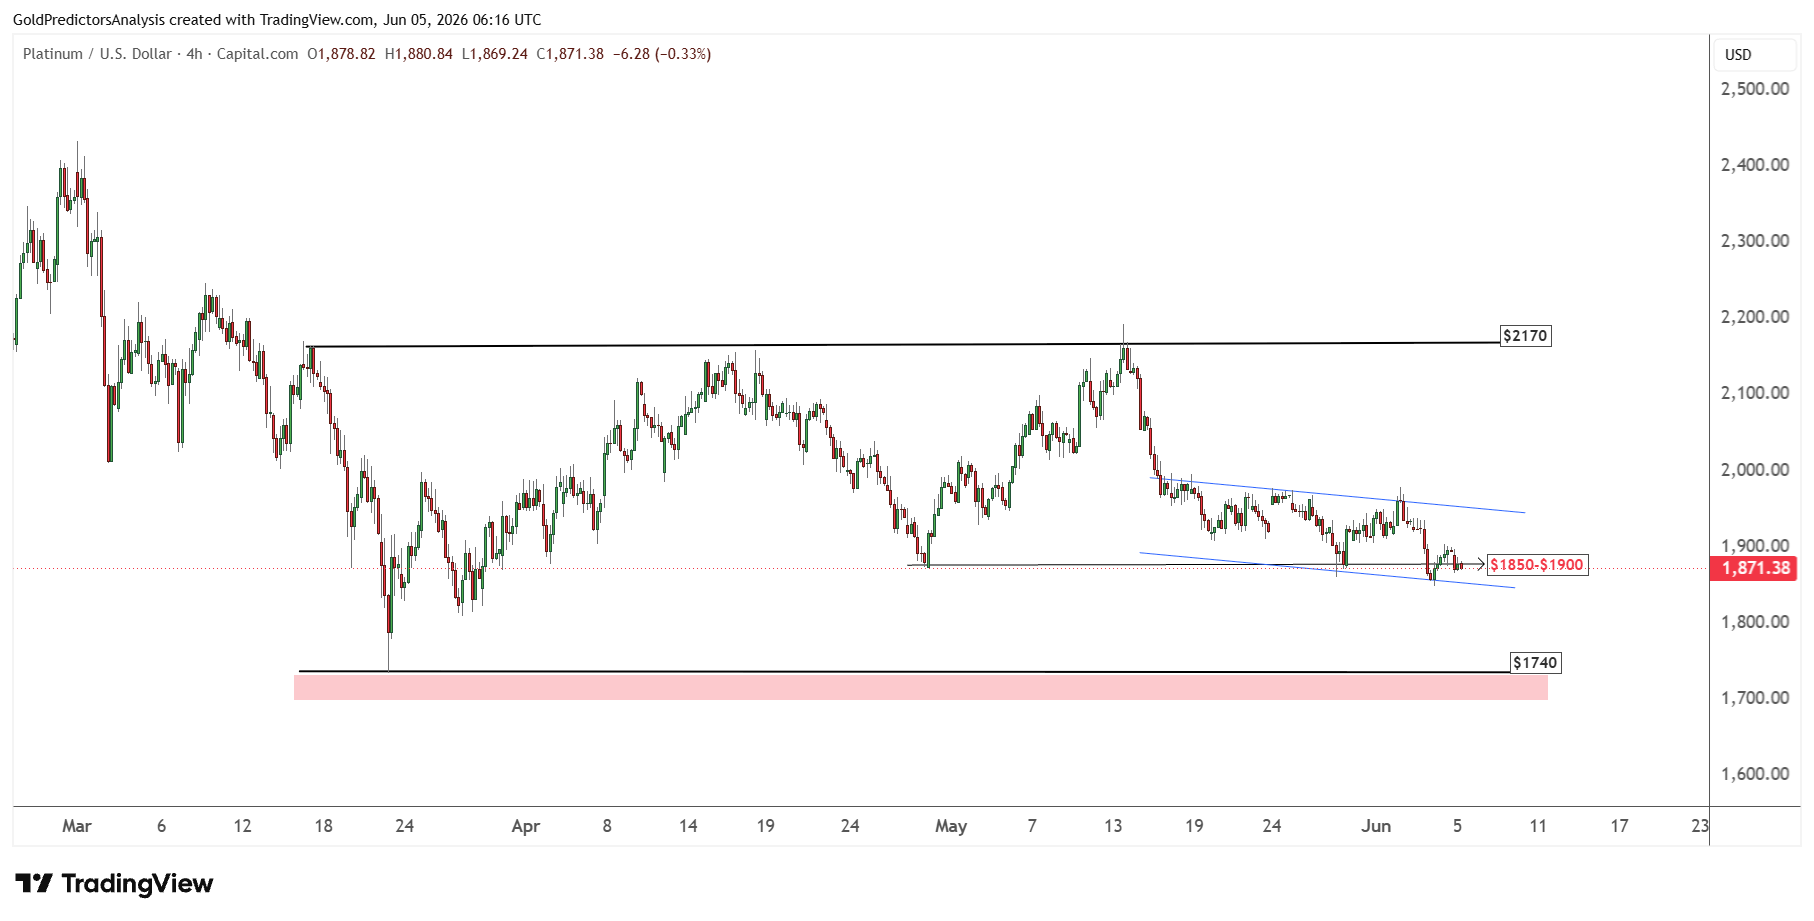
The descending channel from 18 May 2026 shows that the price rebound on 3 June 2026 was very weak.
Overall, the $1,850 to $1,900 region remains the first support in platinum. Prices have been consolidating at this support for the past 2 days. A break below this support will push the price to $1,740. Any recovery above the $2,000 level will likely push platinum prices towards $2,170.
The chart below further shows that a break below the $1,850-$1,900 range will push prices to $1,650-$1,750. This region is highlighted in blue and indicates that any correction towards this zone will likely offer strong recovery and push prices back higher.
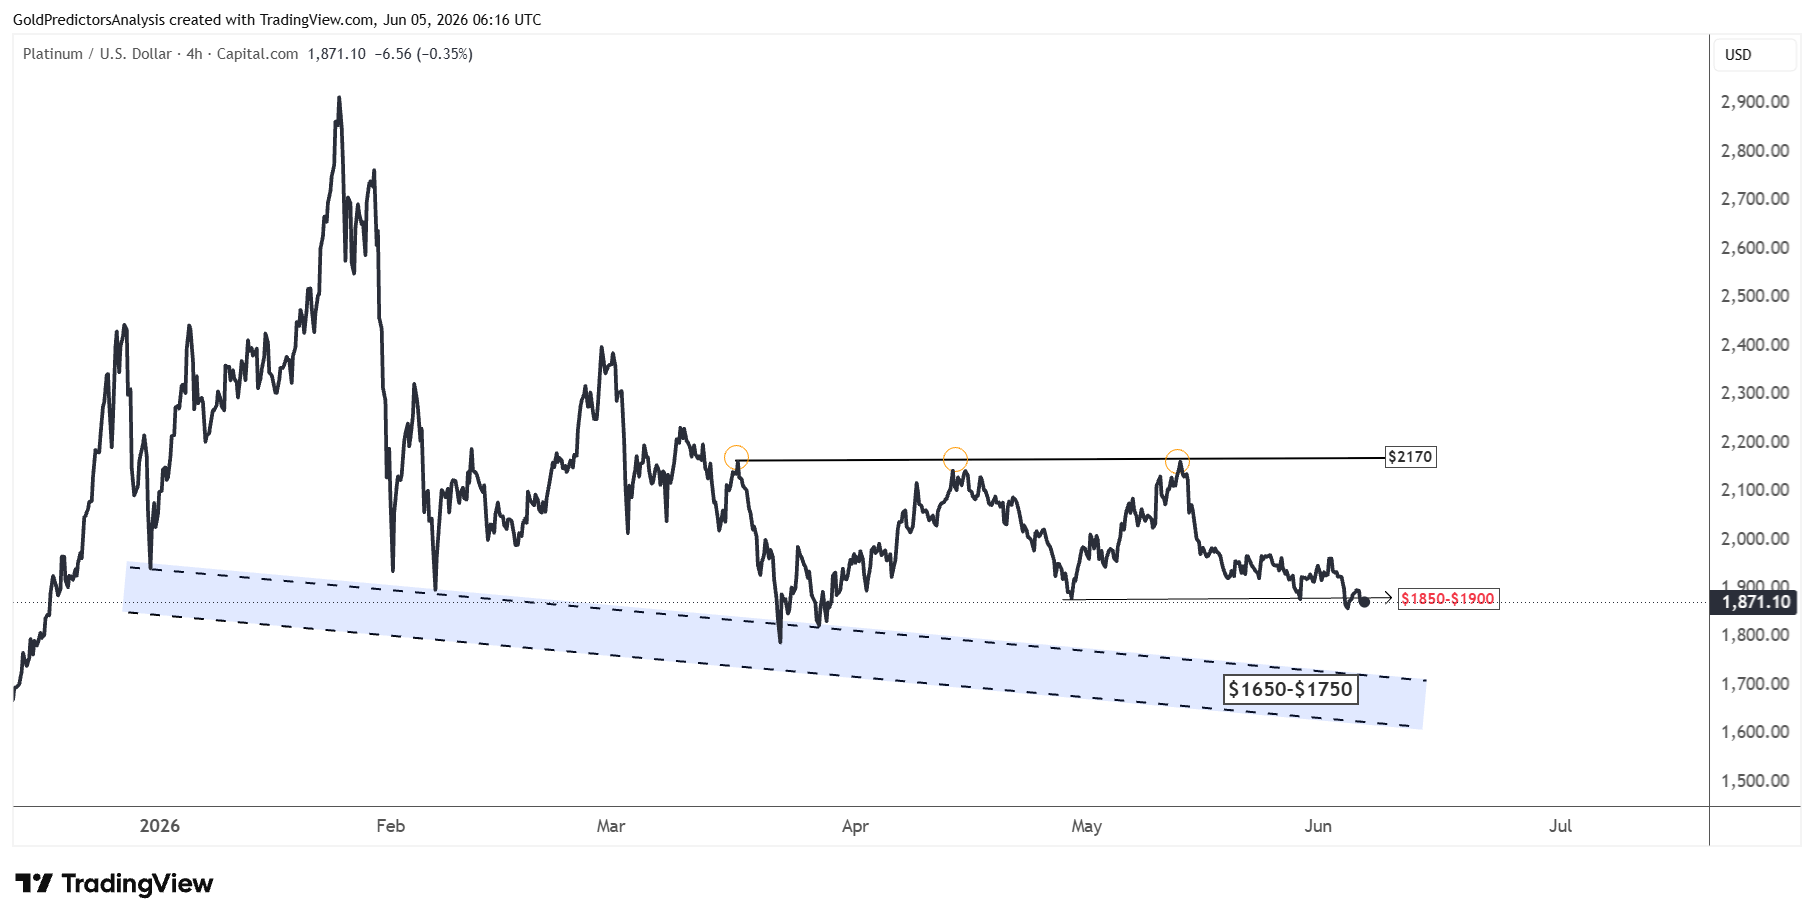
A break below $1,700 will likely push platinum prices towards the long-term buying area of the $1,200 region as discussed previously.
Gold-to-Platinum Ratio Signals Weakness
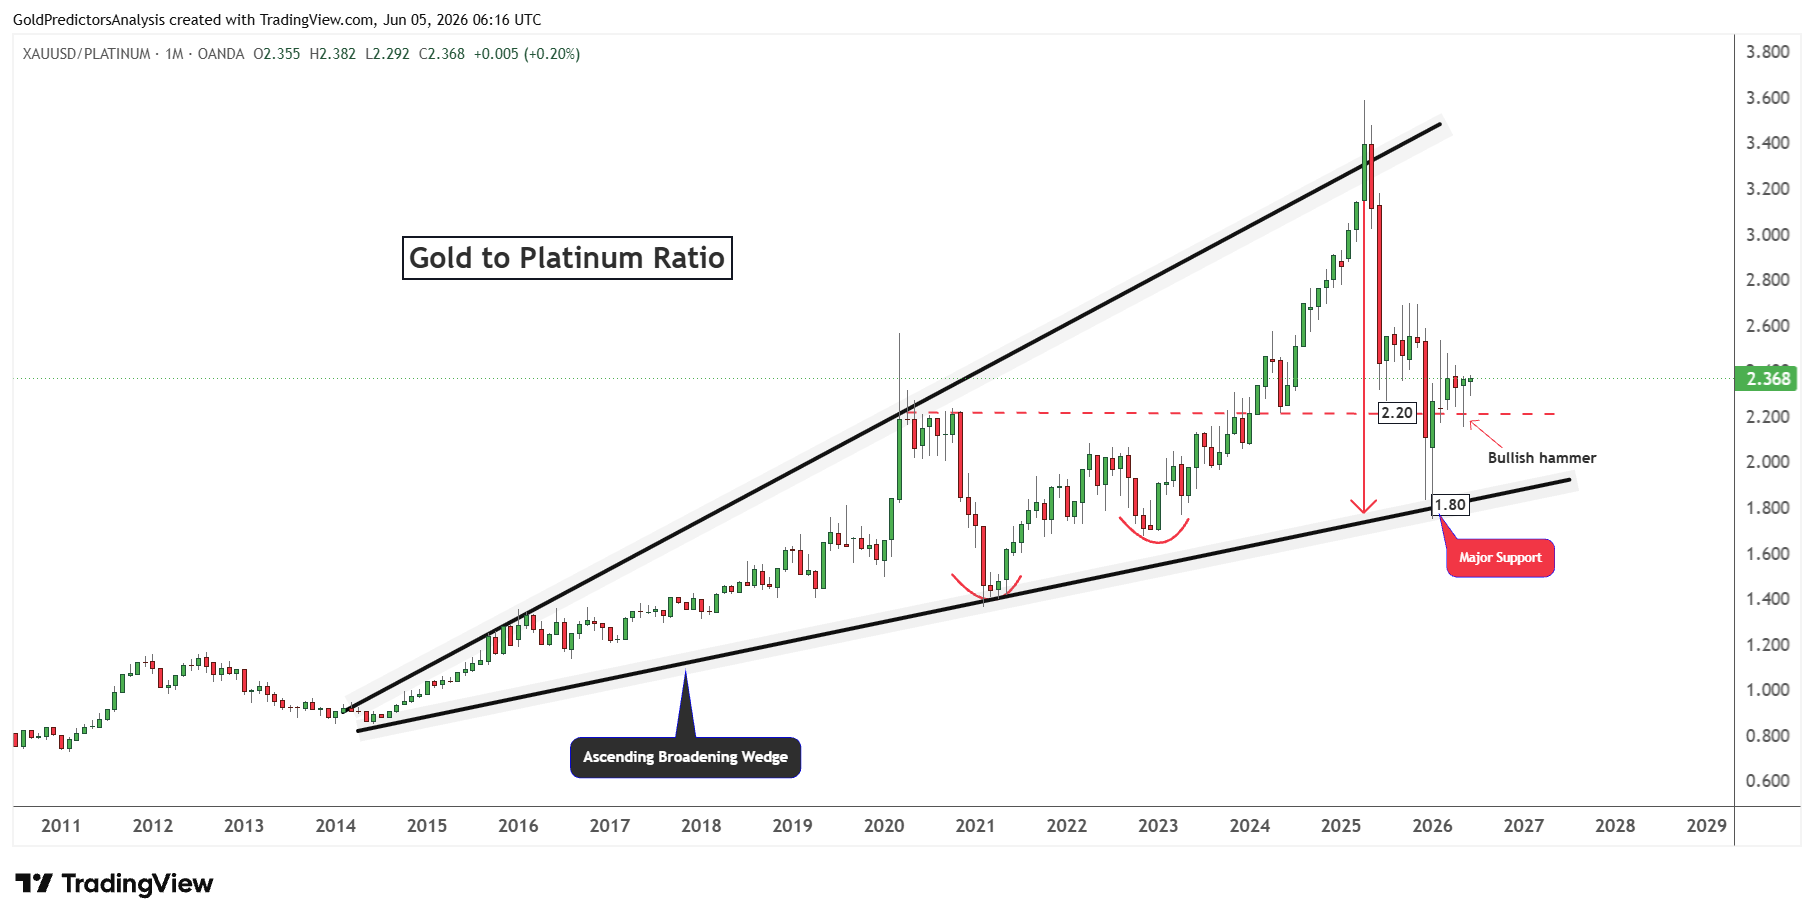
The weakness in the platinum market is further confirmed using the gold-to-platinum ratio, which formed a strong long-term bottom at the support of 1.80 in January 2026. This rebound came when platinum prices surged in January 2026 to mark a record high.
This support of 1.80 comes from the ascending broadening wedge pattern. The chart shows that the bullish hammer candle above this support will likely push the ratio to higher levels towards the 3-4 level. The emergence of the ascending broadening wedge pattern suggests strong volatility in the gold and platinum markets during the next few months and years.
It is interesting to note that the ratio did not close below 2.20 in January 2026 and recovered higher. A drop in May 2026 also formed support at the 2.20 level and produced another bullish hammer candle. The formation of a bullish hammer candle at the 2.20 support suggests that gold prices will likely outperform platinum in the next few months.
This means platinum might be weaker than gold, but this weakness will likely push prices towards the long-term support zones.
U.S. Dollar Rebound Remains the Key Risk
The primary risk in the platinum market comes from the U.S.-Iran war, which is likely to keep U.S. Treasury yields higher. Positive U.S. Treasury yields are turning the U.S. dollar index toward a positive trajectory and pushing inflation expectations higher.
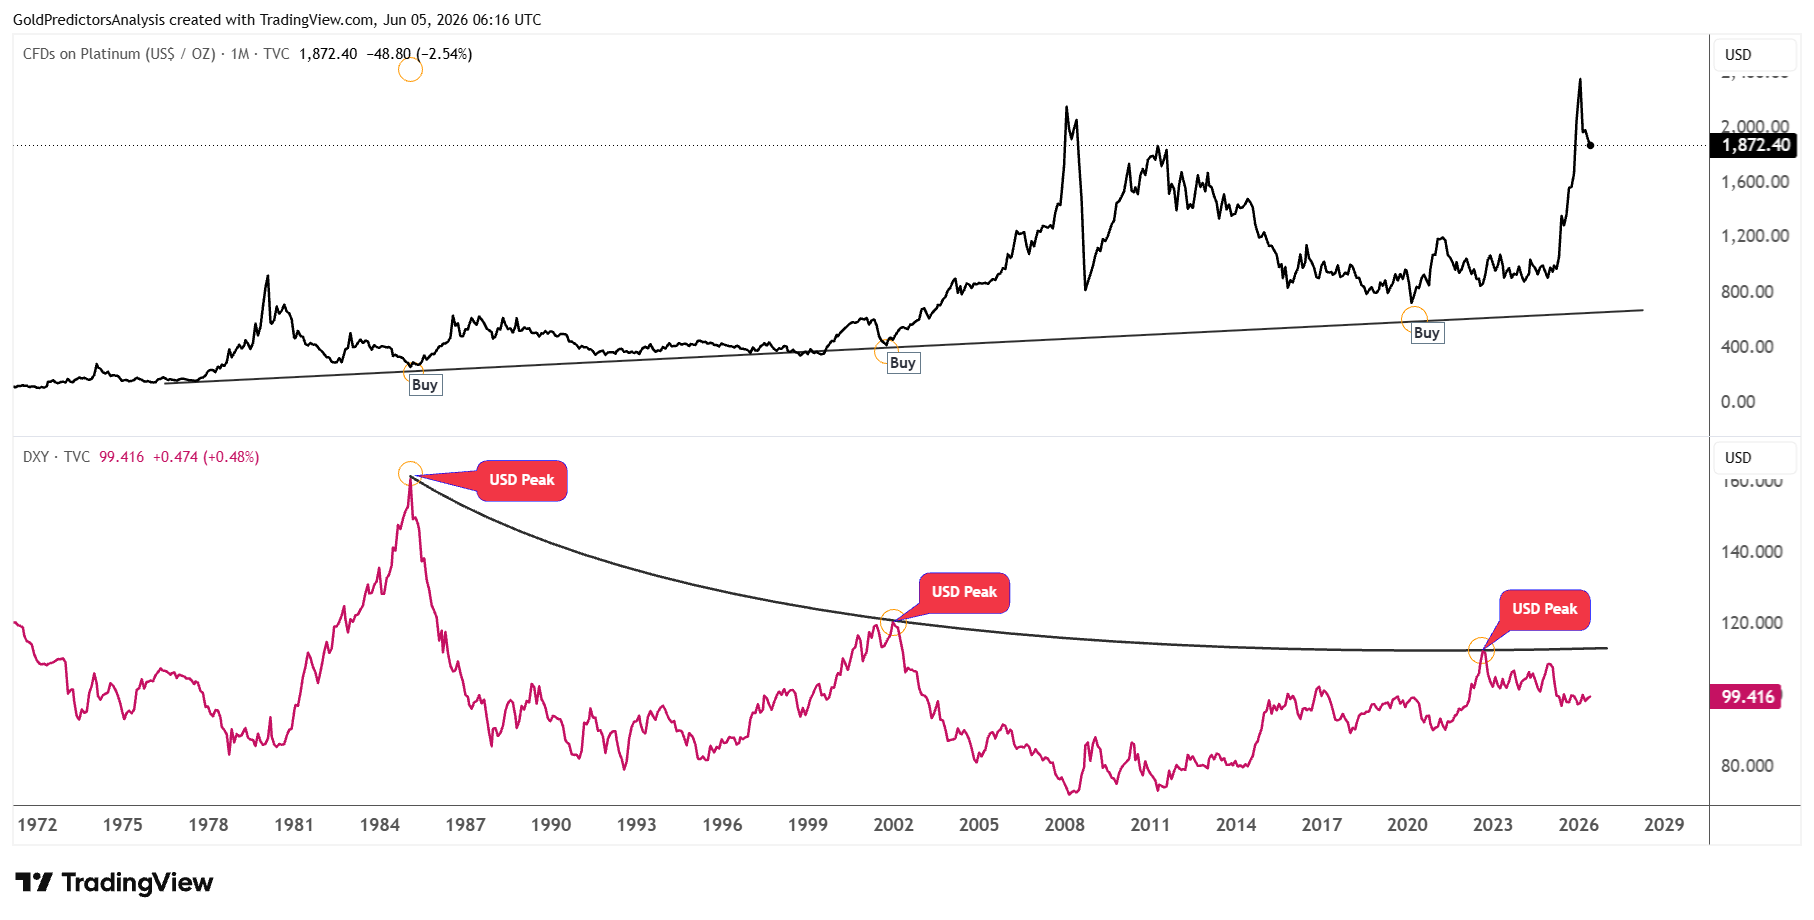
These higher inflation expectations are likely to impact the Fed’s decision to keep interest rates higher for longer. The chart below shows that the U.S. dollar index and platinum have an inverse correlation. A peak in the U.S. dollar index produced a buy signal in the platinum market in 1985, 2001 and 2020.
Therefore, if the U.S. dollar index continues to rebound from this support area, platinum prices will likely push lower towards the support region. But the overall trend in the U.S. dollar index remains bearish. This bearish trend in the US dollar will likely support platinum prices during the next phase of growth.
Bottom Line
Platinum prices remain under bearish pressure on broader precious metals weakness as the US dollar and Treasury yields are supported by higher oil prices, persistent inflation and Fed risks. This keeps the platinum price in a technical range. A break below the $1,850-$1,900 region could open the door toward the $1,650-$1,750 support zone. But a break above $2,000 would improve the short term outlook and push the price to the $2,170 resistance level.
The auto catalysts, hydrogen technology, chemicals, refining demand and supply risks in South Africa, Zimbabwe and Russia provide support for platinum. But the gold-to-platinum ratio indicates that gold might outperform platinum for the next few months. To resume the next rally in platinum prices, the US dollar index must break below 96, and US Treasury yields must stop rising above 4.5%.
If US-Iran tensions are not resolved and the US dollar index breaks above 100.50, it will pressure the platinum prices to break below $1,700. A break below $1,700 will open the door for a stronger drop to $1,200, where the long-term buyers will enter the market.