


Platinum (XPL) prices remain under pressure as the strong U.S. jobs data pushed Treasury yields and the U.S. dollar higher. The metal has now reached a critical support area as the broader precious metals market moves through a sharp correction. In my view, platinum may remain weak in the short term before a stronger bottom form. But the long term price structure is supported by tight supply, industrial demand and the bullish price structures. This article examines the macro pressure, key platinum support levels, ratio signals and the price zones that may decide the next major move.
Fed Rate Risk and Dollar Strength Pressure Platinum Price
Platinum prices dropped after the US jobs data, which put pressure on all precious metals. The strong jobs data indicate that the Fed may keep interest rates higher for longer. This pushed the US Treasury yields and the US dollar index higher and introduced selling pressure in the platinum price. The move is driven by the short-term pressure at macro level and not a clear demise of the longer-term platinum story.
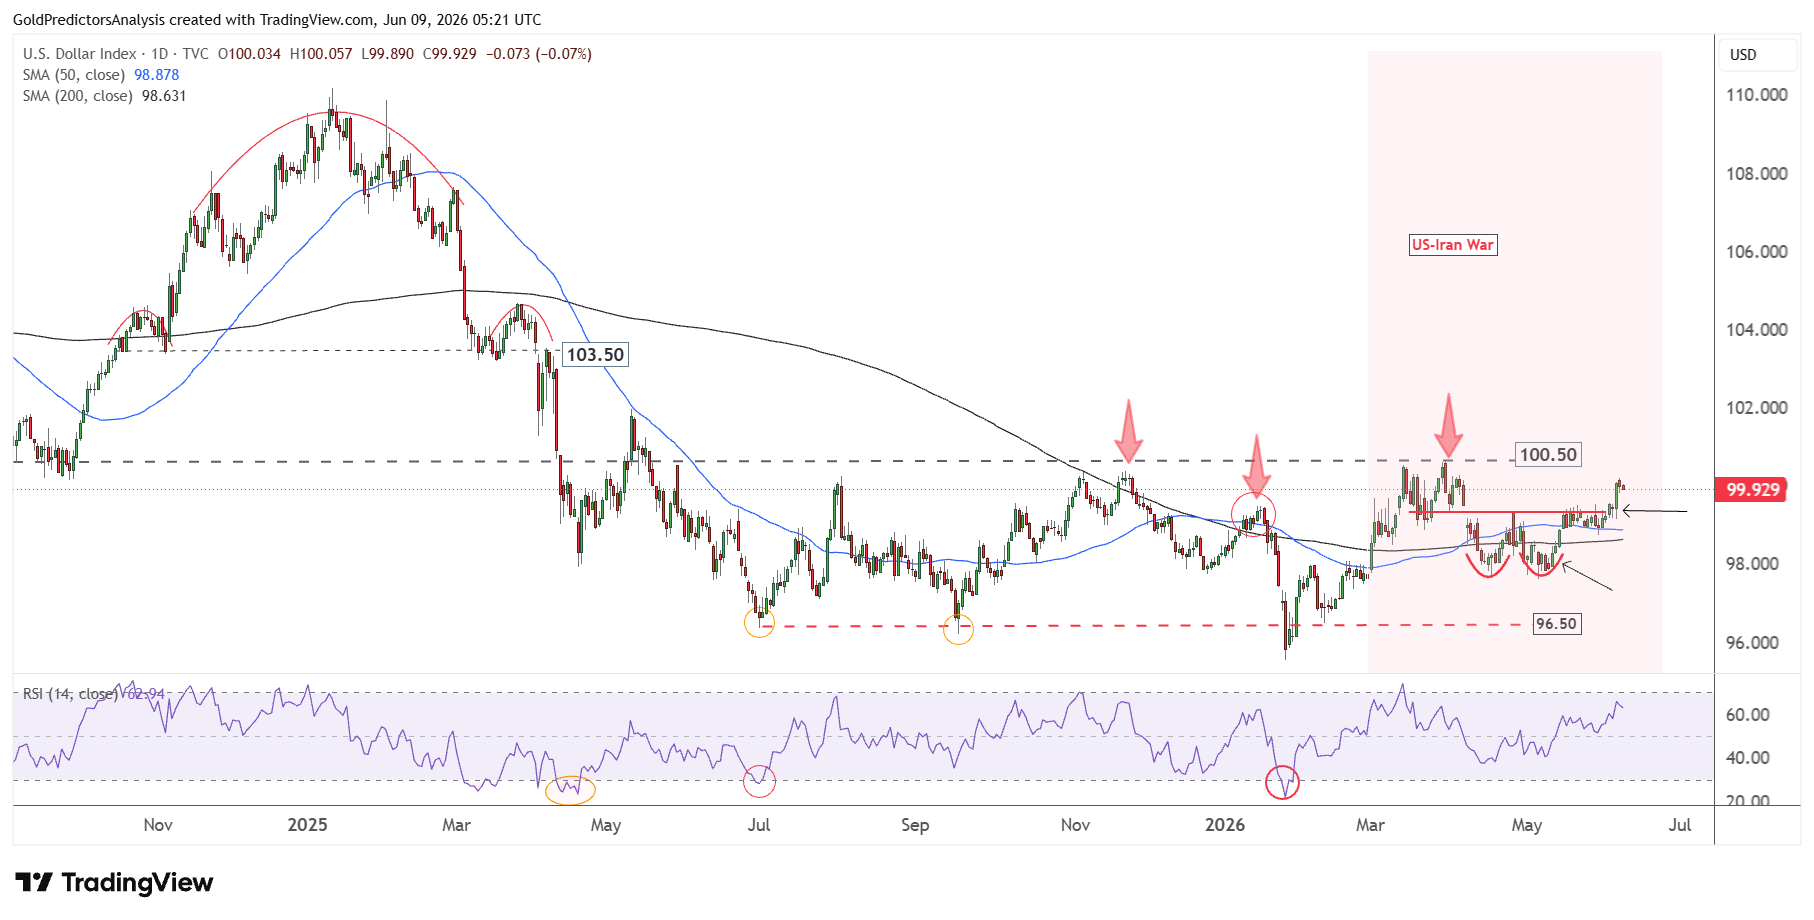
The chart below shows that the US dollar index broke 99.40 after forming a double bottom pattern, which keeps the short-term strength in the US dollar index.
The overall trend in the platinum group metals could continue higher after this pullback. Platinum has outperformed gold last year as investors began to reprice it after several years of relative weakness. The metal showed strength in 2025 which indicates that the recent correction may be part of the cooling phase before the next bull run.
The main reason for the support in platinum prices is the tight supply. Platinum remains a scarce metal, and the market suffers a supply shortage. Prices can bounce back rapidly from selloffs driven by macro factors after a period of restricted supply and strong demand. This supply problem helps establish a better medium term support for platinum than some industrial metals.
The automotive industry also has a positive influence on the outlook. Platinum continues to be used in catalytic converters, emission control systems and fuel-cell technology. There is also a boost in investor interest because platinum is less abundant than gold and remains tied to the growth in industry. Therefore, jobs data, yields and the US dollar come into play in the short term to slow the rally. But this slowdown does not destroy the long-term bullish picture.
Platinum Correction Tests Long-Term Bullish Structure
Platinum Breakout Supports Long-Term Bullish Outlook
The long-term outlook for platinum remains strongly bullish, as seen in the quarterly chart below. It is observed that this bullish price structure in platinum was formed by the double bottom pattern in 1982 and 1985, followed by strong consolidation until 2001.
A strong breakout in 2002 triggered a surge in platinum prices, marking a record high at $2,299 in 2008. After the sharp drop in 2008, platinum prices consolidated to form an inverted head and shoulders pattern from 2015 to 2025. Then, platinum prices broke out in Q1 2025 at the $1,200 area. After this breakout, platinum surged to mark a new record high in January 2026 at $2,919. After this peak, the price triggered a strong correction.
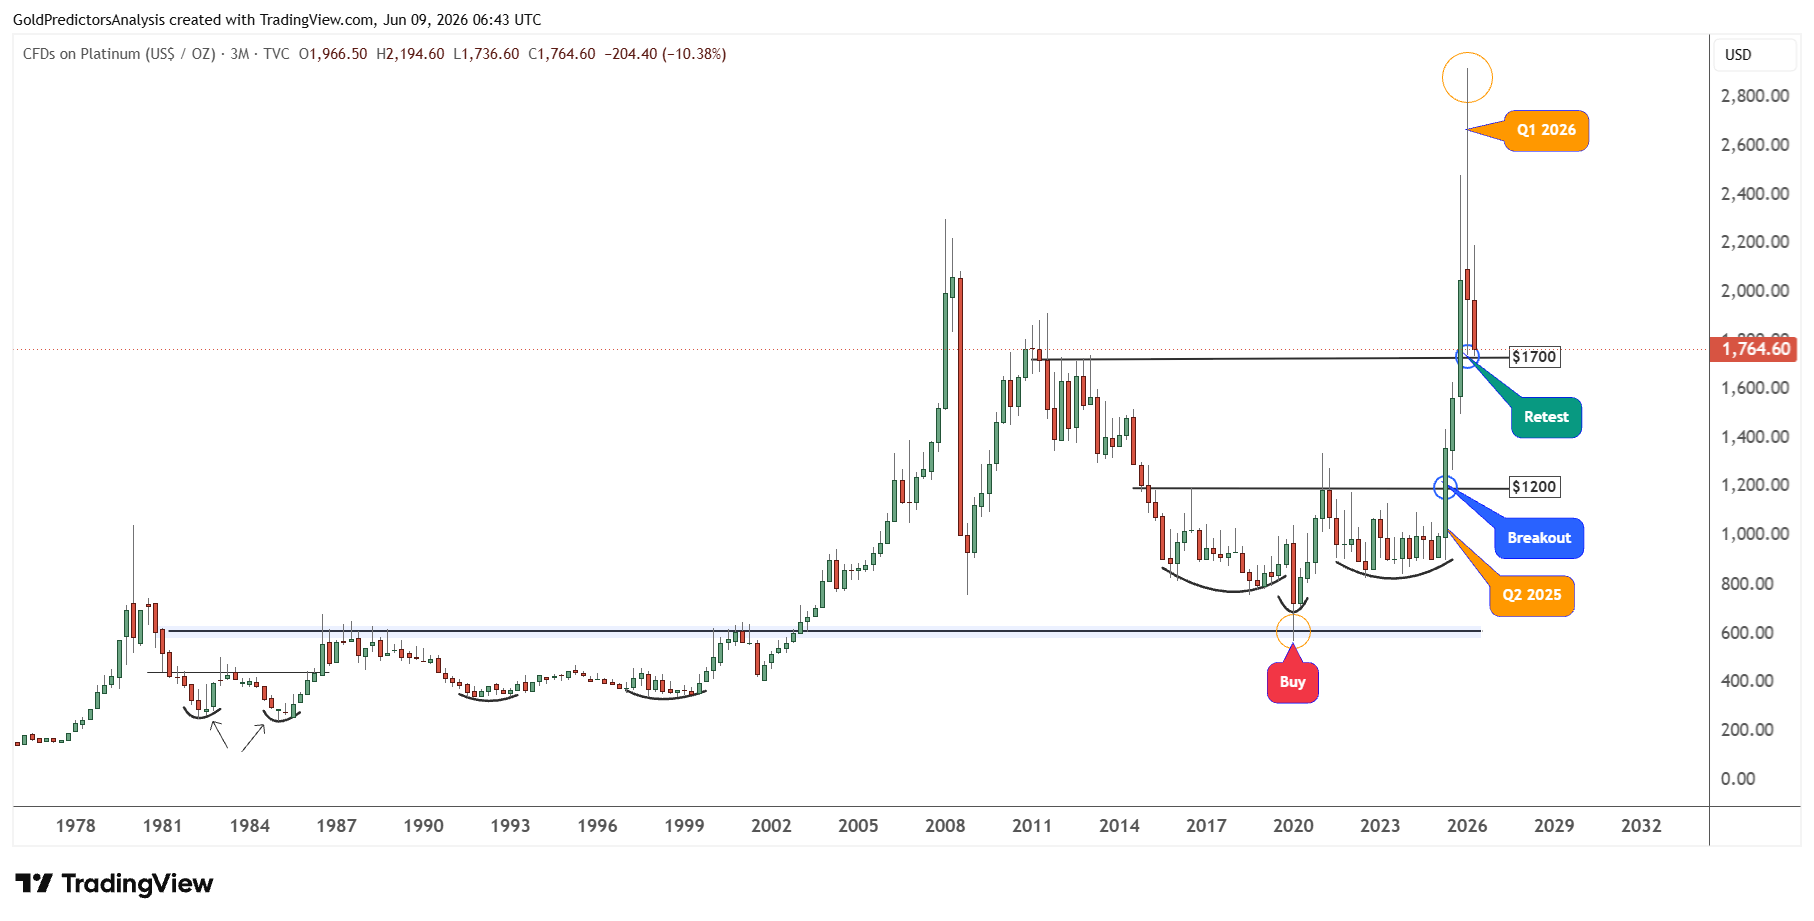
The corrections in platinum prices in the 1980s and 2008 indicate that the market has a highly volatile nature. Therefore, a correction of 50% is considered normal. After marking a record high in Q1 2026, platinum prices already dropped toward the first support zone of the $1,700 area in Q2.
Based on this structure, platinum prices remain strongly bullish. But the correction may also break lower if the month of June closes below $1,700. This negative close may produce a quarterly candle below $1,700. This breakdown would indicate further downside toward the $1,200 region.
Despite this strong volatility and drop in platinum prices, the price structure since the 1980s has remained bullish. This bullish structure suggests that the market will likely turn higher once this correction is complete.
Key Platinum Support Levels to Watch
To further understand the bullish price structure in platinum, the monthly chart below shows that the peak formed just above the long-term resistance of $2,300. This is normally a type of bubble that occurred above $2,300. But the price continues to drop after this resistance toward the main support region of $1,700 to $1,900.
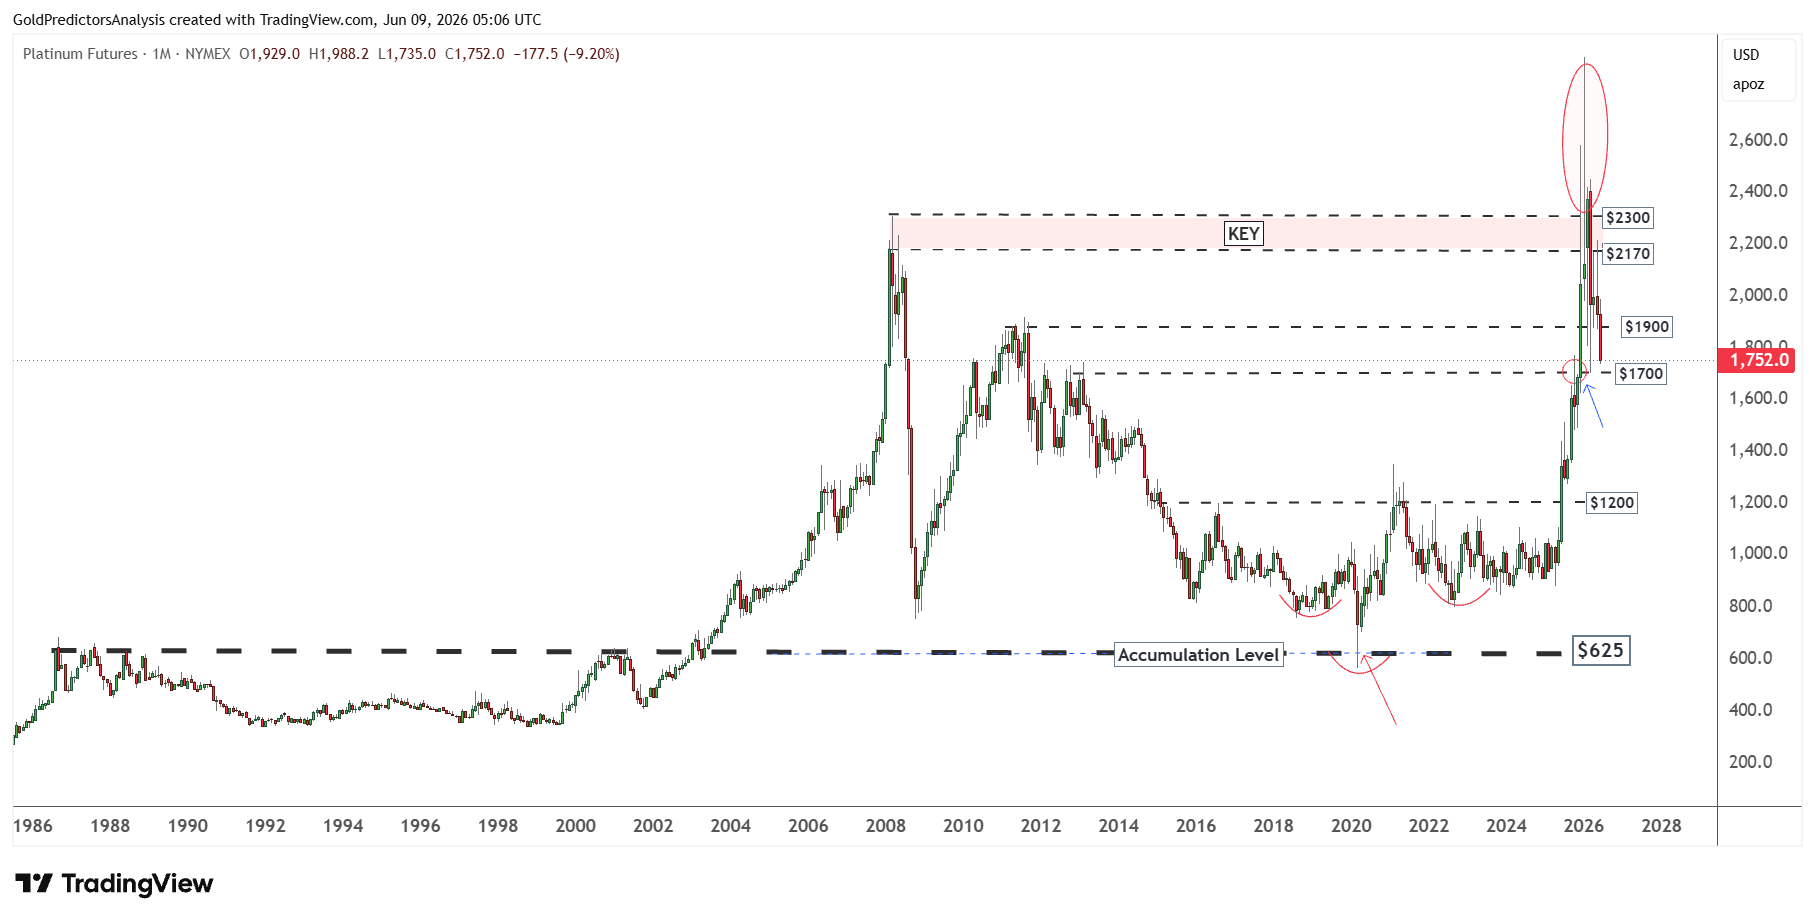
The closer view of this chart shows that $1,700 support corresponds to the highs of October 2012 and February 2013. A break below $1,700 will likely push platinum prices toward the next support of $1,530, which is the high of August 2013.
If platinum prices fail to hold the support at $1,530, then the next support will likely be toward the $1,350 and $1,200 region.
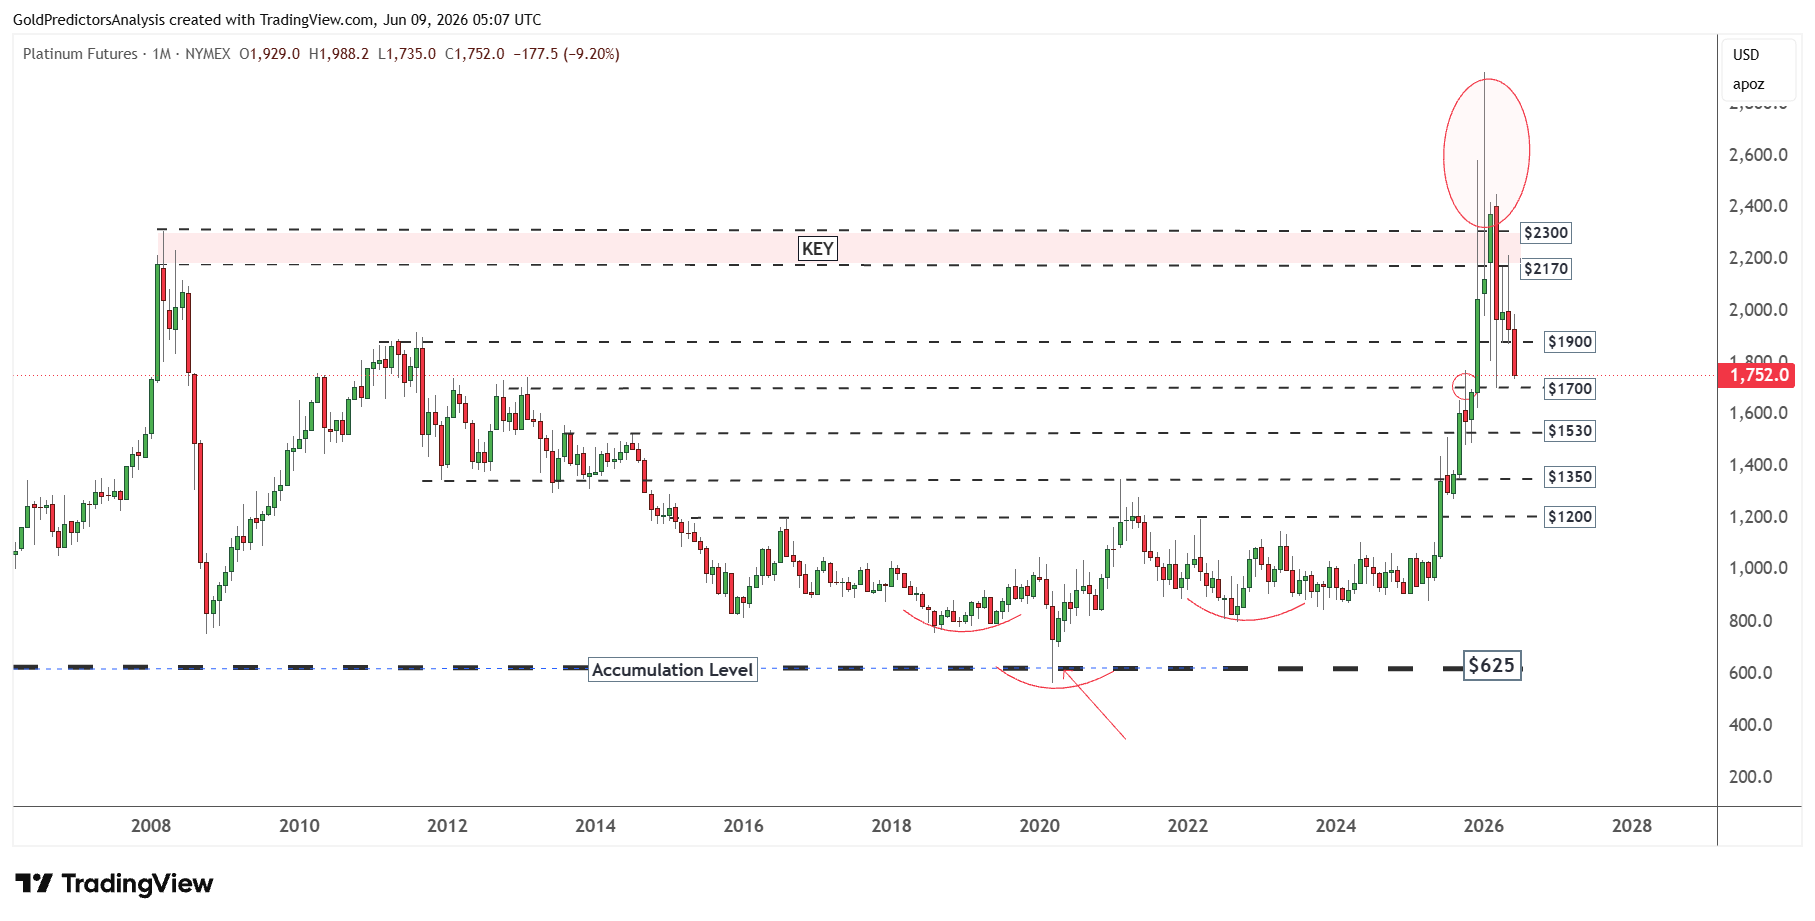
But I do not expect platinum prices to break below $1,200 during this correction. The prices will likely reverse higher back toward the record level once this correction is over. In my opinion, platinum prices must find support within the next few months and trigger a bottoming pattern to confirm the next rally.
Platinum Short-Term: $1,700 Support Comes Into Focus
The short-term structure also shows platinum prices in correction mode. The strong drop from January 2026 has pushed prices toward $1,700 in March. The rebound from the March low failed to push prices above $2,120. This failure led to another fall in platinum prices.
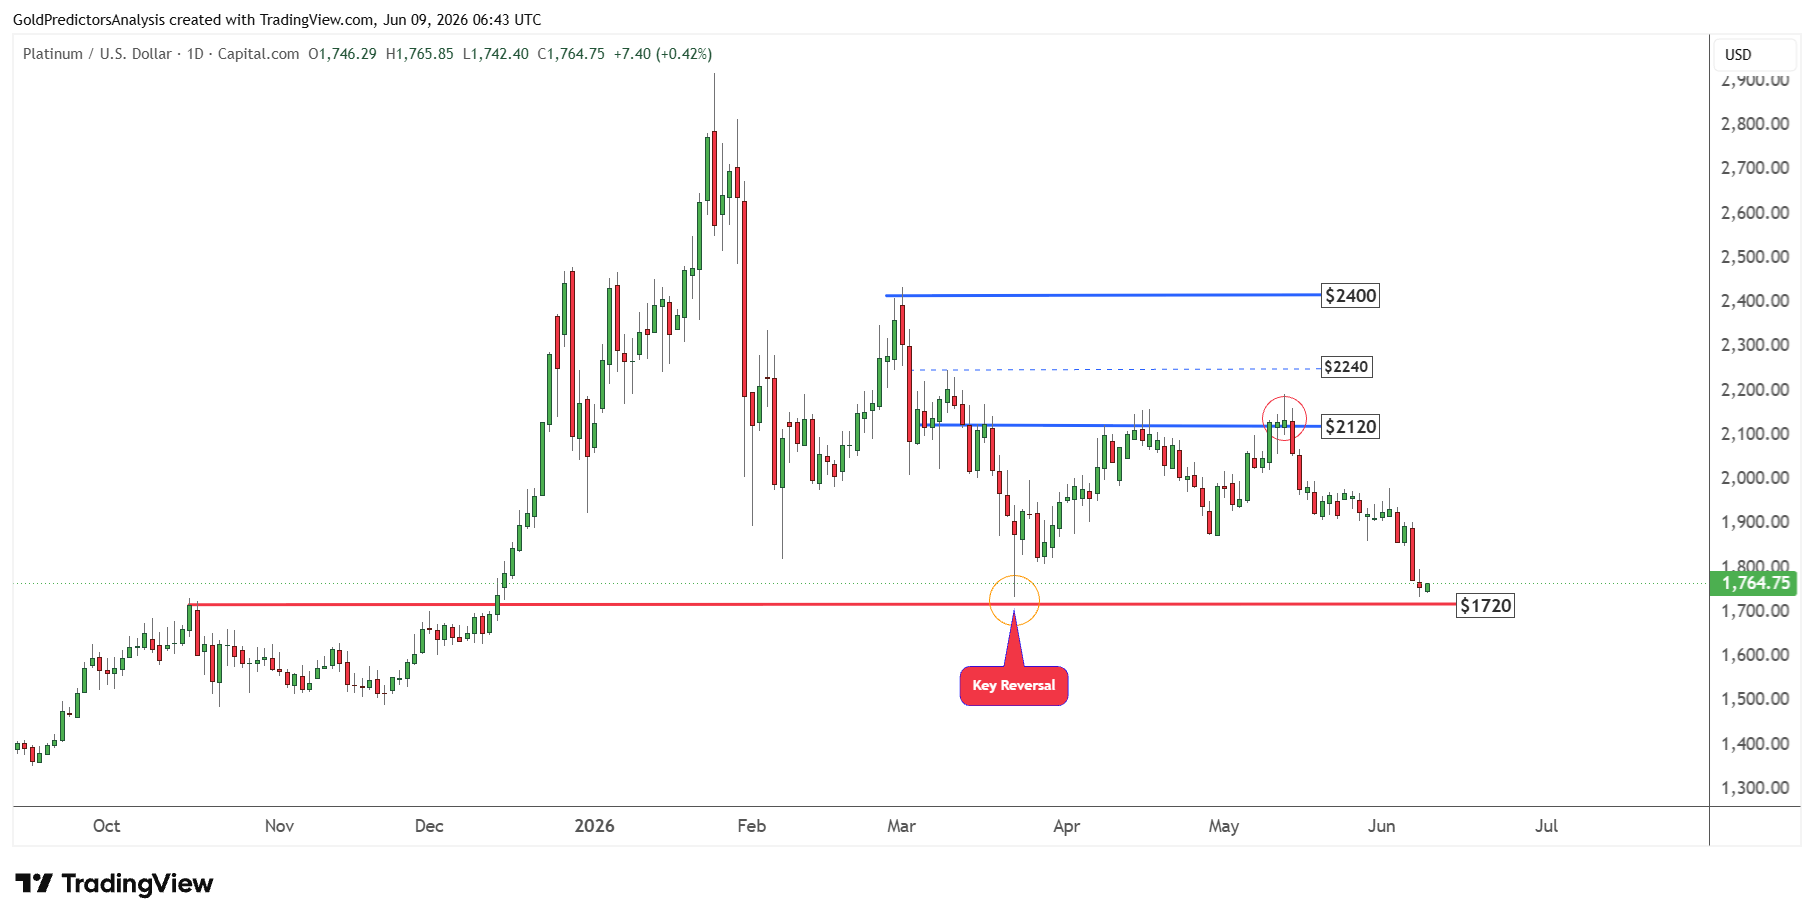
The strong decline from the recent high shows bearish price action in the short term. Therefore, a break below the $1,720 to $1,700 region will likely push prices toward the next support at $1,530.
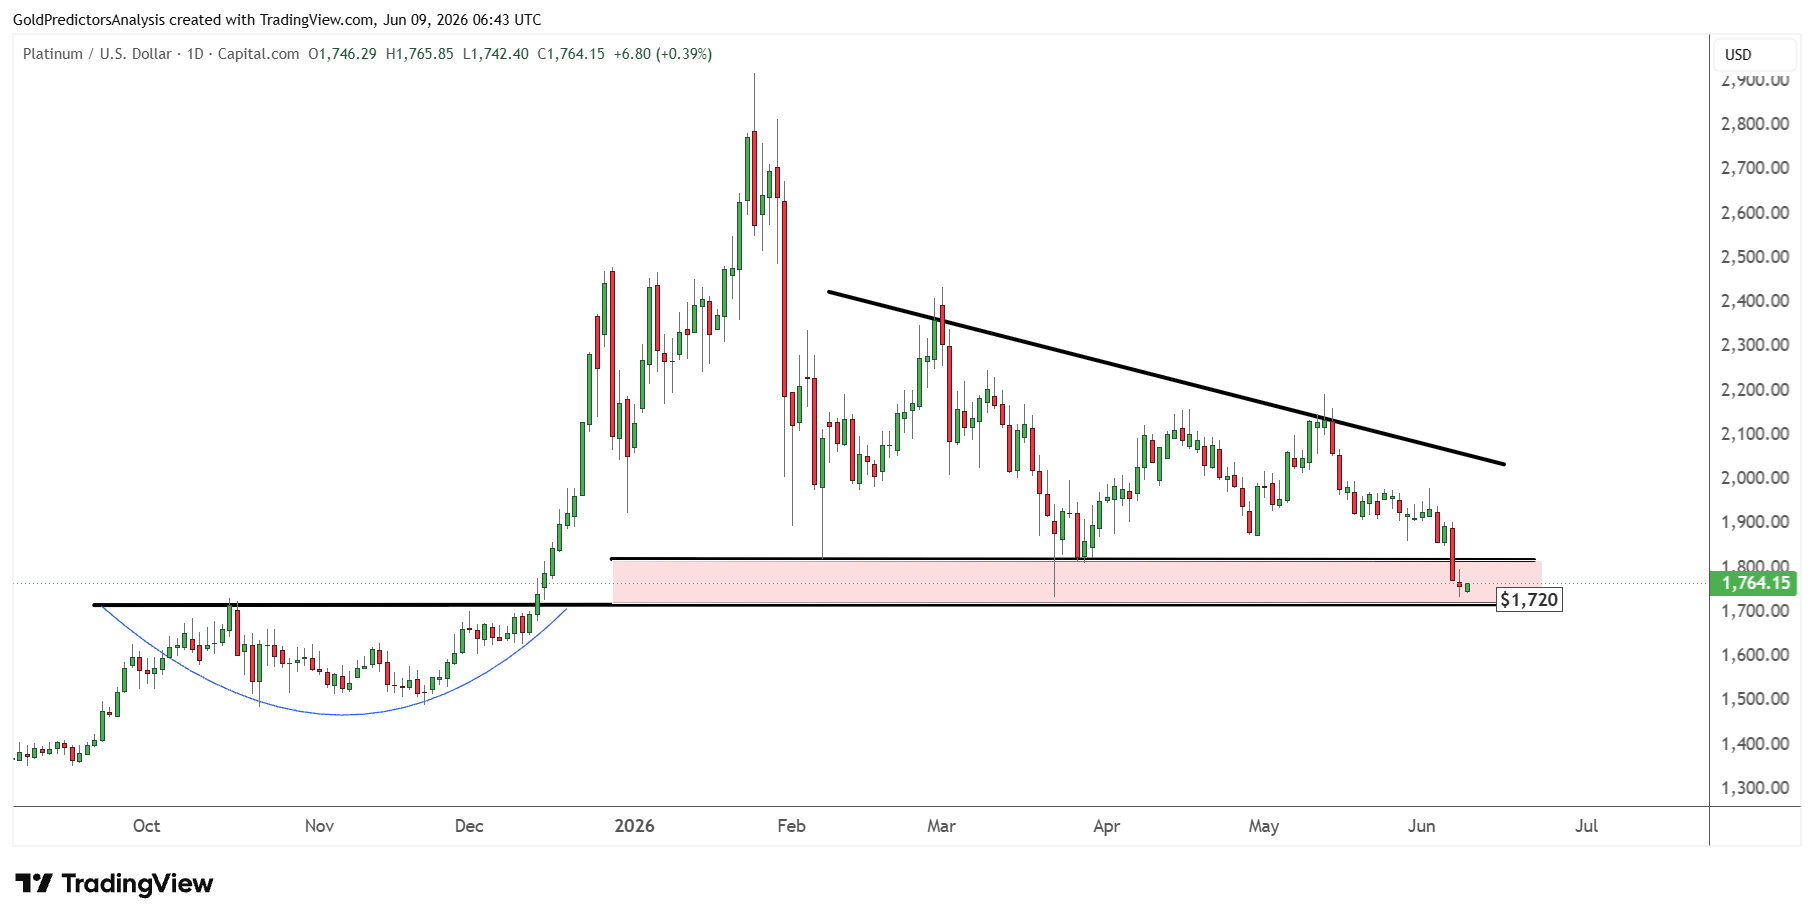
The platinum price chart below was discussed in the previous analysis, which highlights the strong support zone of $1,650 to $1,700. The price has pushed toward this support zone after the U.S. jobs data and now waits for the inflation data to trigger the next move.
Due to extreme volatility in the platinum market, support numbers can vary heavily. The February 2026 and March 2026 drops pushed prices by another $100 before finding a bottom as seen in the red circles in the chart below.
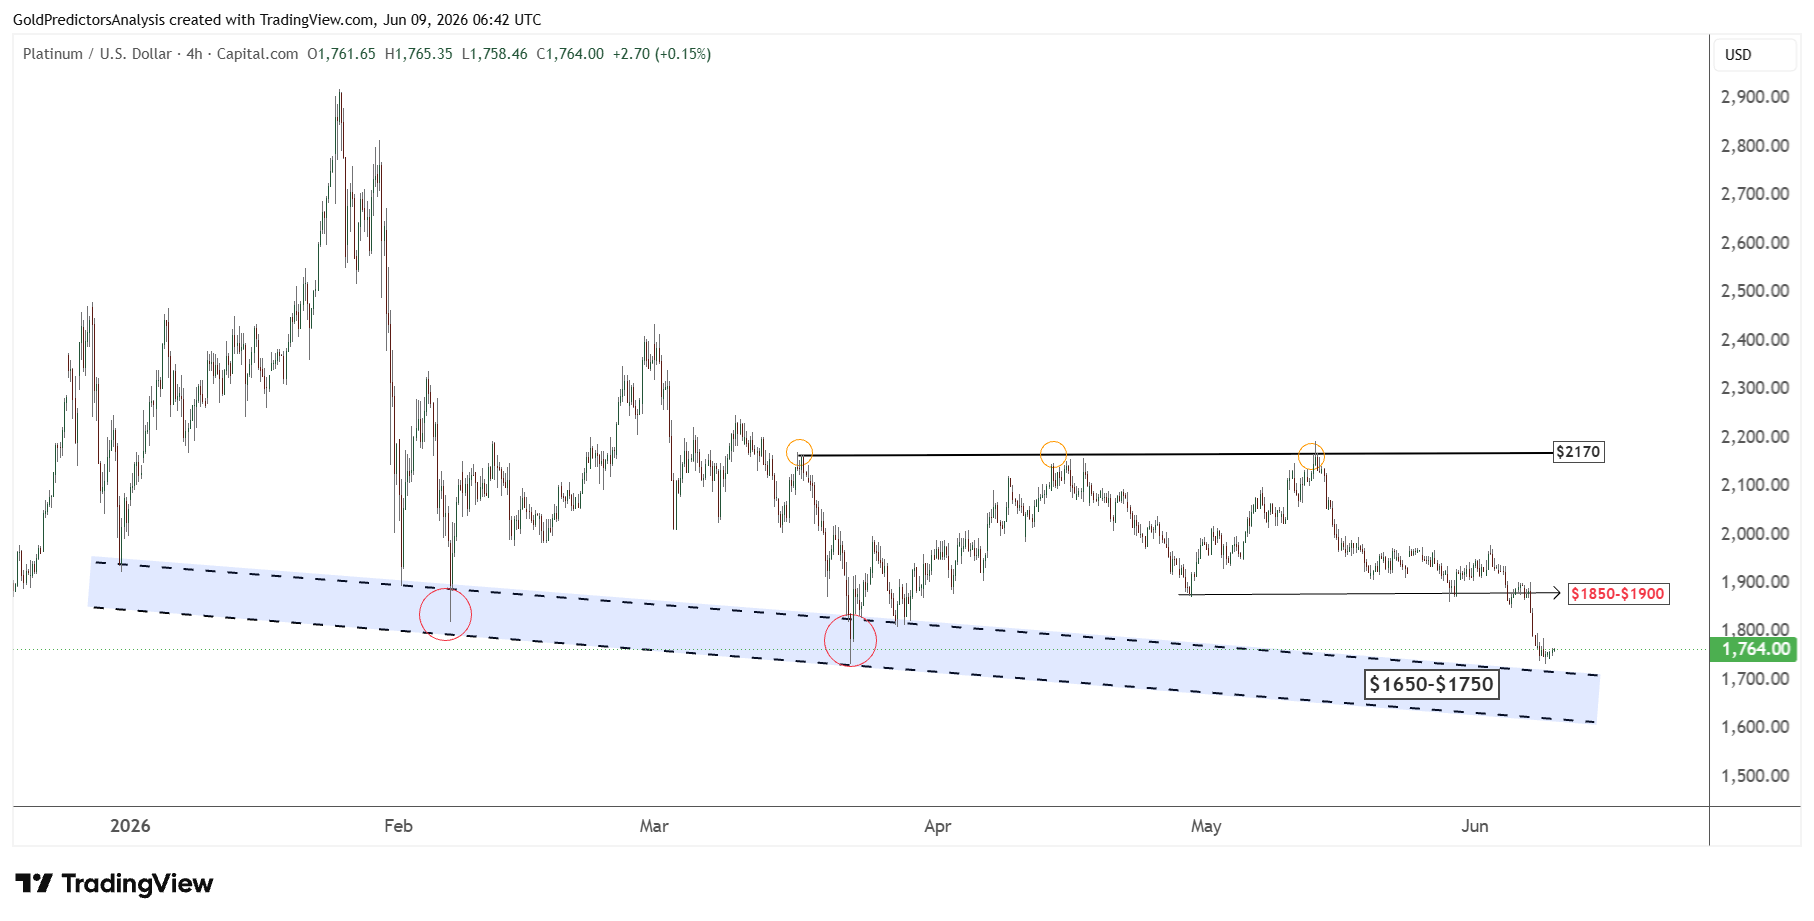
Therefore, if prices drop toward $1,600 and then reverse back above $1,700, it may be the first sign that platinum prices are reversing from the bottom. This indicates that the $1,600 to $1,700 region remains the key support zone in the short term.
Platinum-to-Gold Ratio Signals Short-Term Weakness
It is interesting to note that precious metals are dropping as gold breaks $4,500 and silver breaks $72. But the decline in platinum is steeper than gold (XAU) and silver (XAG). The platinum-to-gold ratio confirms this weakness as it pushed toward 0.40 after hitting strong resistance in January 2026.
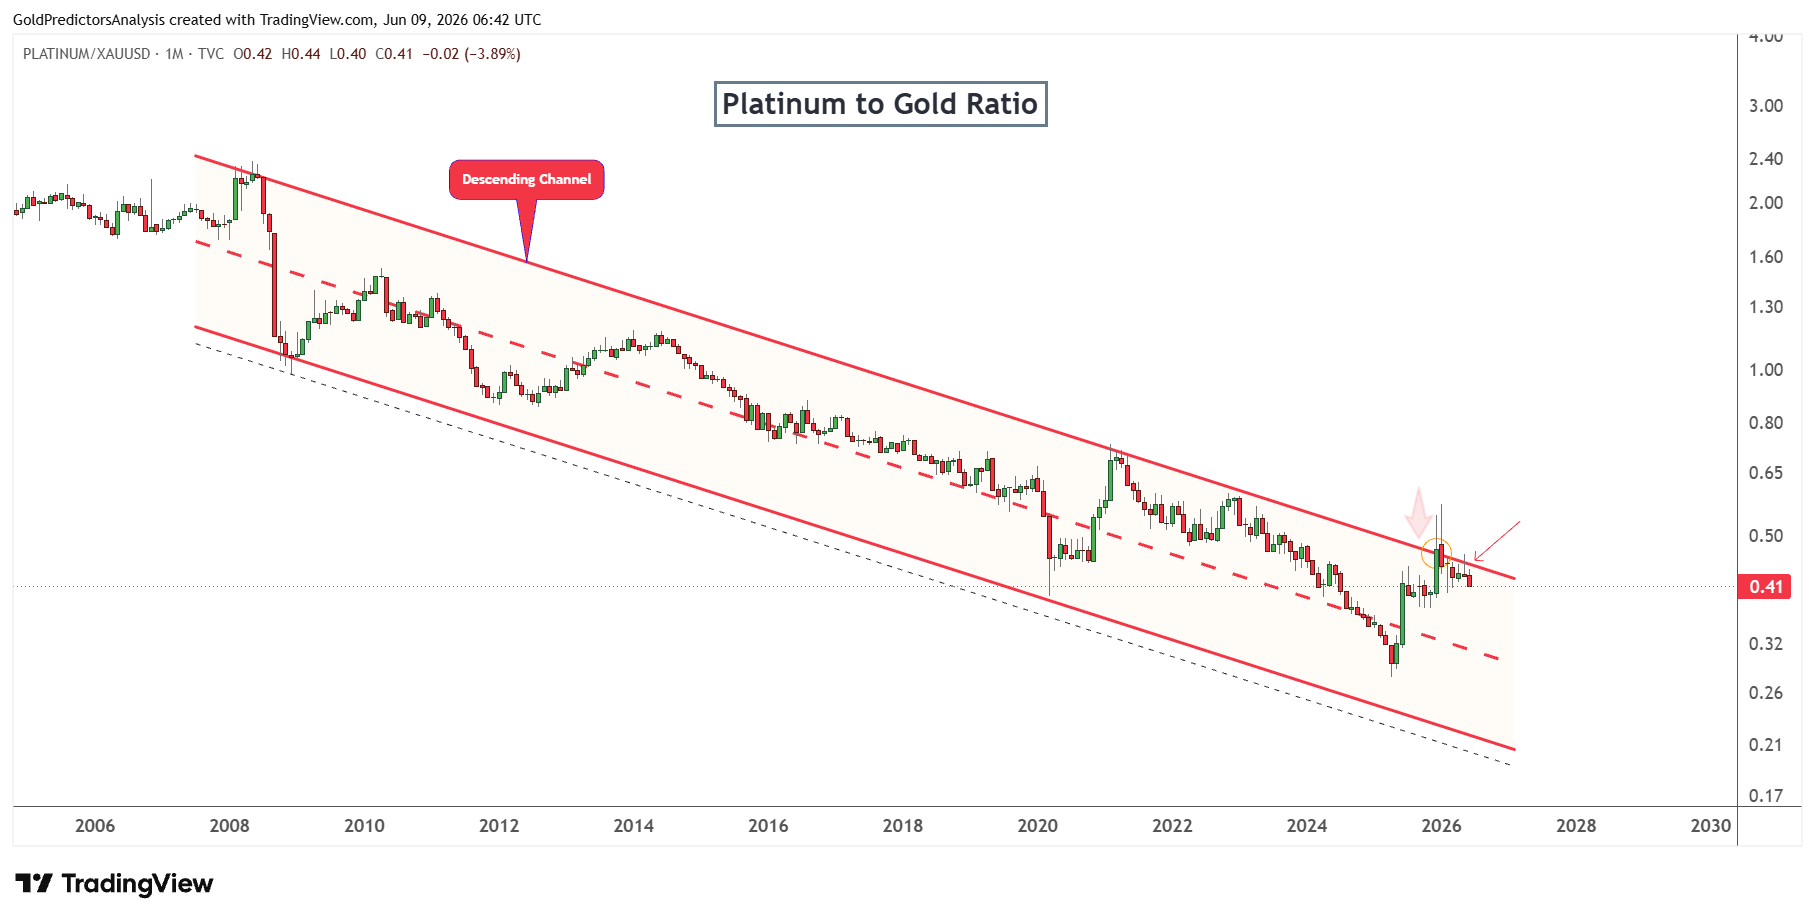
The negative price action in the ratio suggests that platinum prices may remain weak during the next few months. This also indicates that the precious metals sector will find the next bottom soon during this correction.
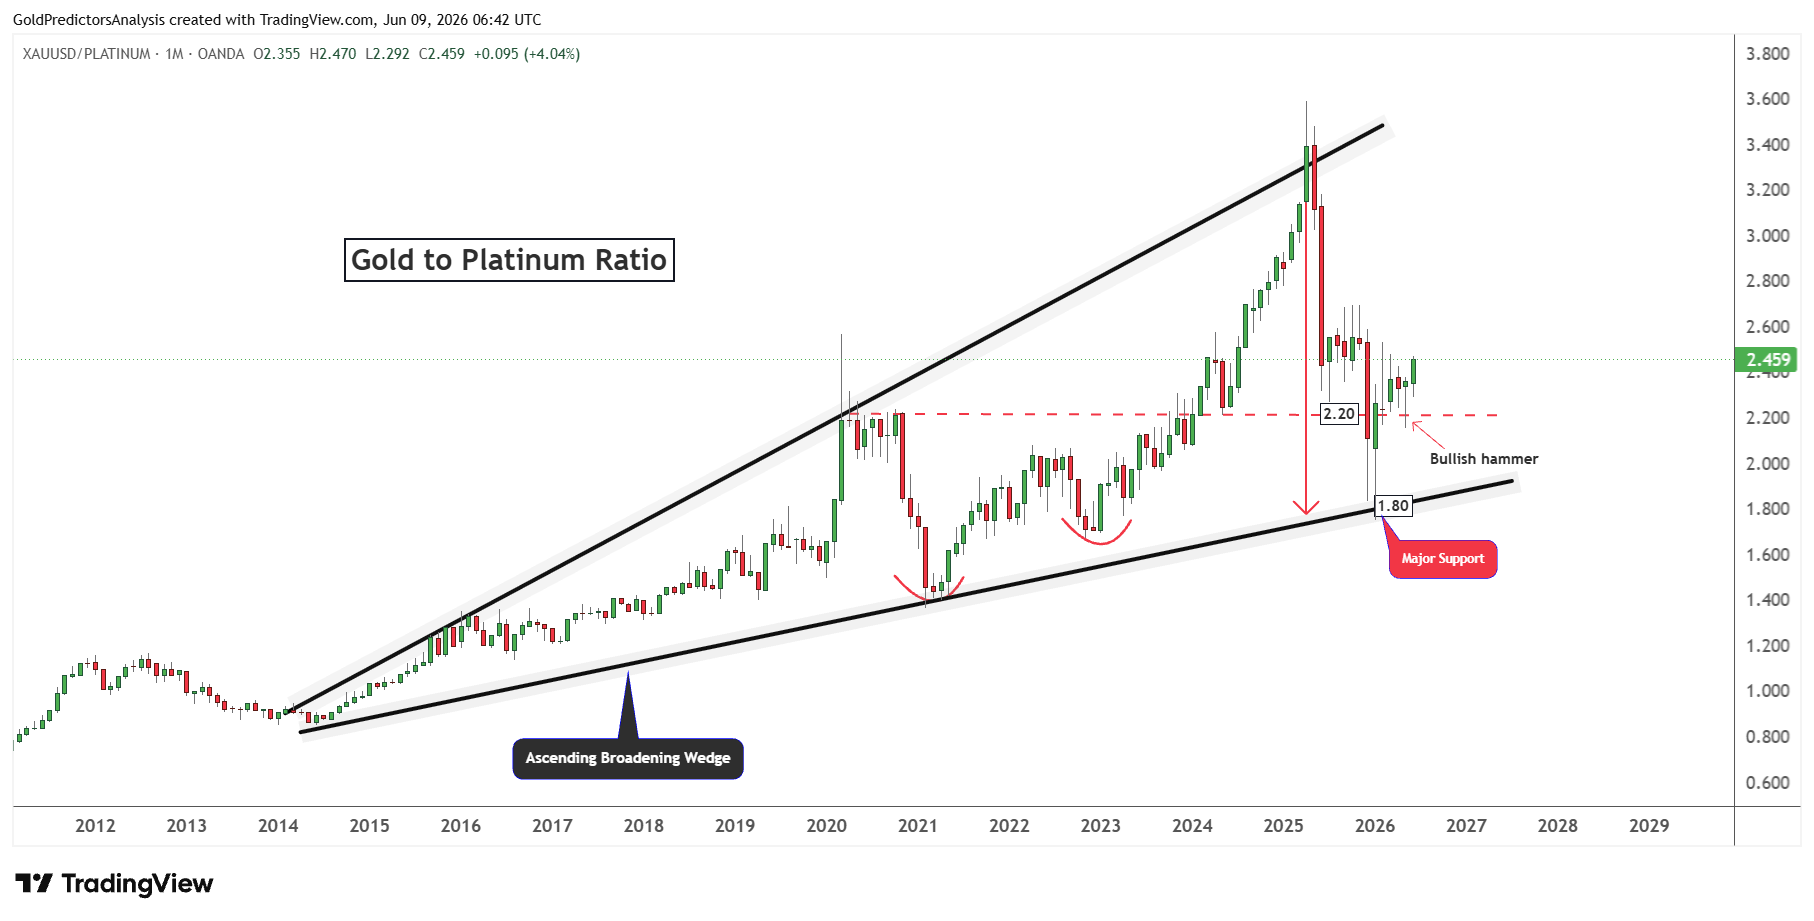
It is also interesting to note that the gold-to-platinum ratio also formed a bottom at 1.80. The ratio triggered a strong rally after this bottom. The bullish hammer candle above the red dotted trend line at 2.20 in May 2026 indicates a strong rally in the ratio. This keeps platinum prices in bearish mode in the short term.
The strength in this ratio suggests selling pressure in platinum prices, which may remain for some time before the next reversal.
Bottom Line
Platinum prices remain under pressure in the short term by strong U.S. jobs data, higher yields and a stronger U.S. dollar. The price has reached a critical support area in the $1,600-$1,700 zone. Any drop below this area could extend the correction to $1,530. A break below $1,530 could extend the drop to $1,350 and $1,200. Despite this correction, the overall trend remains bullish. The correction in platinum might be stronger than in gold and silver due to the highly volatile nature of platinum.
In my opinion, this correction is a part of a larger bull market rather than the end of the platinum rally. The medium-term outlook remains solid as the tight supply, industrial demand, automotive and fuel-cell applications continue to drive demand. The strong correction in the platinum-to-gold ratio and the strong rebound in gold-to-platinum from their pivotal levels suggest that the platinum prices remain bearish as compared to other metals. In short, the platinum prices are likely to drop further before the next bottom forms. The upcoming inflation data will provide further insights for the next direction.
Read more: Fed Risk and Oil Inflation Pressure Prices