


Platinum (XPL) prices remain under pressure on concerns of higher Middle East tensions and a stronger U.S. dollar. The price failed to break the short term resistance at $2,170 in May and is now testing important support levels. In my view, this correction sets the stage for the next rally. This article discusses the macro factors, the long-term trend in platinum, short-term support levels and the key risks that may shape the next move in platinum.
Macro Pressure Builds as Dollar and Yields Hit Platinum
Strong Dollar and Sticky Inflation Weigh on Platinum
Platinum remains under pressure as the macro backdrop remains difficult for precious metals. The latest drop in platinum prices is due to the strong bullish momentum in the US dollar, rising US Treasury yields and inflation concerns associated with the US-Iran war. The inflation risks have increased after the latest escalation in the Middle East tensions. This is important to platinum because high inflation expectations may impact the Fed’s decision to keep the interest rates higher for longer. The higher interest rates are bad news for precious metals.
But the primary factor for platinum is the US dollar index. A stronger US dollar will reduce demand from outside the U.S. market. This is crucial because platinum is not just a precious metal. It is used in industries, employed in auto catalysts, hydrogen technology and other industrial applications.
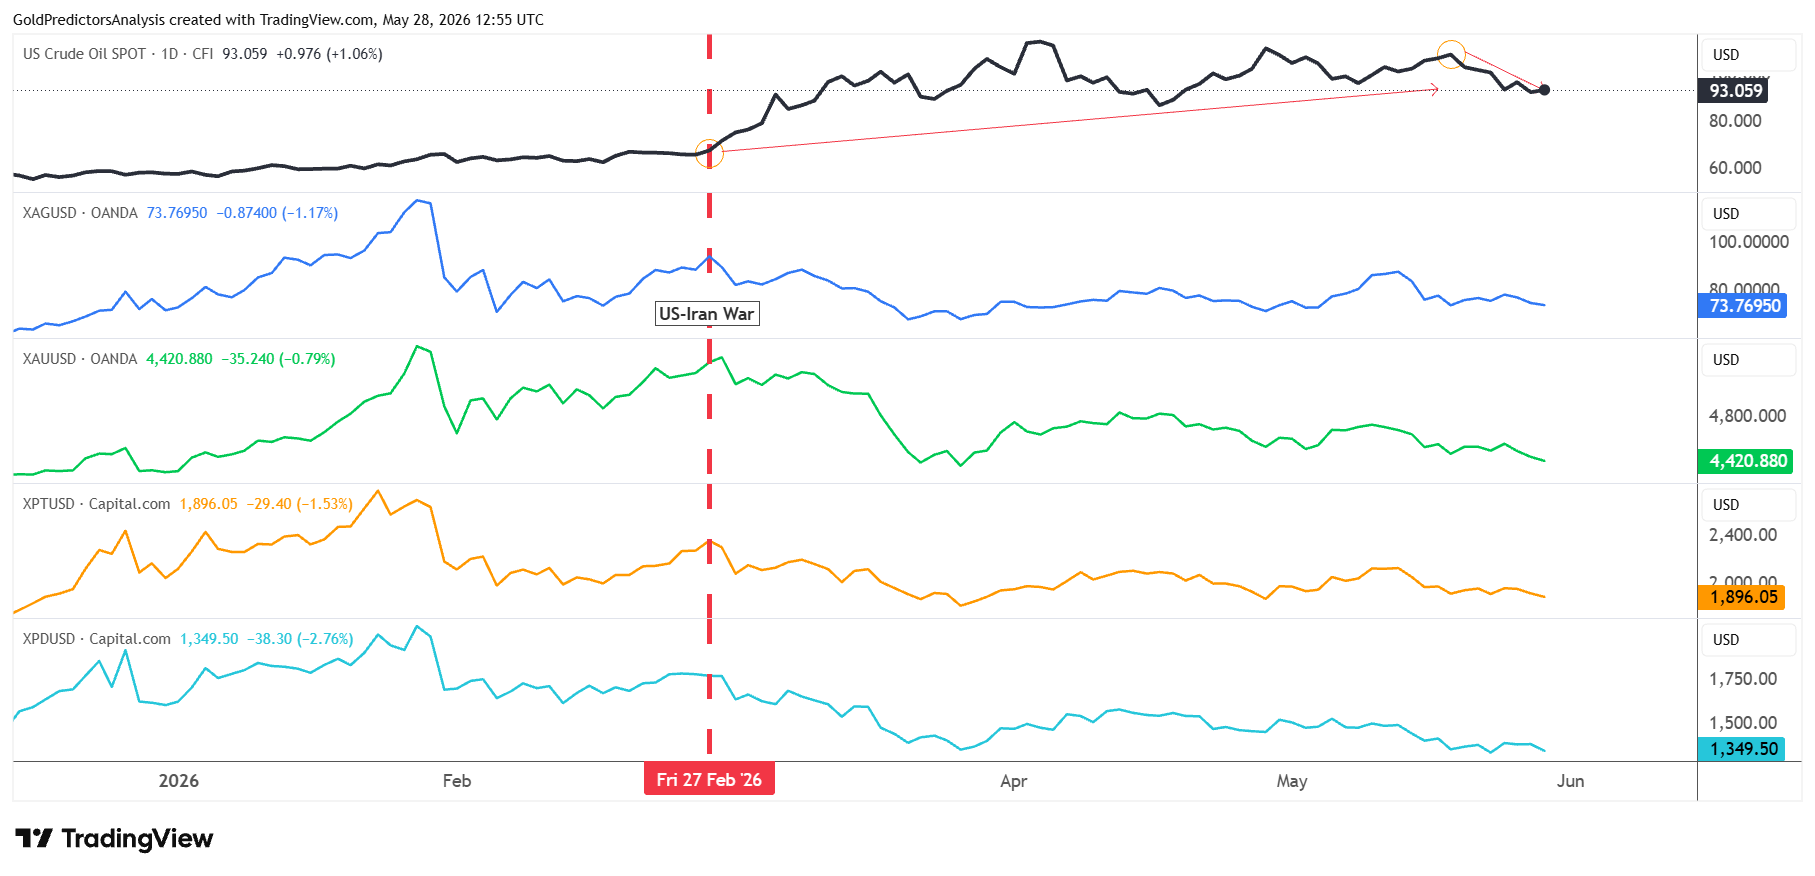
The chart below shows that the precious metals are trading with inverse correlation to oil prices. It is evident that the surge in oil prices after the US-Iran conflict has put pressure on gold (XAU), silver (XAG), platinum and palladium (XPD).
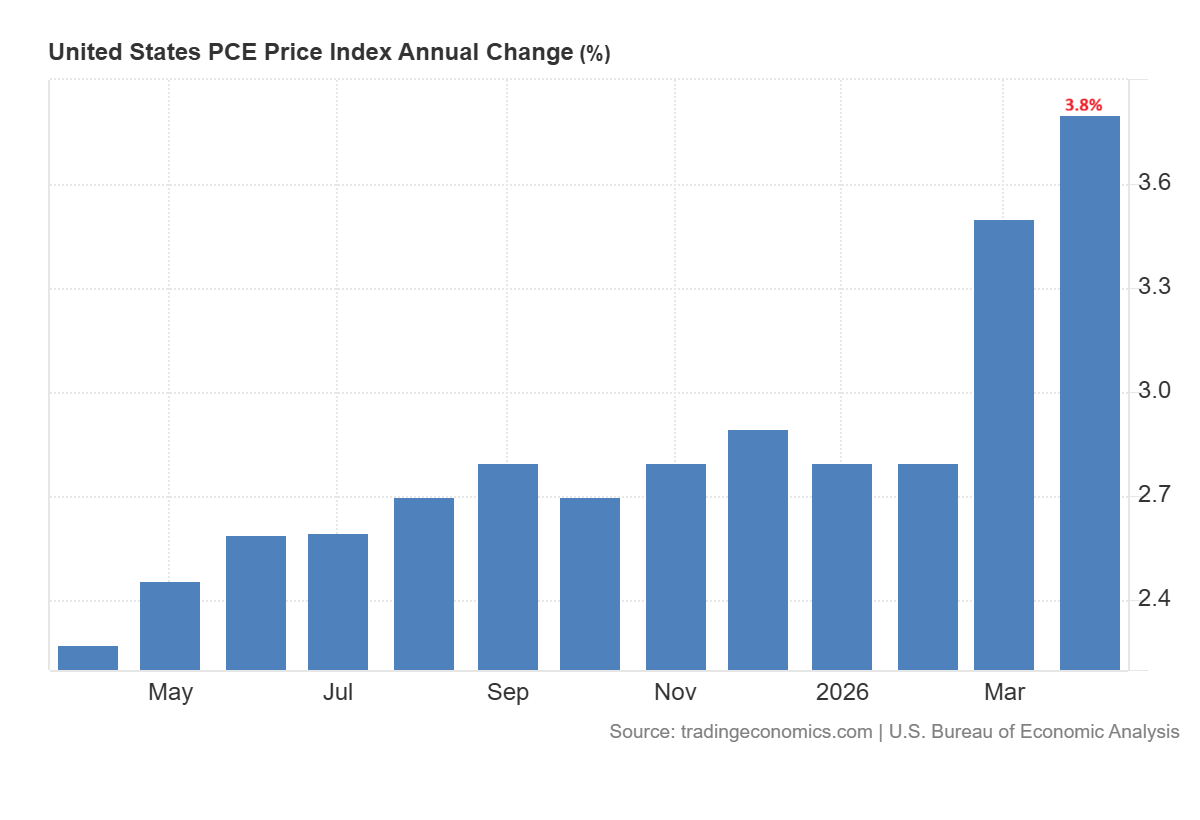
The PCE inflation increased to 3.8% in April on an annualized basis. On the other hand, the core PCE inflation increased 3.3%. PCE is now at the highest level since November 2023. The inflation rises but it is not hotter than expected. Therefore, this data may put pressure on the US dollar and US Treasury yields in the short term. This may trigger a short-term rebound in precious metals from the current levels.
PGM Supply Risks Support the Long-Term Outlook
The negative aspect of platinum could be curtailed if supply issues return. Platinum is even more tightly coupled in the long-term than many other metals, as most of the production is concentrated in South Africa, Russia and Zimbabwe. This implies geopolitical risk, power shortages, mining disruptions or sanctions can quickly push prices higher.
Moreover, the recent United States decision to impose heavy tariffs on Russian palladium is significant for platinum since both metals are part of the PGM complex. Stress in palladium supply can drive attention to substitution, auto-catalyst demand and overall PGM tightness.
Overall, the macro conditions for platinum are mixed. The higher yields, US dollar and interest rates suggest a bearish setup in the short term. But the long-term outlook remains strong due to supply concentration, market tightness and industrial demand for PGMs. So platinum could stay in the range until the market receives a better signal from oil prices and the Fed’s message.
Platinum Long-Term Outlook: Bullish Structure Needs Consolidation
2025 Surge Leaves Platinum in a Cooling Phase
The long-term outlook for platinum prices shows that platinum has remained in a bullish phase since the 2020 lows.
The surge in 2025 was 126.92%, which was one of the highest in its history. After surging this much in a parabolic move, platinum prices marked a high of $2,919 in January 2026 and started to correct lower.
Prices have already dropped towards the $1,700 support and then rebounded higher. But the price is now consolidating around the support levels and looks to form a bottom before the next rally.
The main question now is whether the peak in 2026 is like the peaks of 1980 and 2008, or whether platinum prices are likely to trade higher. It is likely that the 2025 surge in a straight line has produced a short term top and prices require some consolidation before the next rally.
Historical Patterns Point to Long-Term Bullish Potential
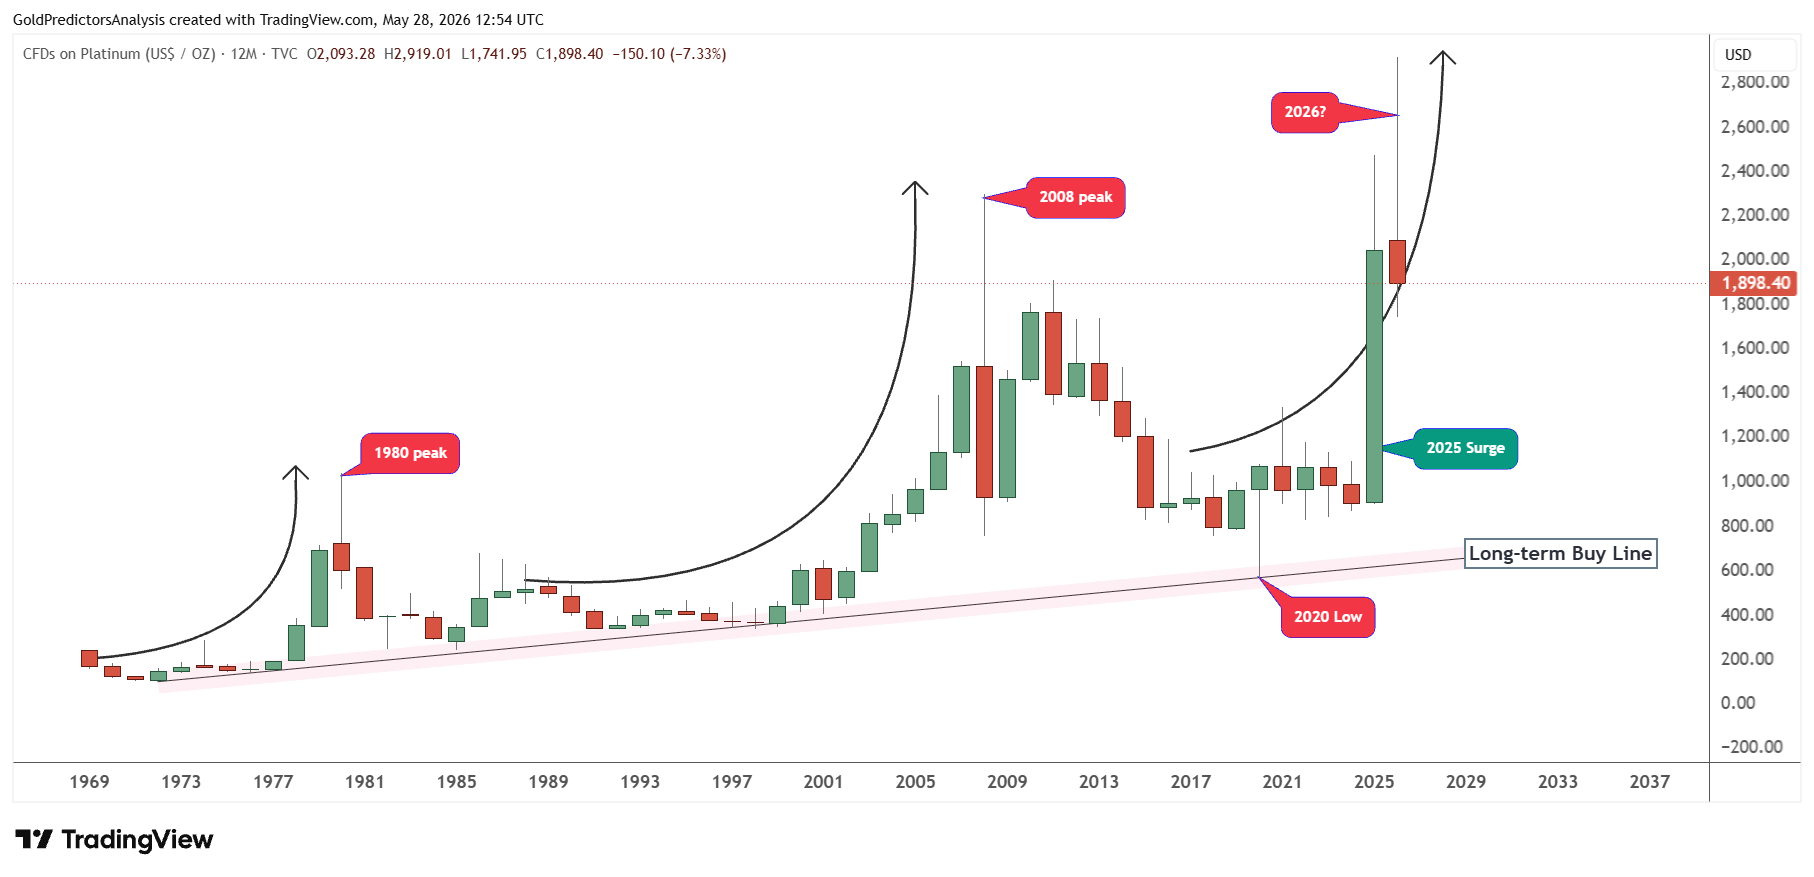
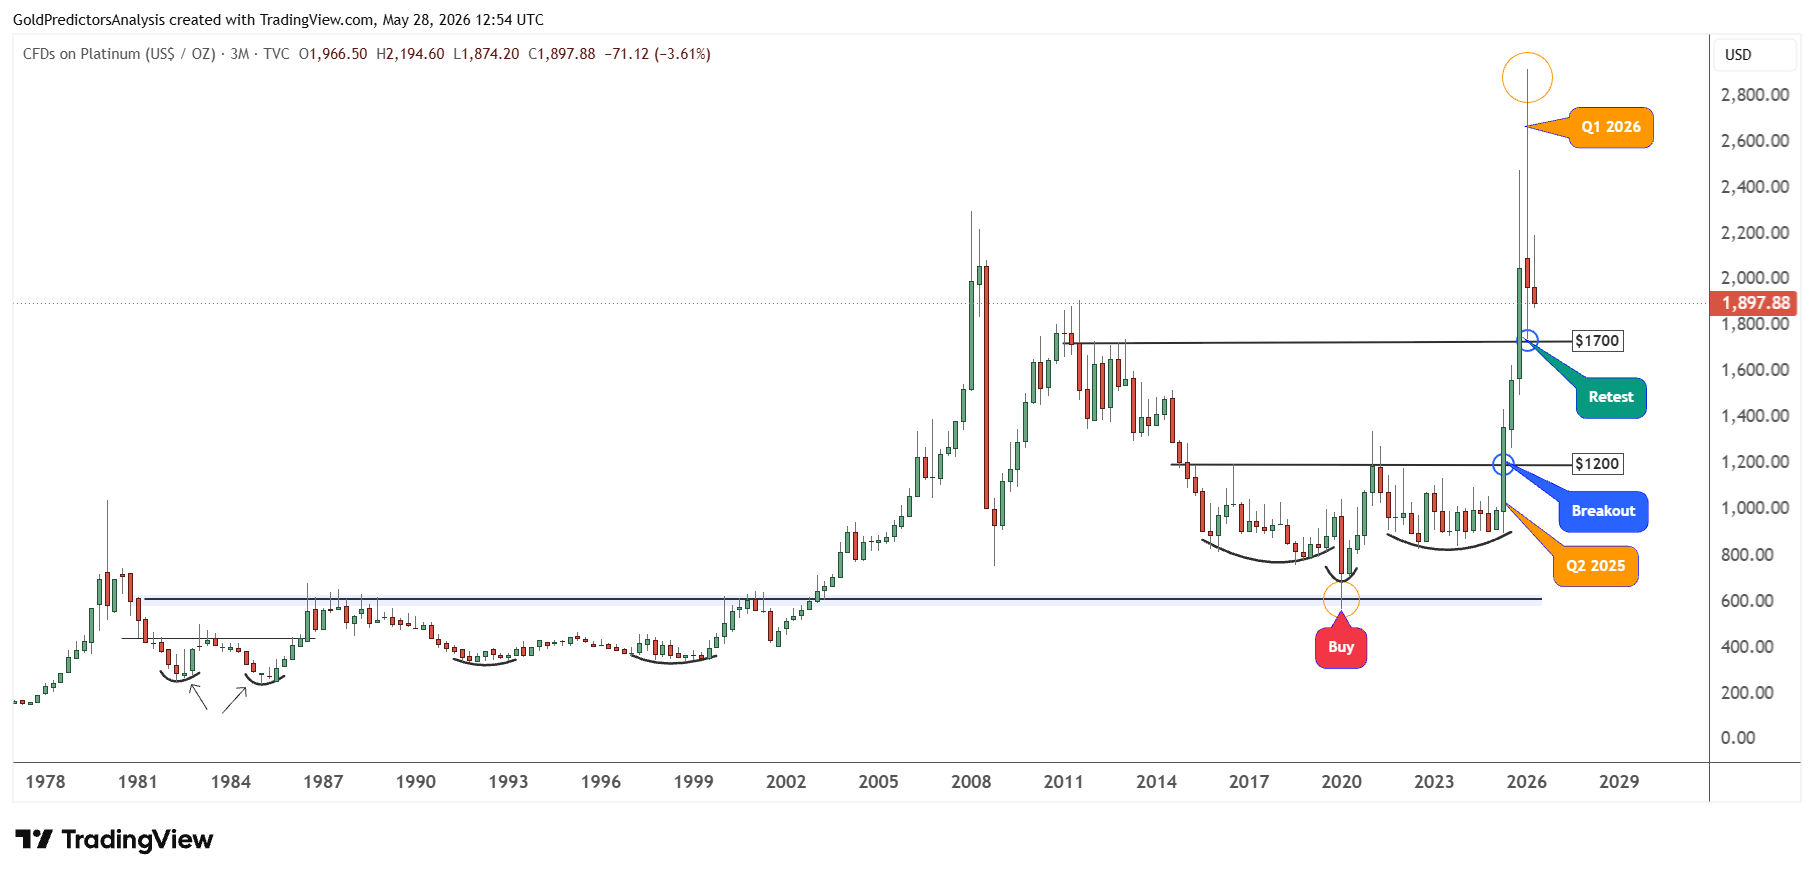
To further understand the long term outlook, the quarterly chart presents a clearer picture. Platinum prices formed a double bottom in 1982 and 1985. After forming the double bottom, the price consolidated for 10 years before breaking above the key level of $600.
After breaking above $600, the price surged to mark a high in 2008 at $2,299 and then corrected back towards the $752.50 area that year. The 2008 price action suggests that platinum prices have historically been very volatile.
The year 2025 shows a similar surge. The inverted head-and-shoulders pattern with the low in the first quarter of 2020 supports this surge.
The rally of 2025 was much stronger as the price broke the target of $2,300 and surged above this target area. But the Q1 2026 candle indicates that prices are reversing from the highs. The price formed a negative candle, but the close was not that negative because prices closed above the $1,900 level in Q1 2026.
This price action indicates that if the $1,700 support level breaks and the price closes below it on a quarterly basis, the correction in platinum prices may go towards $1,200.
But due to the formation of an inverted head-and-shoulders pattern, a break below $1,200 is unlikely and prices will likely reverse higher back towards the record levels.
However, if prices hold the $1,700 area then consolidation for the next few weeks will likely trigger the next surge in platinum prices.
This suggests that platinum prices remain within the bullish price action, but they require some consolidation to maintain the bullish structure for the next few months.
Platinum Short-Term Outlook: Key Support Levels Come Into Focus
The short-term price action was discussed in the last article with the view that there are only two support levels in the short term that must hold to maintain the bullish structure.
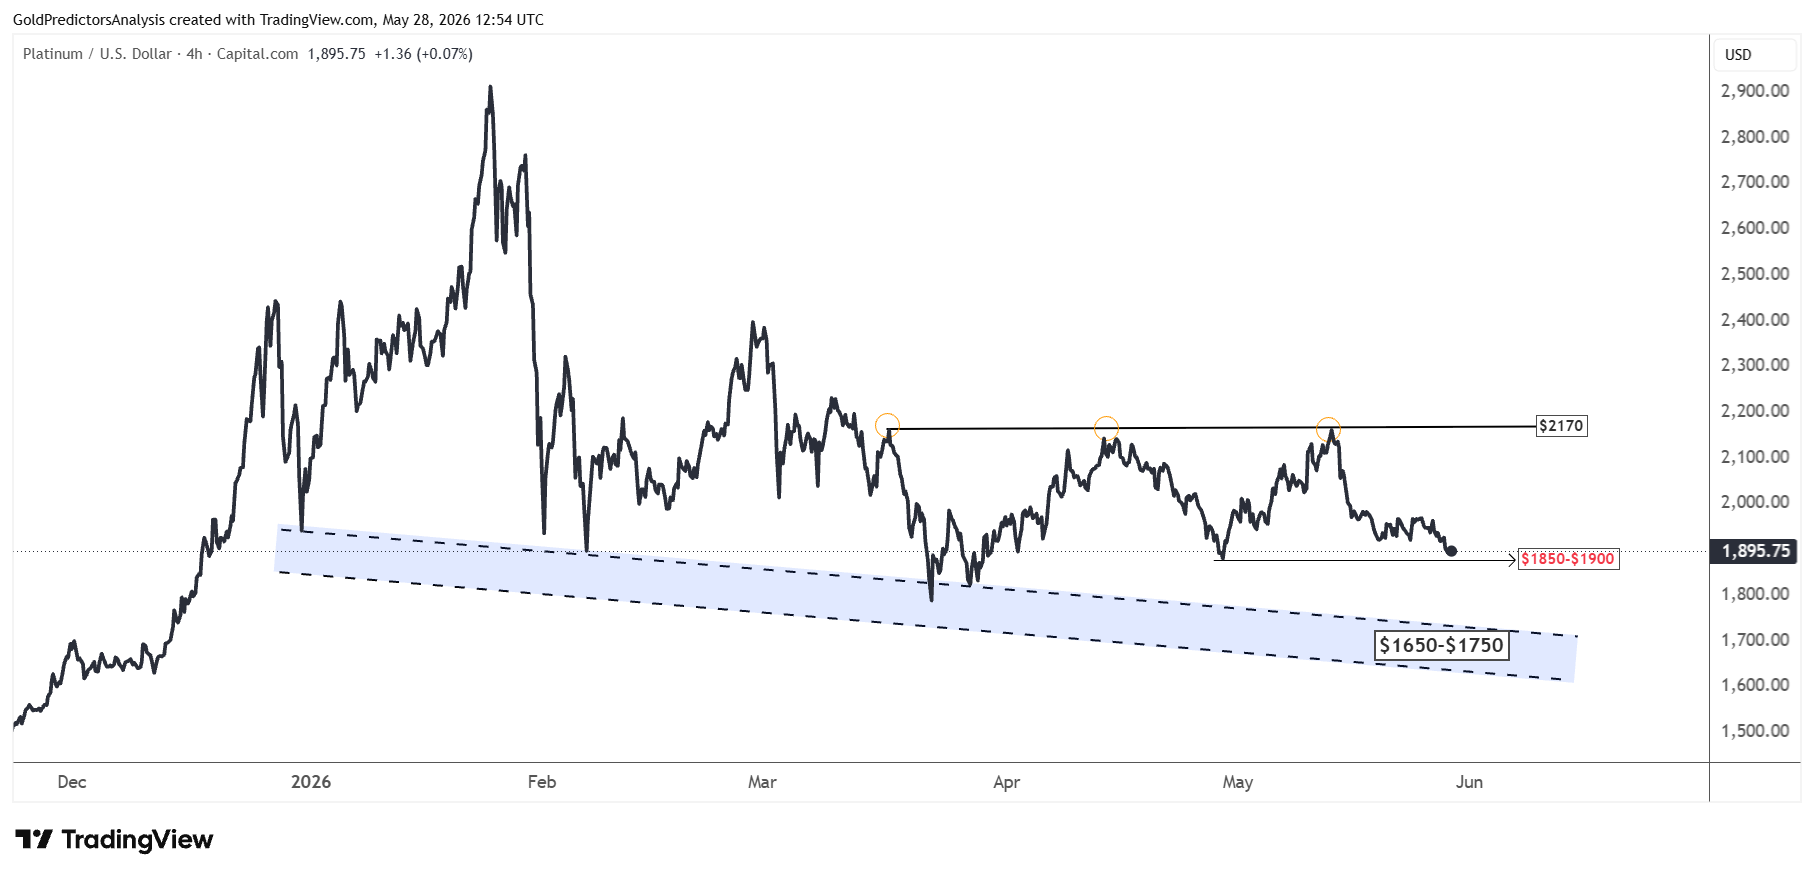
The first support lies at $1,900 and the second one at $1,700. The chart below shows that platinum prices failed to break above $2,170 in May after forming multiple peaks.
This failure suggests that prices are going towards the buy zone again. The short-term buy zones are $1900 and $1,650 to $1,750, with $1,700 as the ideal level.
If the price drops towards this level and then rebounds back above the $2,170 region, it will confirm a bottom and continue the rally in platinum prices. But a break below $1,700 will likely trigger further downside towards the $1,200 area.
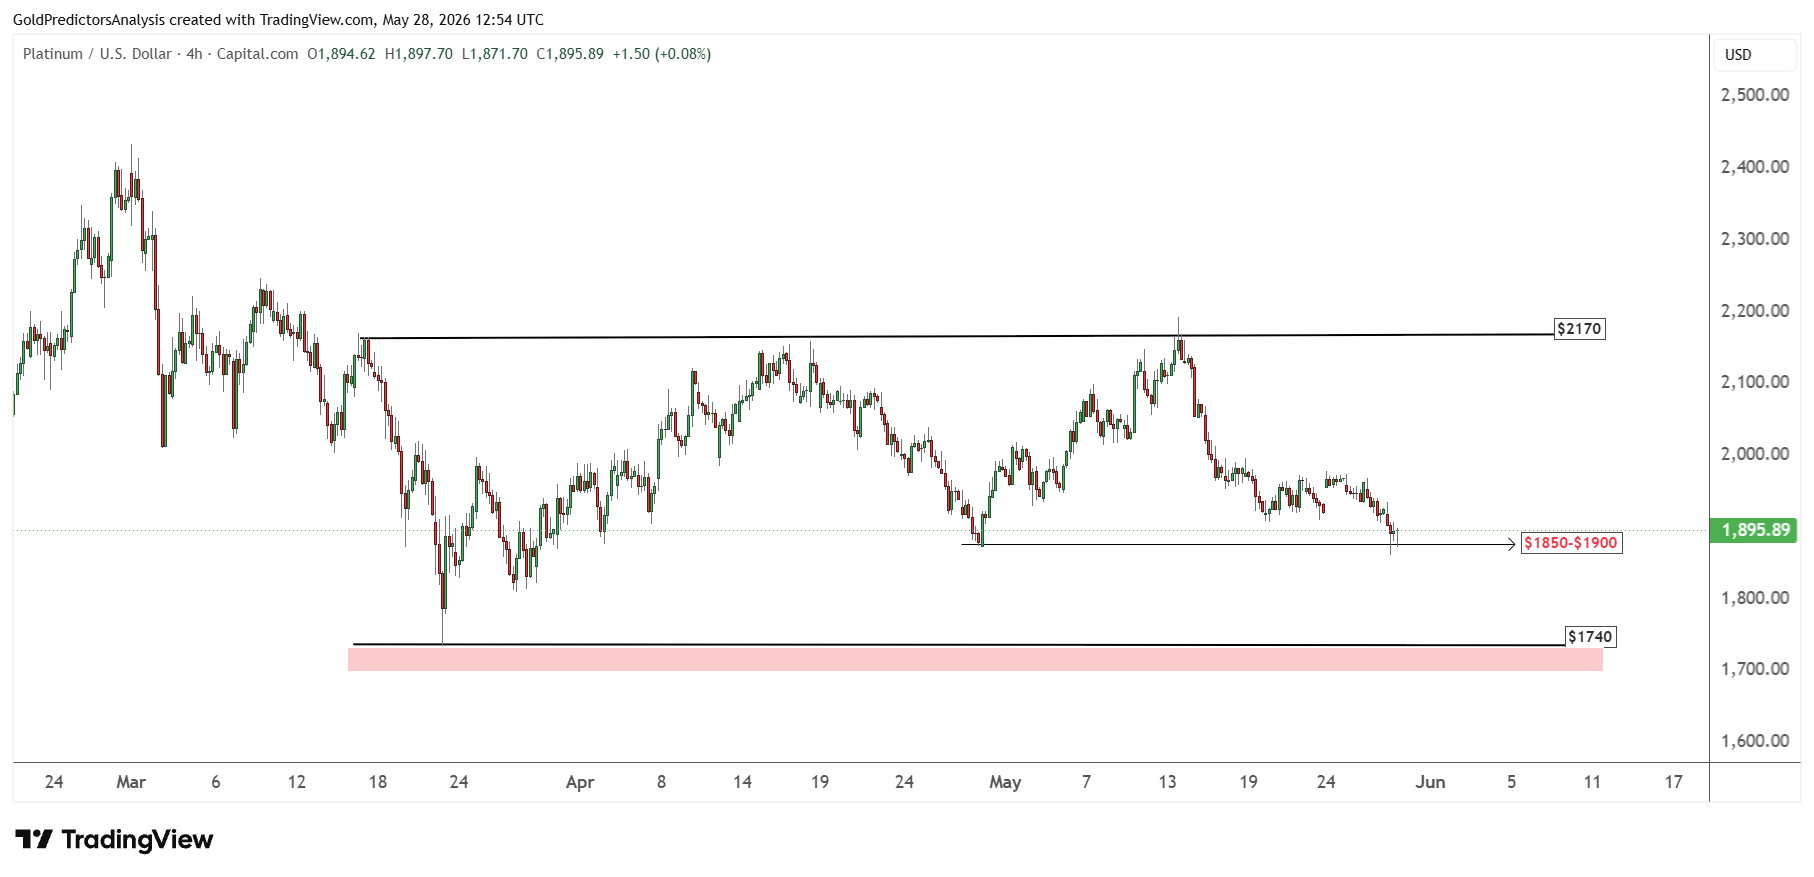
Another 4-hour chart for platinum shows that the $1,850 to $1,900 area remains the short-term support level. If this support level holds, then platinum may still rally towards the $2,170 region. But a break below $1,850 will likely trigger another drop towards $1,740.
Risk Analysis
The main risk for platinum is a stronger U.S. dollar and higher Treasury yields. If inflation remains a concern because of the oil price spikes and Middle East unrest, the Federal Reserve could hold interest rates higher for an extended period. This would maintain higher Treasury yields. A break below $1,700 will escalate the probability of a more significant correction back to $1,200.
But the risk on the downside may be limited if there is another supply issue. Production of platinum is restricted to South Africa, Russia and Zimbabwe, which makes the market vulnerable to power shortages, mine disruptions, sanctions and geopolitical shocks. Any stress on Russian palladium supply may also boost platinum. However, the price must maintain the bull market structure by holding the key support levels.
Bottom Line
Platinum remains in a mixed but positive position. On the short-term horizon, the stronger U.S. dollar, higher Treasury yields and Middle East inflation worries weigh down prices. A break below $1,850 may push platinum back towards the $1,650 to $1,750 buy zone. If prices break below $1,700, the downside risk to a higher correction to $1,200 will increase. The long-term outlook is still bullish as long as platinum remains in the major support zone and consolidates above the key levels.
The price is consolidating around the first support level of $1900. A break below this will push prices to the second buy zone of $1700. As long as $1700 holds, the price structure remains strongly bullish. The short-term price action suggests consolidation between $1900 and $2170. A break above $2170 will likely introduce a rally.
In previous analysis, I highlighted the opportunity of buying the dip. The prices have already dropped to the support and are now preparing to form a bottom. It now depends on whether the recent catalyst may hold the support of $1900 or $1700 comes next.
Read more: Is This Correction a Buying Opportunity in Platinum?