


Two weeks ago, I described the Russell 2000 as having hit a line in the sand, and I laid out levels to watch should the bounce happen. I wrote that bulls had to put up or we were surely going lower. At the time, the small-cap breakout was hanging by a thread. The U.S.-Iran War had eroded market breadth, a death cross had printed on the iShares Russell 2000 ETF (IWM) chart, and the four-year base breakout was staring down a hard retest at ~245. My read was that bulls had to reclaim ~252 with conviction, or this becomes a failed breakout. IWM is now trading at ~262. The retest held. The bulls showed up in force. What looked like a technical trap has resolved, but now we have hit the levels where I said I would take profits. Let’s update the game plan for what may come next for the Russell 2000.
The Ceasefire Rally Sent Small Caps Soaring
The announcement of a ceasefire between the U.S. and Iran hit the market like a pressure valve releasing, but small caps felt it more than large caps. Markets had been pricing in a protracted conflict with no clean exit or resolution for the looming energy crisis born out of the closure of the Strait of Hormuz, which has hurt small caps more than large caps. The large- to small-cap ratio has been shrinking since November and is now well below where it was then. This was one of the stronger predictors that the snap back would be violent in small caps, as they’d been outperforming leading into the sell-off.
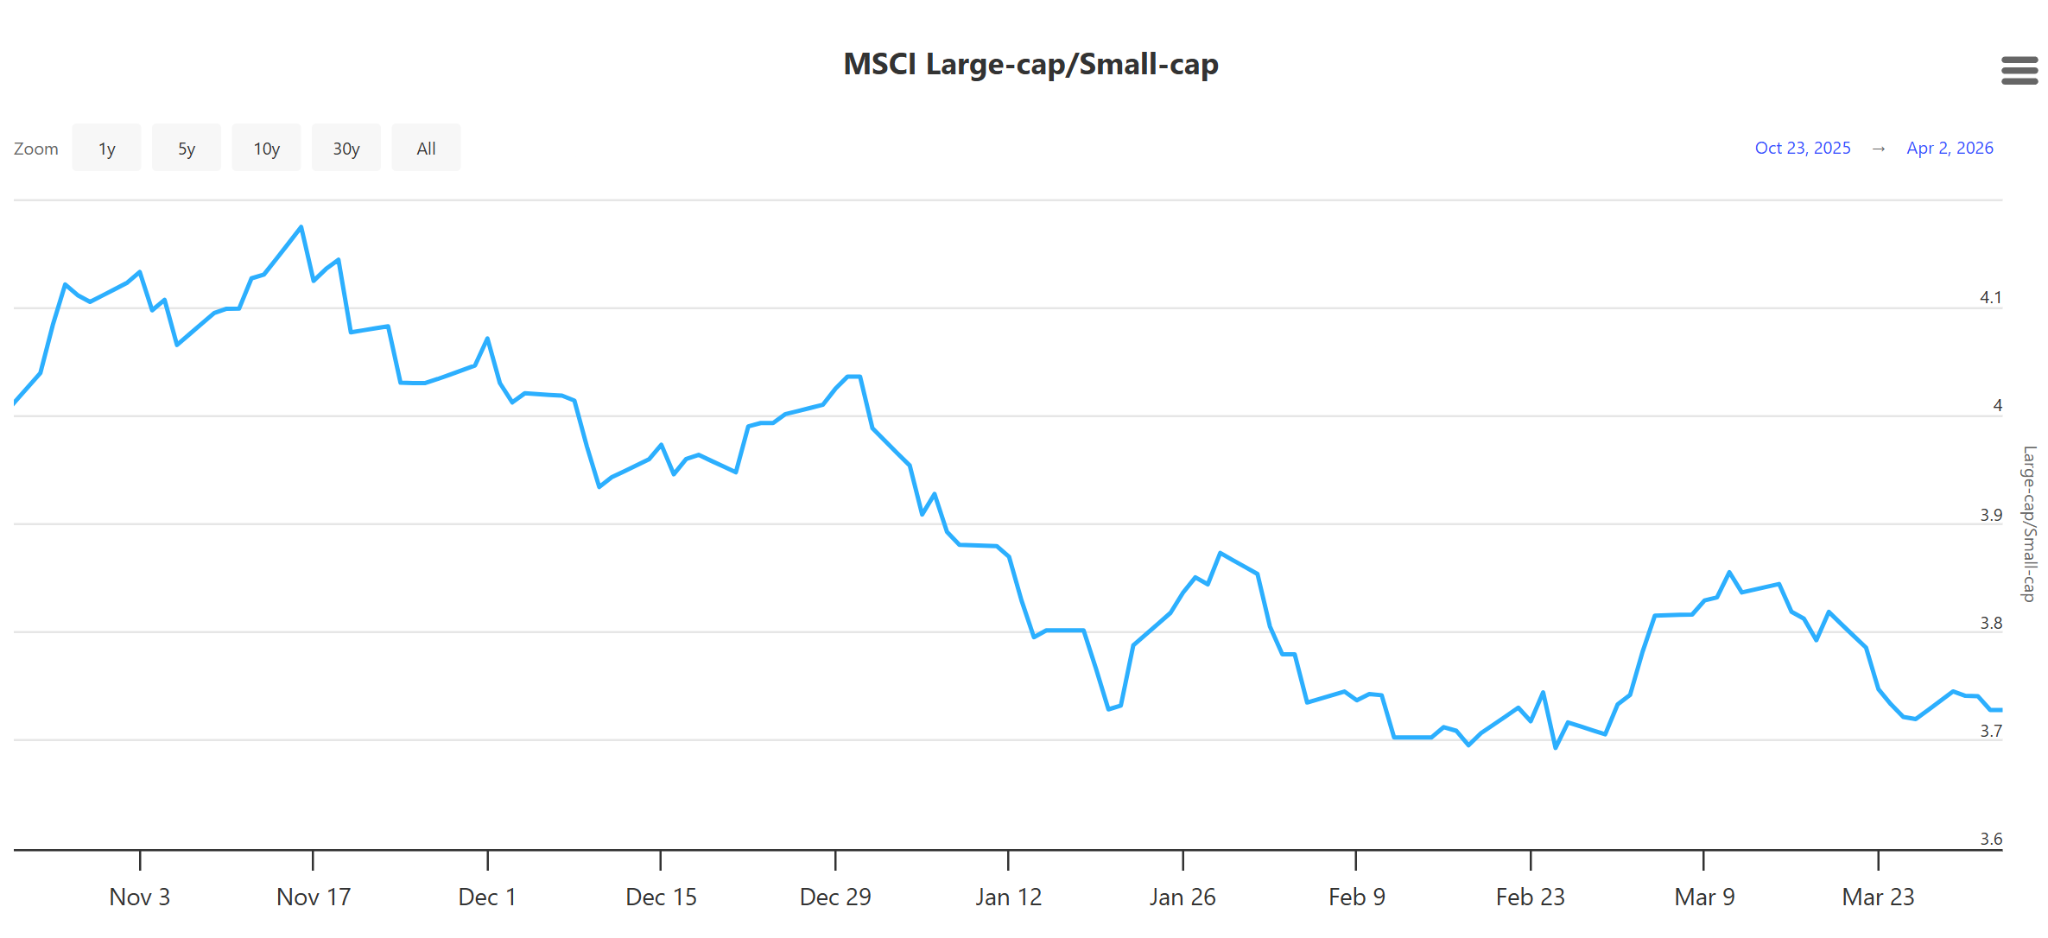
The current market is betting on a best-case outcome that hasn’t been confirmed yet. That’s the nature of forward-looking price action, and it’s precisely why IWM is now trading at levels I flagged as the bull case target weeks ago. We’re now hitting the technical resistance where I suggested taking profit before.
To go higher, we will need a firm catalyst regarding the flow of oil. Some shipping resuming will not be enough; we will need to see a resumption to previous levels of transit before we can go much further from here. There may be more positive price action ahead if volume can keep up, but then small caps will hit their old resistance, which they couldn’t break before the war, let alone without concrete peace. The technical outlook does not appear nearly as bullish as it did before, given the current macro situation. This has changed my stance on small caps, and I am taking profits at these levels on the trade, right where I expected to when I entered the trade when the “line in the sand” held a few weeks ago.
This appears to me to be a somewhat classic setup so far, but accelerated. The candles aren’t right because the macro news causes gaps up and down, but they’re respecting the levels I set out ahead of time. The best trades are those that respect the levels as much as the candles do, so I intend to follow through on my trading plan here.
IWM Technical Outlook
Let’s lay out the new trade plan from here. The chart is still looking bullish, with the last two candles at similar levels to pre-war. This is what I meant when I said that the levels are being respected and that the recovery looks sped up and fully priced in. We snapped right back to pre-war levels on the ceasefire announcement. That is evident in the chart so far.
Here is the 1-year daily chart with the VWAP anchored to September 2022:
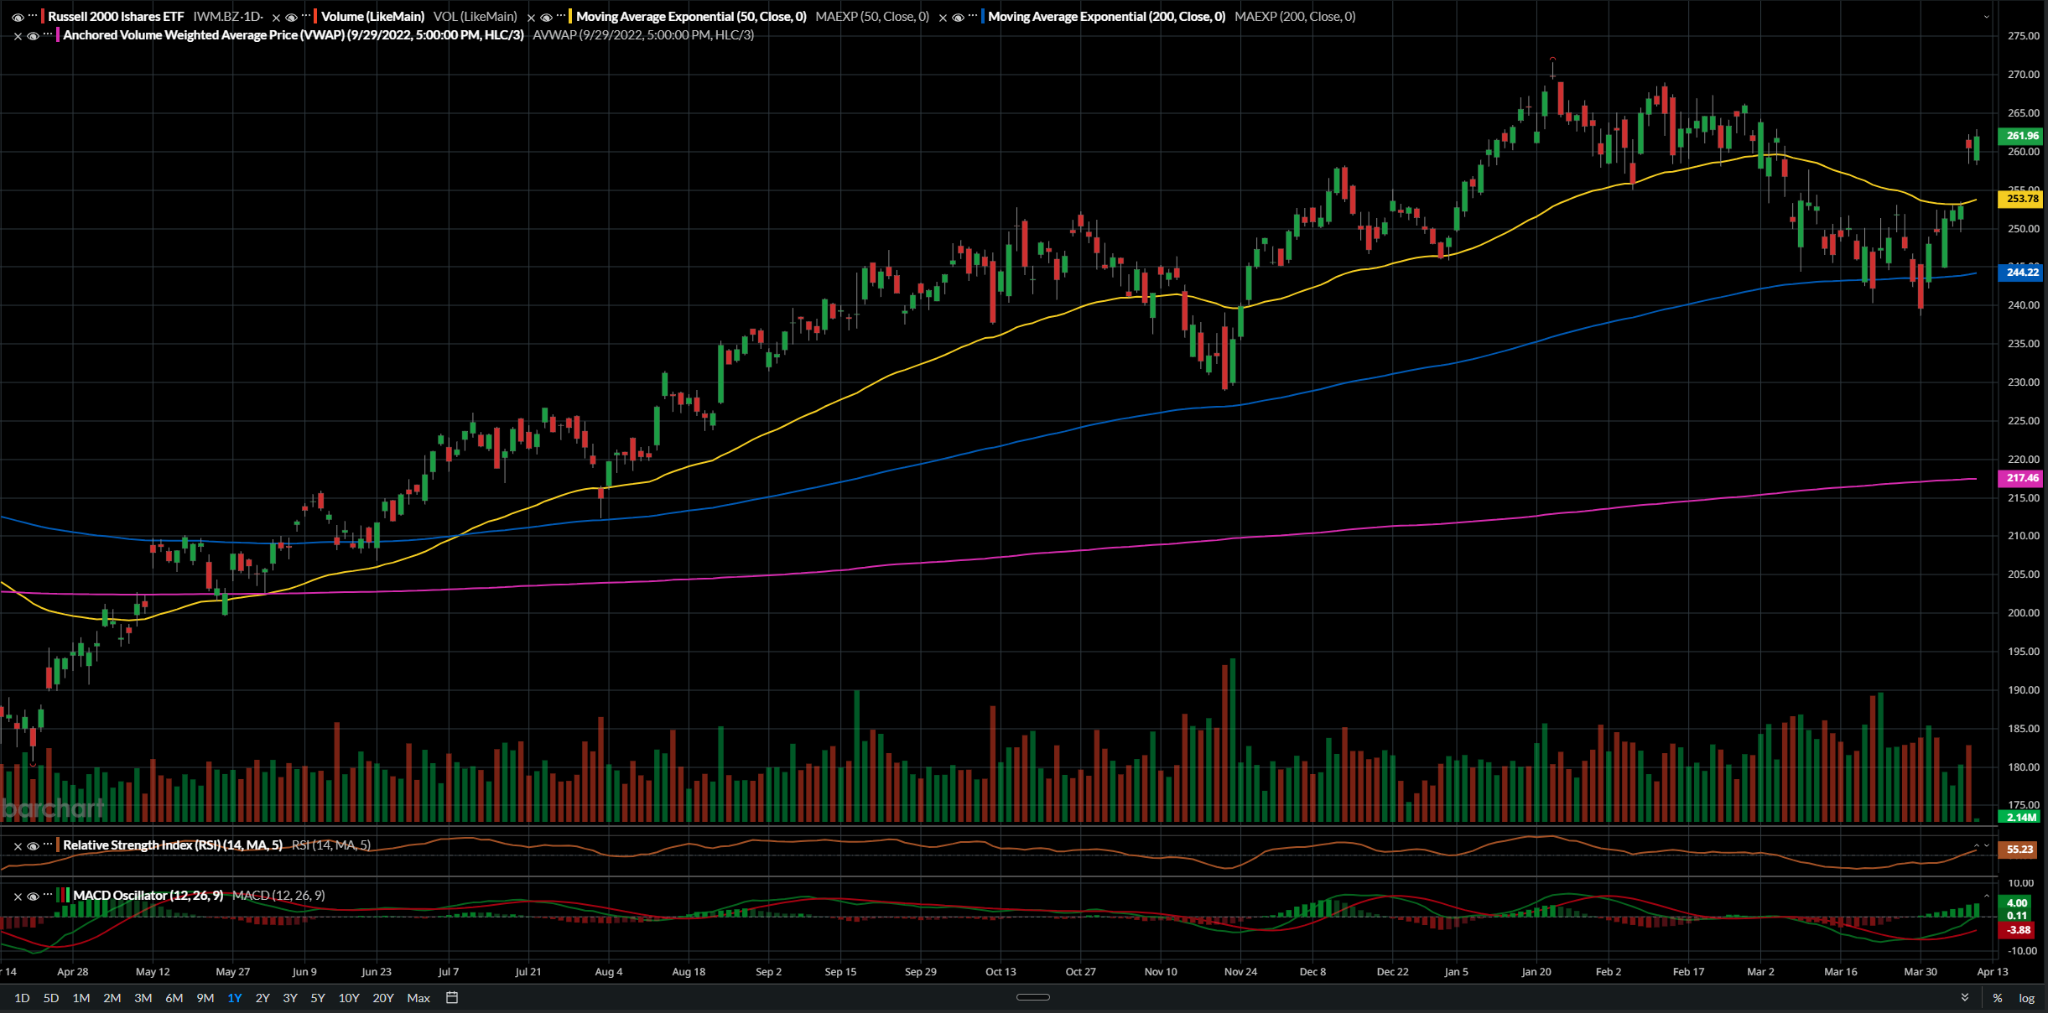
The immediate good news for those that are still bullish (as mentioned, I’m turning neutral) is that the 50-EMA has flipped to support, sitting at ~254 now. This is the most major support level below the current price, and a break below in the coming days would signal a firm denial of the breakout attempt. It would cause me to consider a short down to the next major support, the 200-EMA at ~245, which is where IWM bounced last time.
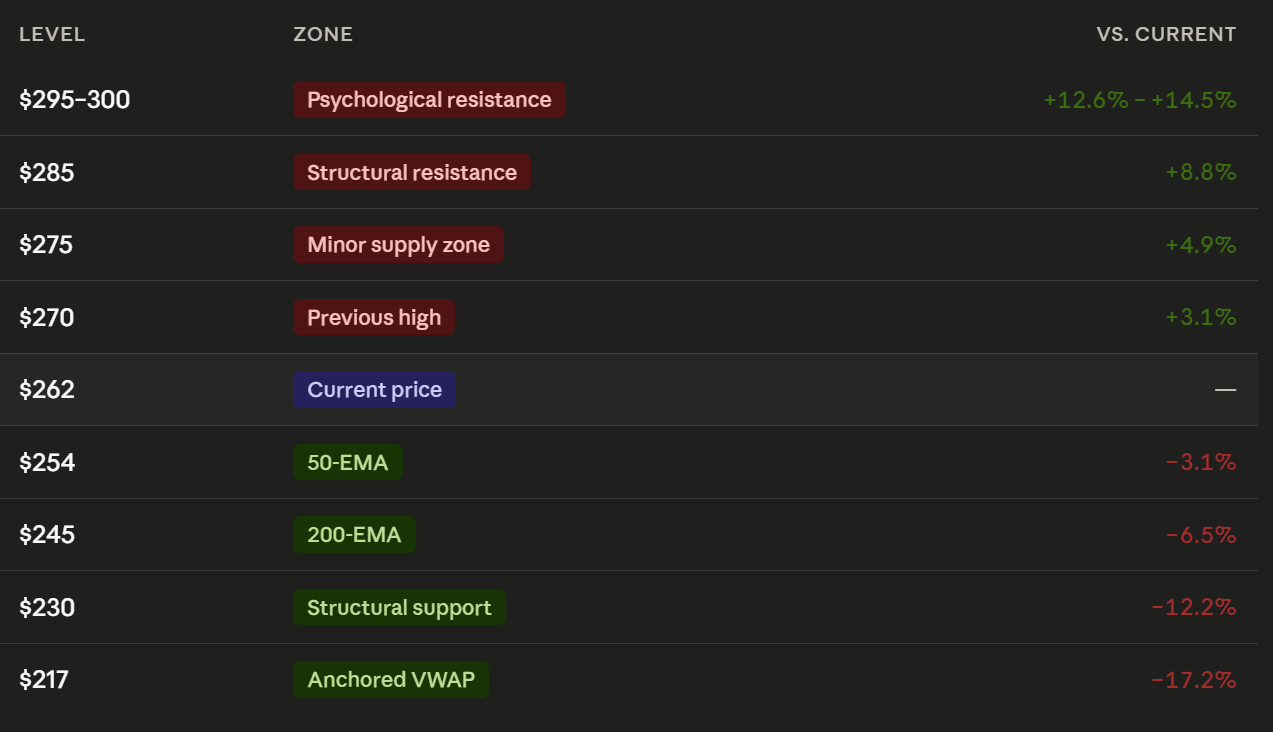
Should poor macro conditions put the brakes on IWM and force it back down below the 50-EMA, we return to our line-in-the-sand scenario with ~245 becoming a critical defense. Should that level not hold on the weekly candle, we would be breaking a significant trend, and it would be validation for a fall as low as ~230 or even ~217 before we hit the anchored VWAP. Below that, the lowest support is ~185, but that would require confirmation of oil shortages or something very dramatic by that point. Bulls would’ve completely cleared out, which is far from the current situation and unlikely given the current macro outlook.
Currently, bulls are looking to reclaim the old high of ~272, and following that, enter thin air. Above that level is uncharted territory, but we could expect a minor resistance at ~275, a supply zone, structural resistance levels at ~285, and psychological resistance levels at ~295-300.
This kind of movement is also unlikely without significant macro tailwinds, especially considering the price of oil, gasoline, and diesel, which fuel the small-cap economy.
Here are the key levels to watch:
Conclusion
The bulls delivered when they needed to with the Russell 2000. They held the line in the sand and reclaimed the validation just before gapping up and hitting levels that are ripe for taking profits. That means bulls will have to work overtime to get much further from here, and we stand very close to the previous high, about 3% away.
What comes next is murkier. The ceasefire deal has infused the market with hope, but that also means we could drop considerably should macro tailwinds become headwinds. The 50-EMA is now acting as support, and a fall would test it for the first time since breaking out. That is a pivotal moment, and a failure to hold is validation for a short position against the index. That is where I expect the index to go next, and the level I’m watching. Should small caps hold the 50-EMA or reclaim their hold high and break into the next resistance zone at ~275, I will re-evaluate. A breakout from those levels would mean the bulls have fully taken control, and we could drive all the way up to the ~285-300 level before we hit the next brick wall.
This is a setup that will reward patience. The low-hanging fruit, buying after a macro shock sent fear through the market and the technicals hit a multi-year support level, is behind us now. What lies ahead requires the bulls to keep up high volume and for the optimism priced into small caps to play out in geopolitics.
Remember that knowing when to step aside is just as important as knowing when to step in.