


Silver had one of the most explosive rallies in modern precious metals history last year, a 147% surge in 2025 that carried through and pushed silver to an all-time high of $121 earlier this year. Then it broke. Silver is now trading at $74, a ~32% drawdown from the peak, and the chart just delivered invalidation to the most recent breakout attempt. The fundamental case for silver is still intact. The supply deficit is estimated to be at 46.3 million ounces for 2026, marking the sixth consecutive annual deficit. Industrial demand keeps grinding higher, with solar panel manufacturing alone consuming roughly 16-20% of the annual global silver supply. Industrial demand is competing with bullion banks like J.P. Morgan, which has been buying and averaging $81/oz across 2026. None of that has changed with the selloff. What has changed is that the technical picture shows confidence is fading in the near term, and it looks like there may be more buying opportunities for the bullion banks ahead of us.
The Gold/Silver Ratio Has Meaningfully Changed
For most of 2025, silver’s dual identity as both a monetary and industrial metal was its biggest asset. It meant that for much of the year, as rose gold, silver was dragged along with it. Their pricing ratio is closely watched, and as gold continued to climb on its own merits, traders bought silver. The gold/silver ratio peaked above 100:1 in April 2025, one of the most extreme dislocations in the past 25 years. From that stretched starting point, silver had enormous catch-up room, and it took it. The ratio has since compressed to the low 60s, well below the modern long-term average around 70:1.
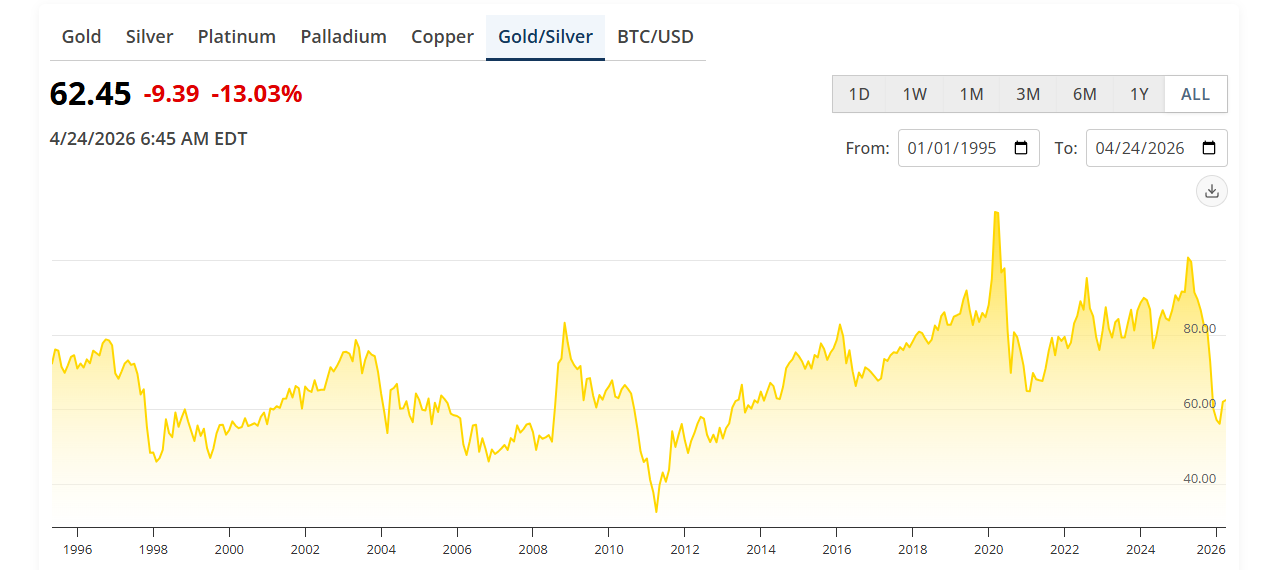
That compression matters because it removes the single most powerful tailwind silver had working in its favor. When gold gets expensive, investors looking for monetary hedges hunt for cheaper silver to stack. But now, even after the >30% sell-off, silver is still not nearly as cheap compared to gold as it used to be.
The trade was that silver was absurdly cheap relative to gold and will close the gap. That gap is now closed. At 62:1, silver is priced roughly in line with where it should be against gold in a normal precious metals regime. Silver will need to justify its own expenses now. It can do that, but the industrial picture needs to work out.
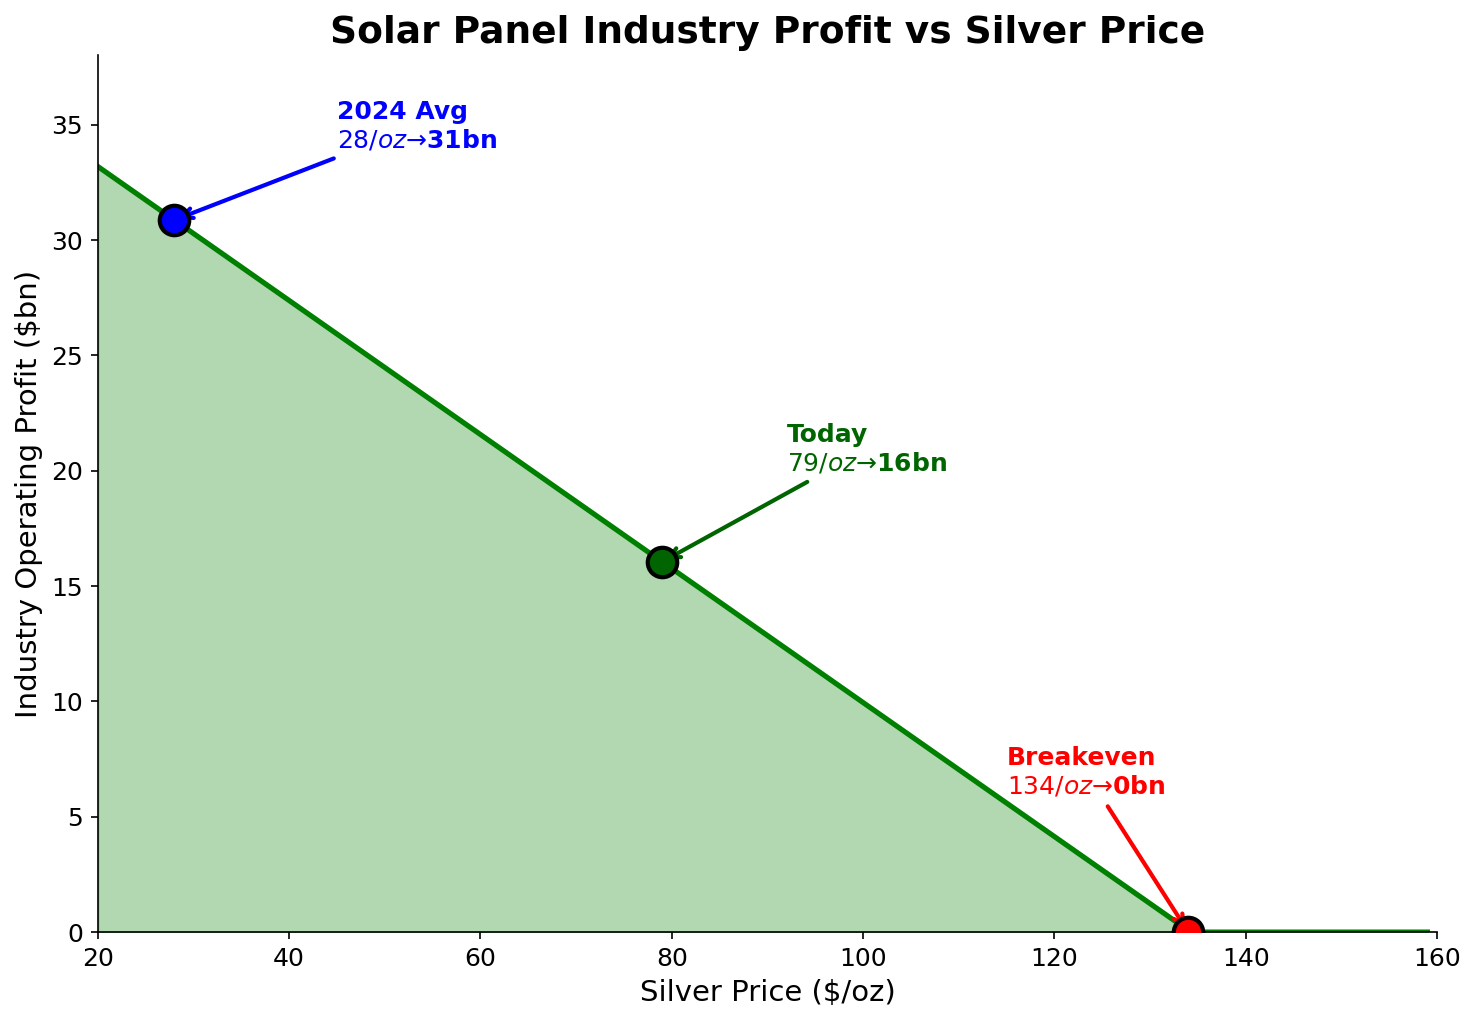
And it’s true that the supply deficit is real, but deficits have been the norm for five years running and silver still managed to fall 32% from the high. Solar demand is structural and lasting; nearly 10% of a solar panel by weight is just silver. But solar is also sensitive to Chinese panel manufacturing volumes, which have been volatile as they have tried to rein in overcapacity. The industrial demand story cuts both ways in a slowdown: if the global economy weakens, silver’s industrial component becomes a liability, not an asset. At $125/oz for silver, the conversion to using copper becomes reasonable and could cut into industrial demand. At $134/oz for silver, solar panel production becomes unprofitable. That’s a level that we could expect to see demand destruction, and while those are far away from the current price, it works as a spectrum; the higher the price, the less silver will be demanded.
Gold doesn’t have this problem. That’s the core reason gold has been more resilient in the recent sell-off. Gold is monetary first, industrial seldom; silver is both and that means it has structural factors affecting its demand that gold doesn’t contend with. Central banks don’t stack silver normally.
Silver’s breakdown also has to be understood against the monetary policy backdrop. The Fed’s recent shift toward higher-for-longer was ugly for non-yielding assets generally, but silver caught it harder than gold. Gold has a flight-to-safety bid from central banks that silver doesn’t share as neatly; silver’s buyers are industrial users, retail stackers, and speculators like bullion banks that can flip their exposure on a dime. None of these players have the same mandate to keep buying at any price like the People’s Bank of China does.
Put these together and it makes sense that at current levels, we would see some evidence of low demand. It led to the failed breakout, which has given way to a bearish read on the chart.
Silver Price Forecast
Every new Silver analysis as it publishes, today's technical signal and key levels, live price — on one page.
See all Silver forecasts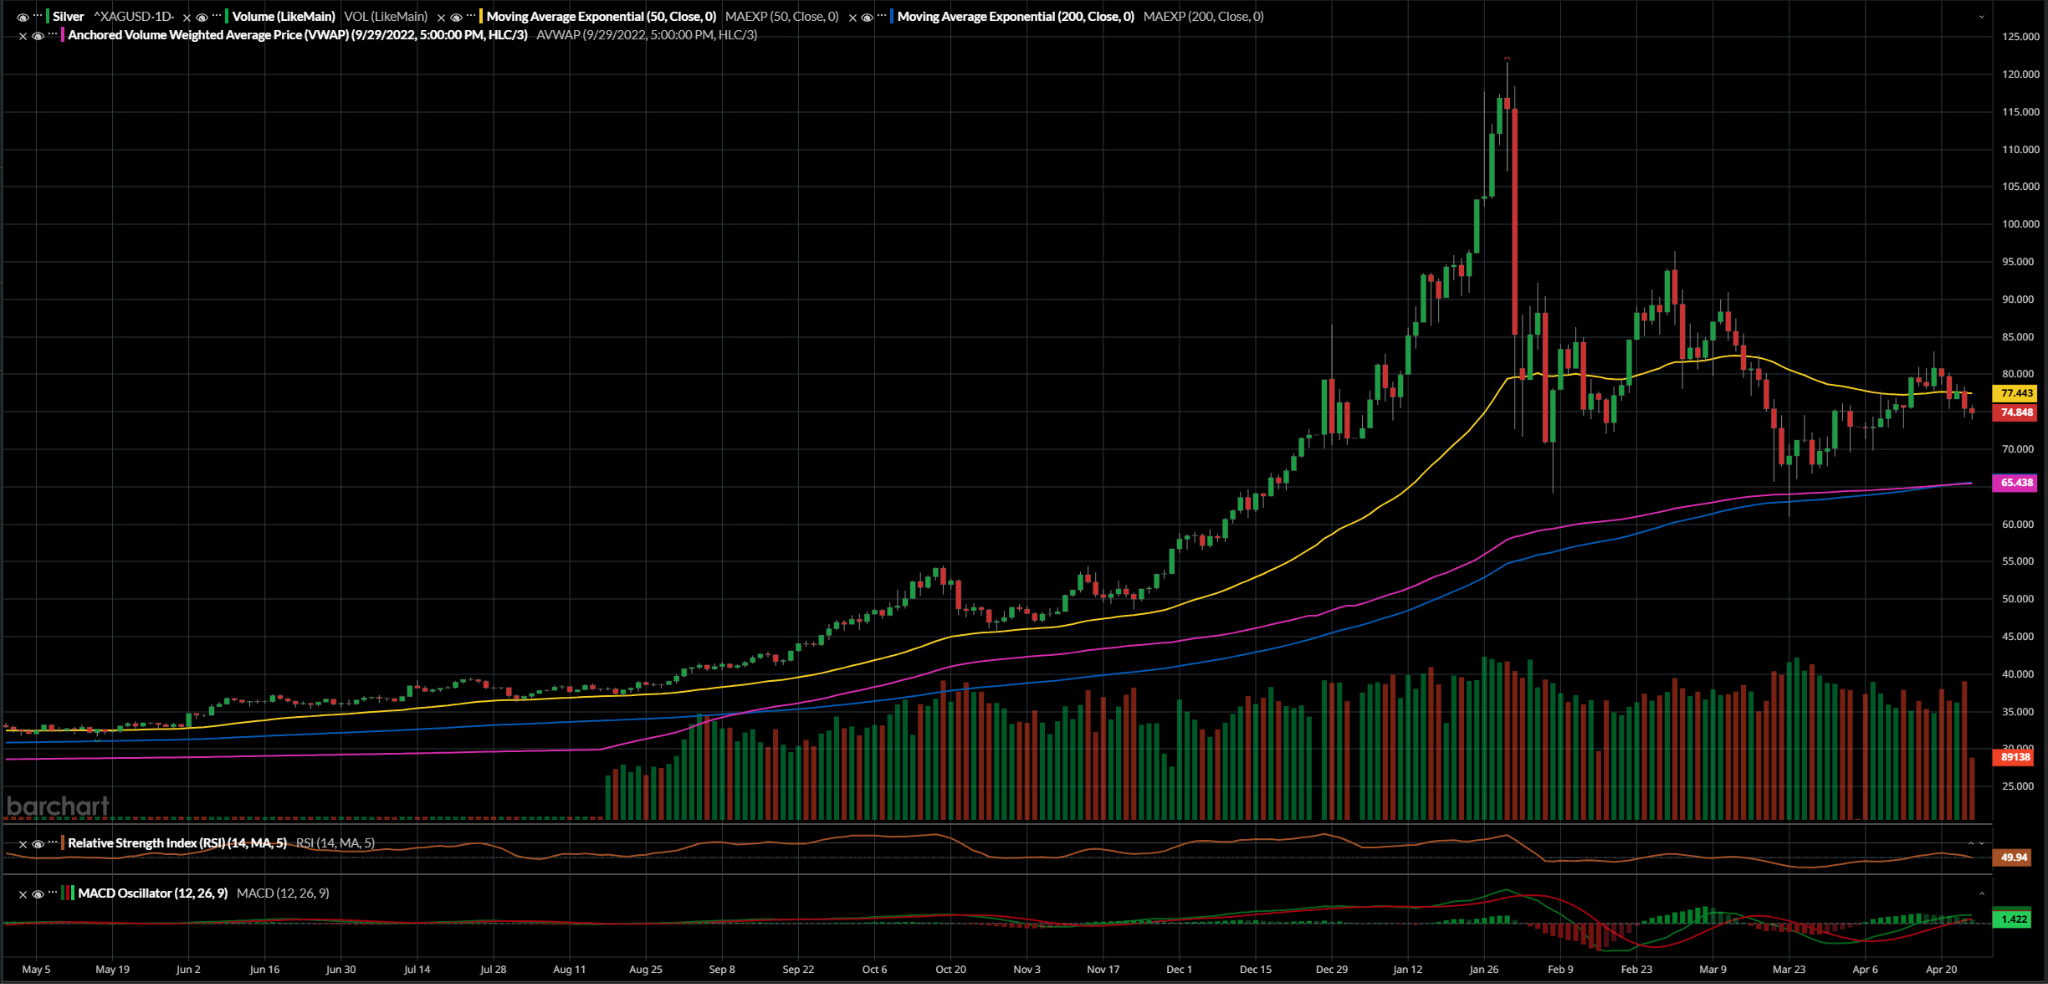
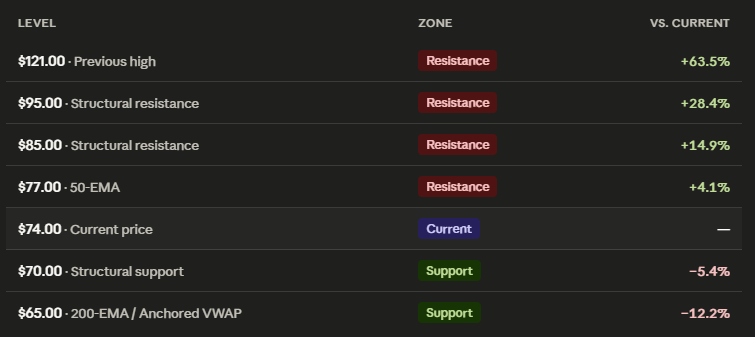
After bouncing off the 200-EMA and anchored VWAP cluster at ~65 in mid-March, silver ran up and broke out above the 50-EMA at ~77, which was a bullish signal. Volume didn’t hold up and the price has broken back below the 50-EMA, indicating invalidation and failure of the breakout.
That doesn’t mean we’re headed back to the institutional support cluster at ~65, but this chart does not make me bullish by any means. Momentum is rolling over, with the RSI falling below 50 (although barely) and the MACD winding down and starting to roll, but still mildly bullish. This is what the beginnings of a further break down look like. Without any major catalysts to drive silver, and the gold:silver ratio no longer a motivating factor to the same degree, we could be entering a range-bound period.
The next level to watch is ~70, a firm psychological barrier that has acted as support in the past, or if silver can break back above the 50-EMA at ~77. Above there, silver could run as high as ~85 before it hits any snags.
The 200-EMA and anchored VWAP clustered at ~65 is a very solid level for bulls to set longer-term entry prices at; those are institutional support indicators, and there is likely a lot of short covering and bullion bank buying at those levels.
Here are the key levels to watch:
Conclusion
Silver’s 2025 rally was record-breaking, but the trade that worked then isn’t the trade on the table now. The gold/silver ratio has already compressed to the low 60s, which means the mean-reversion tailwind that fueled most of last year’s outperformance is muted. From here, silver has to stand on its own fundamentals, and those fundamentals are real but slower-moving; they’re tied to industrial demand. The structural factors that support silver are still present, but the price has now climbed so far that we faced demand destruction at the peaks in January.
The chart is telling me to be patient. Silver is more likely to chop in a range between the $65 support cluster and the $77 resistance than it is to make a decisive move in either direction without a fresh catalyst. The chart looks entirely range-bound to me. The bullion banks know this, and it’s why I expect any meaningful weakness toward the 200-EMA at ~$65 to be met with aggressive buying. That’s where I’d want to enter.
Prudent traders won’t chase silver here. If you missed the bottom of the channel in March, don’t force an entry now. A reclaim of the 50-EMA at $77 with volume would be the signal that the trend has resumed, and from there, ~$85 and the old ~$95 structural zone come back into play. Above that, the old high is a long way away, but the fundamental scaffolding to get there eventually is intact.