


Silver (XAG) prices remain under pressure as U.S. dollar and Treasury yields continue to rise. The renewed tensions between the US and Iran have pushed oil prices higher and increased the market uncertainty. This has resulted in another sell-off in metals. But the bigger picture for silver remains bullish. In my view, the current decline may be the final stage of correction before a stronger rally begins. The $50 to $60 area remains the key buy zone and a move toward $50 could complete the bottom formation and initiate a rally to $90.
Middle East Tensions Keep Oil Risk Alive
The latest U.S. strikes against Iran indicate that the conflict continues despite the ceasefire agreement. The strikes were in response to the Iranian attacks on commercial vessels transiting through the Strait of Hormuz, according to U.S. Central Command. Iranian television also reported explosions in Sirik and Bandar Abbas. This holds the market to energy security and shipping risk.
The oil prices responded quickly as the Strait of Hormuz is one of the most important energy chokepoints in the world. The current rally in oil prices does not present the crude supply shortage. It is reflection of fear, uncertainty and risk of another disruption. Oil prices may continue to rally if the Strait of Hormuz is again closed. This would raise inflation fears and put pressure on global markets.
The U.S. has now removed temporary relief on Iranian oil sanctions. This introduces more pressure on Iran and makes situation more uncertain. Previously, Iran had time until August 21 to complete some oil and petroleum deals. But now U.S. wants those deals closed by July 17. Iran is not happy with this decision and says that it breaks the agreement. This shows that the ceasefire remains weak and the risk of renewed tension is rising again.
Strong Dollar and Yields Pressure Silver Near Buy Zone
The increase in oil prices has the potential to raise Treasury yields and the U.S. dollar. The 10-year Treasury yield has broken above 4.5% and looks to gain momentum towards 4.7%.
Silver Price Forecast
Every new Silver analysis as it publishes, today's technical signal and key levels, live price — on one page.
See all Silver forecasts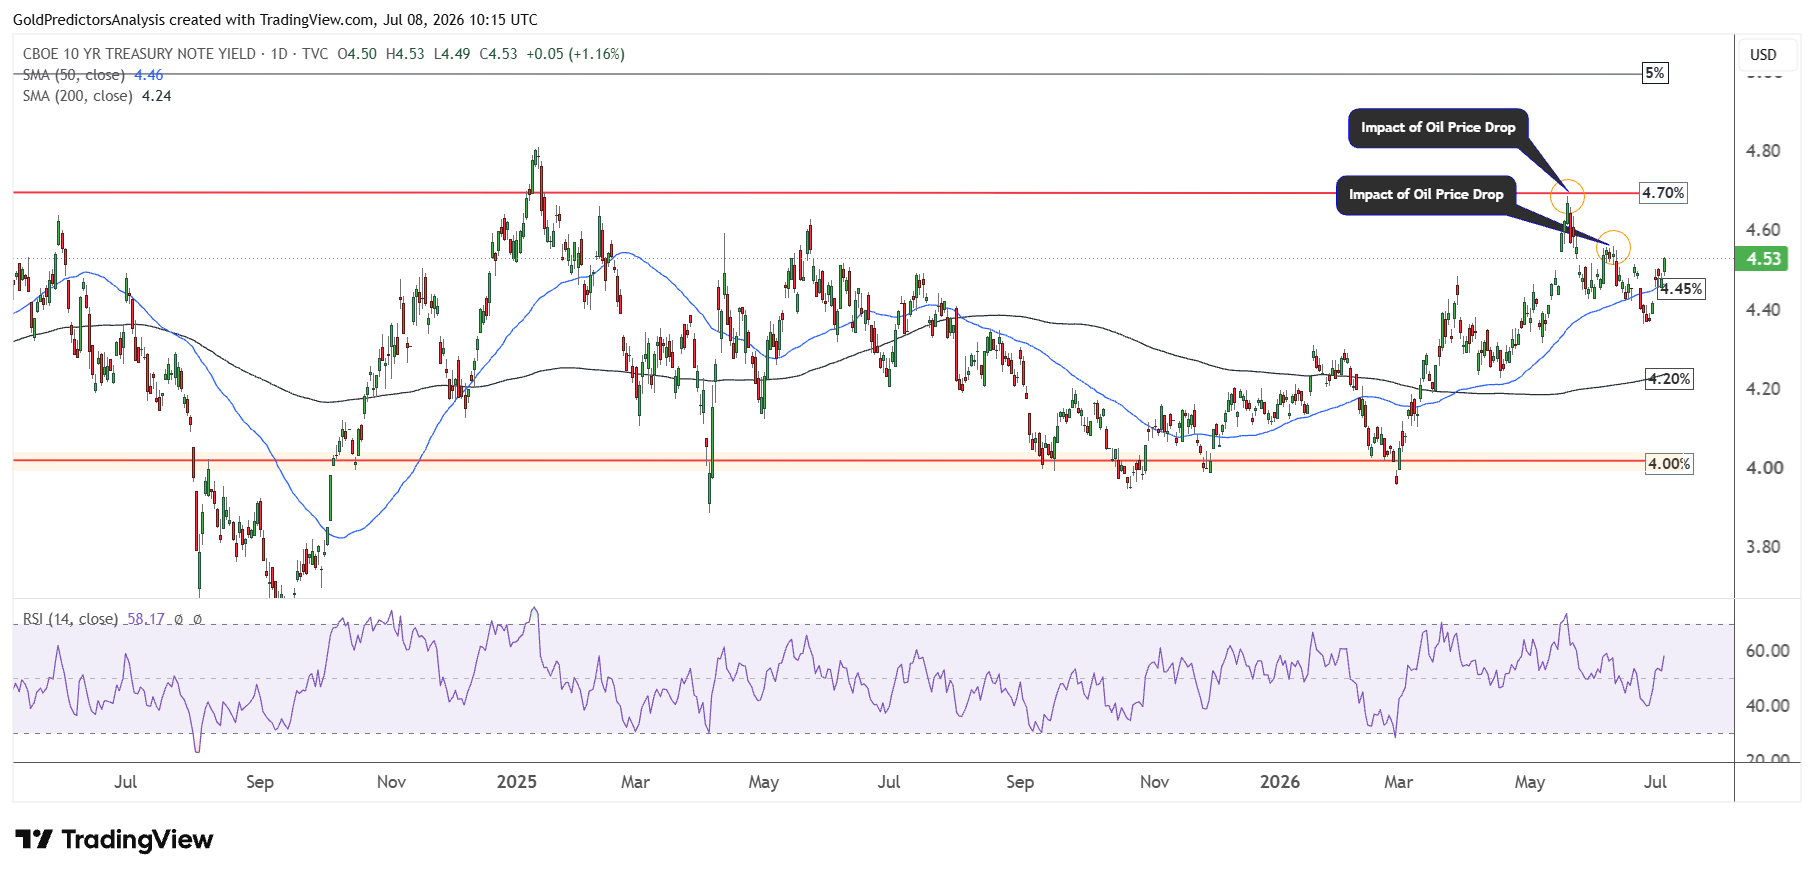
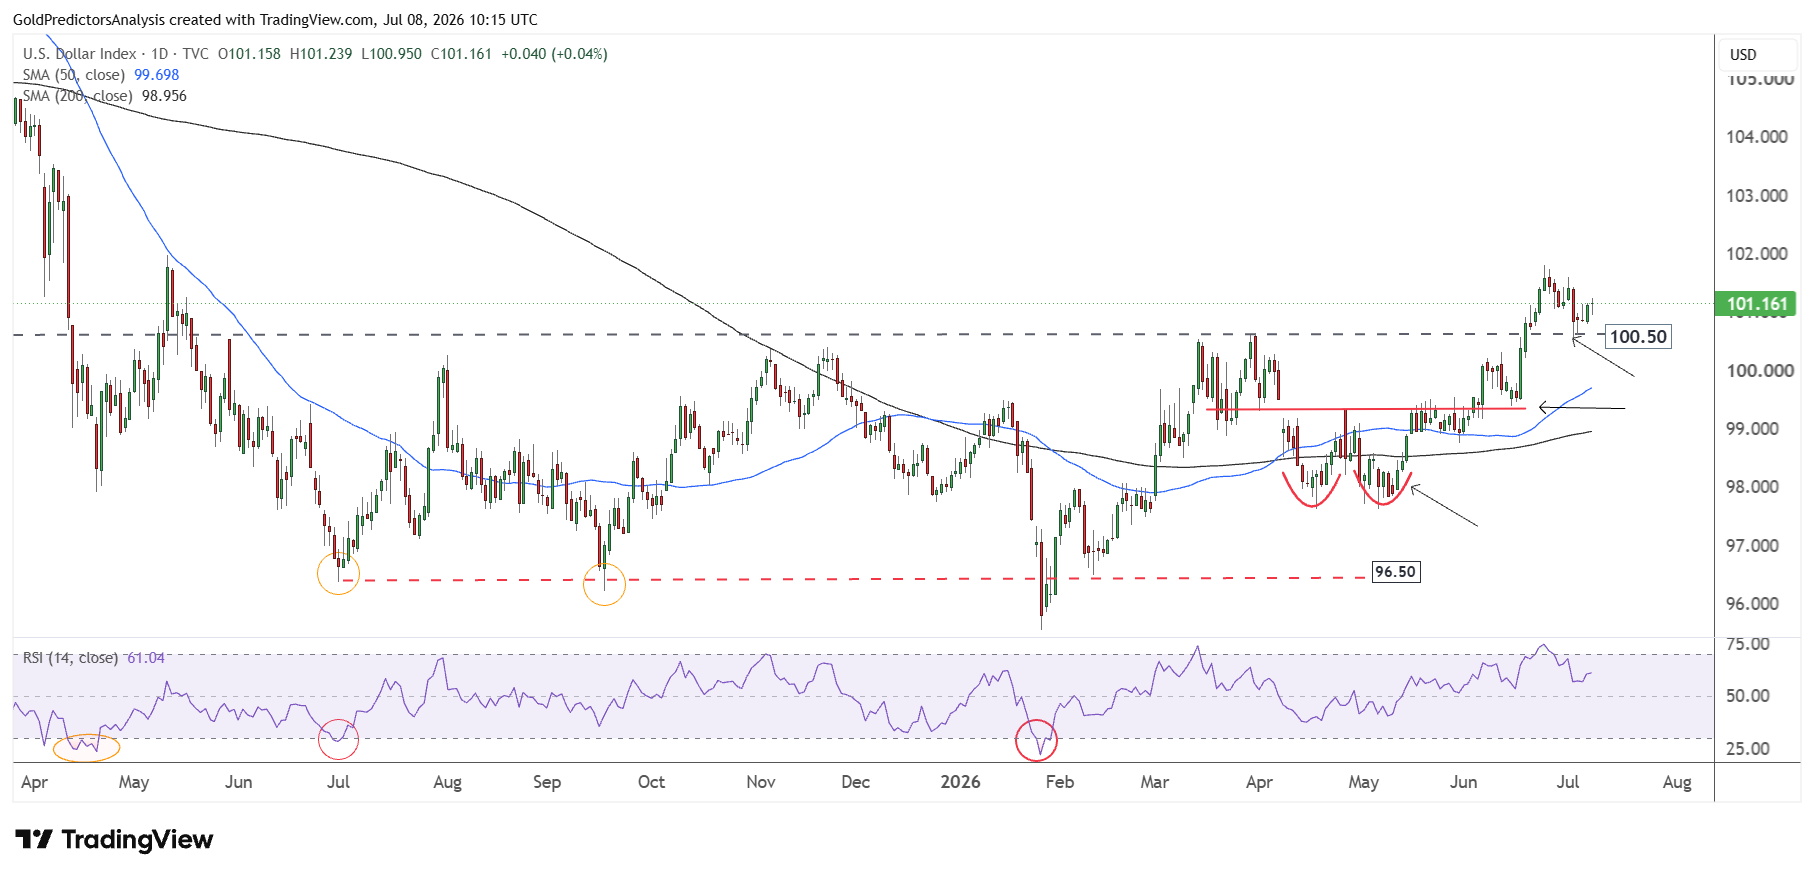
The US dollar index also holds the support of 100.50 and continues to rally towards the 104 level. The chart below shows that the breakout in the US dollar index at 100.50 was strong and points to higher prices as the double bottom pattern holds. A strong dollar puts pressure on metals in the short term as they become more expensive for buyers.
Gold (XAU) price also continues to drop after failing to break above $4,200. Despite this short term weakness in metals, the overall trend for silver is positive, and this correction will offer a strong buying opportunity.
In my opinion, this decline should be watched closely. The war risk is still alive but the short term strength in US Treasury yields and US dollar index indicates that silver may set up the final drop before the next rally. When the silver price nears the major bottom, it usually performs the bottom formation process by consolidating at lower levels. This means that the current drop within the major support zones could be the foundation for the next potential bull market move.
Silver Long-Term Trend Remains Bullish Inside Rising Channel
The long-term outlook for spot silver remains strongly bullish as the price has been trading within the ascending channel. The recent drop in silver prices from January 2026 was due to the achievement of strong target at $120. This target is seen in the ascending channel pattern that is stretched from the May 2004 lows.
After hitting this target, silver prices produced sharp shadows on the monthly candles of January and May 2026. These sharp shadows indicate that the silver price remains negative in the short term. Moreover, the monthly candle for June was negative and closed below $60. This suggests that July will likely be negative as well.
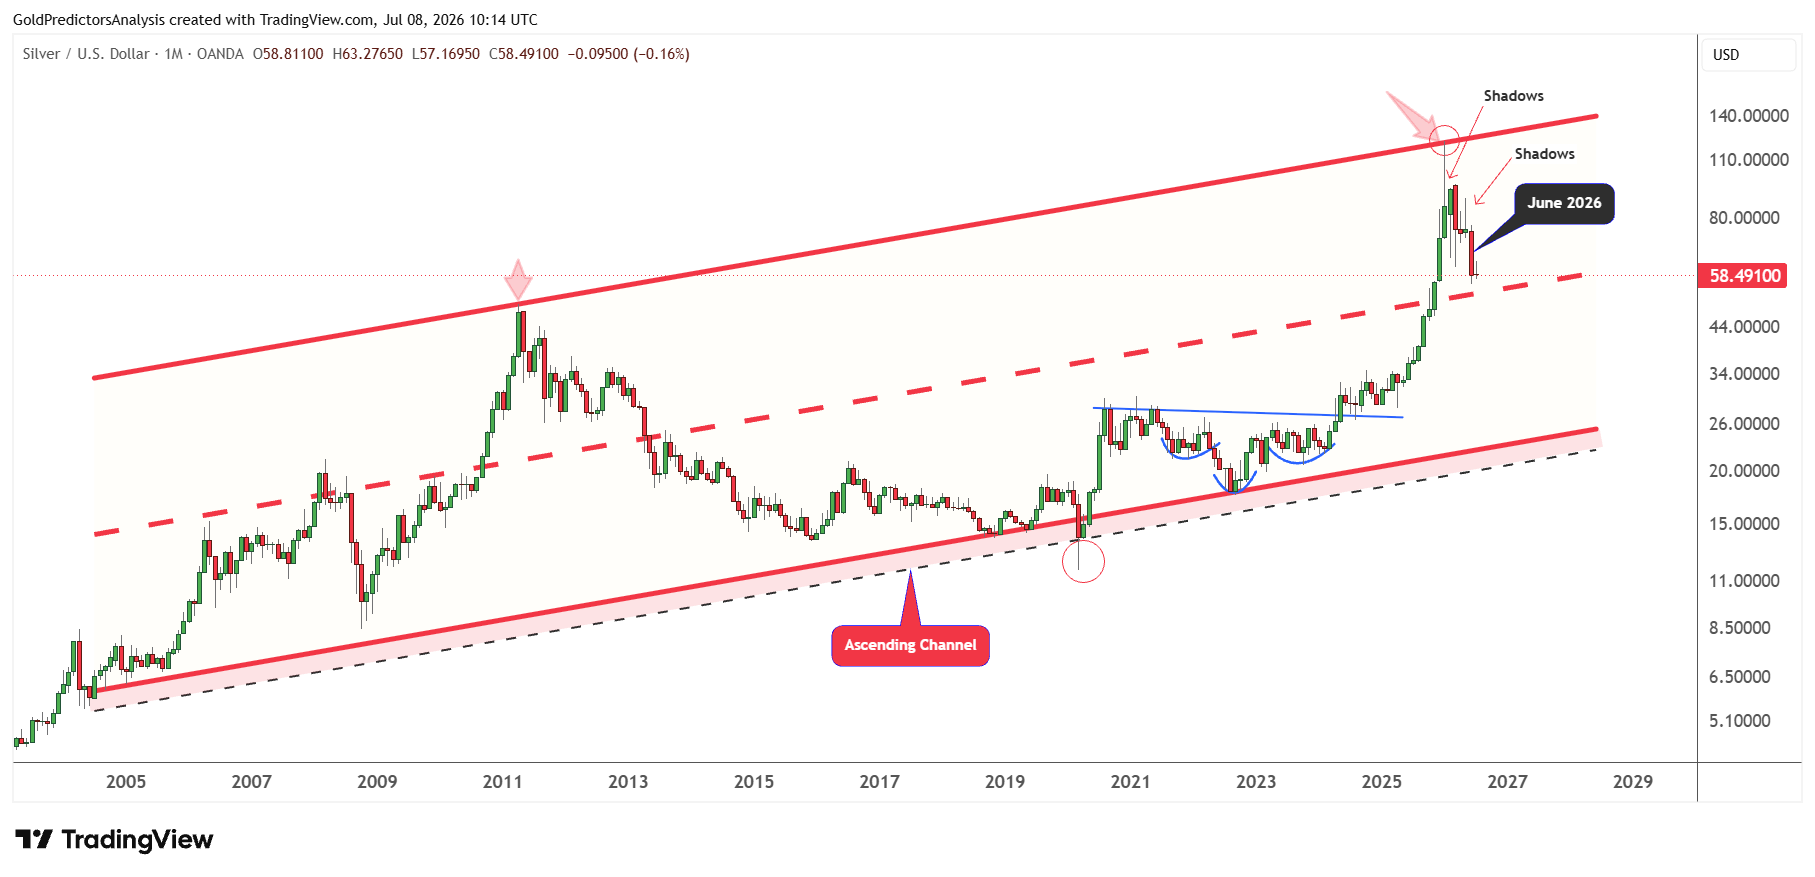
However, the emergence of an inverted head and shoulders pattern from 2021 to 2024 suggests that this silver price correction within the ascending channel pattern will likely be completed soon. Once this correction is over, the next relief will likely begin back towards the $120 area.
Silver Short-Term Setup Points to $50 Buy Zone
In the short term, silver prices have entered the strong buy zone, as seen in the weekly charts below. This buy zone is marked as the green highlighted region, where the price trades between $45 and $60.
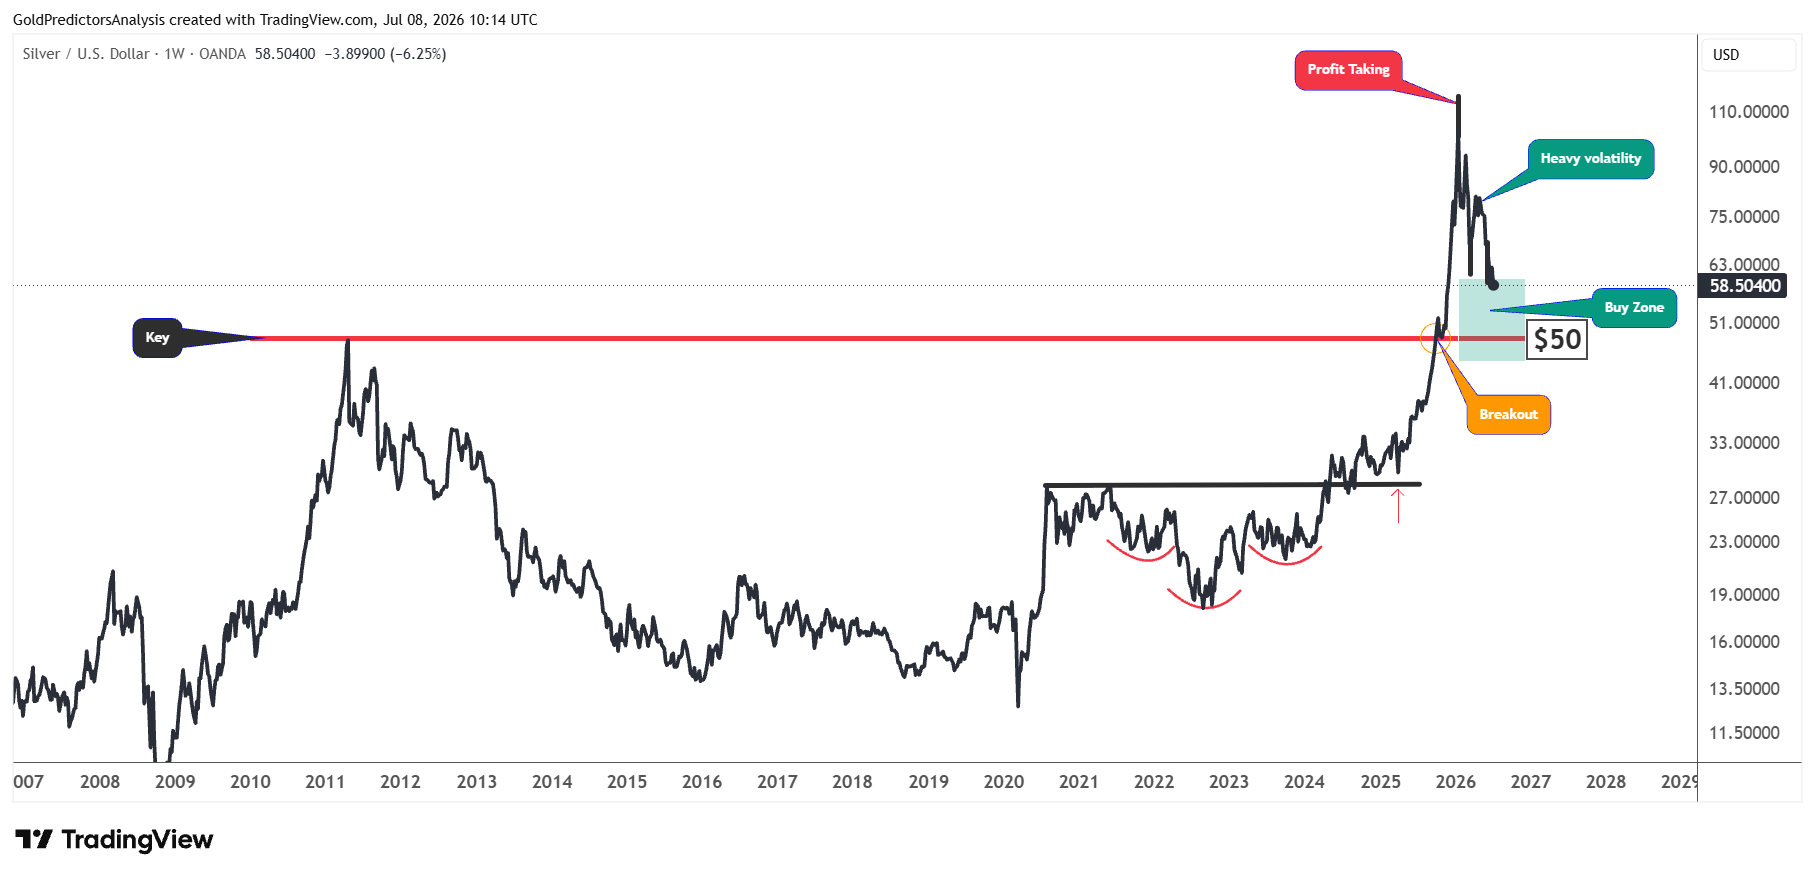
The silver price is still within the upper boundary of the buy zone, which ranges from $55 and $60. However, a push slightly lower toward the $50 area will likely hit the ideal level of this buy zone, which may trigger a strong rally in silver prices again in the second half of 2026.
The analysis below was discussed a few weeks ago when the silver price was trading around $90. The price hit my targeted zone of $50-$60 as per expectations. Now the price is attempting to form a bottom. For this bottom formation process, the price must dip to a final low before a reversal.
The chart shows the formation of bull flag patterns. This pattern is valid until the silver price holds above the $45. A break above $90 will confirm that the bottom formation is complete and it will trigger a strong surge.
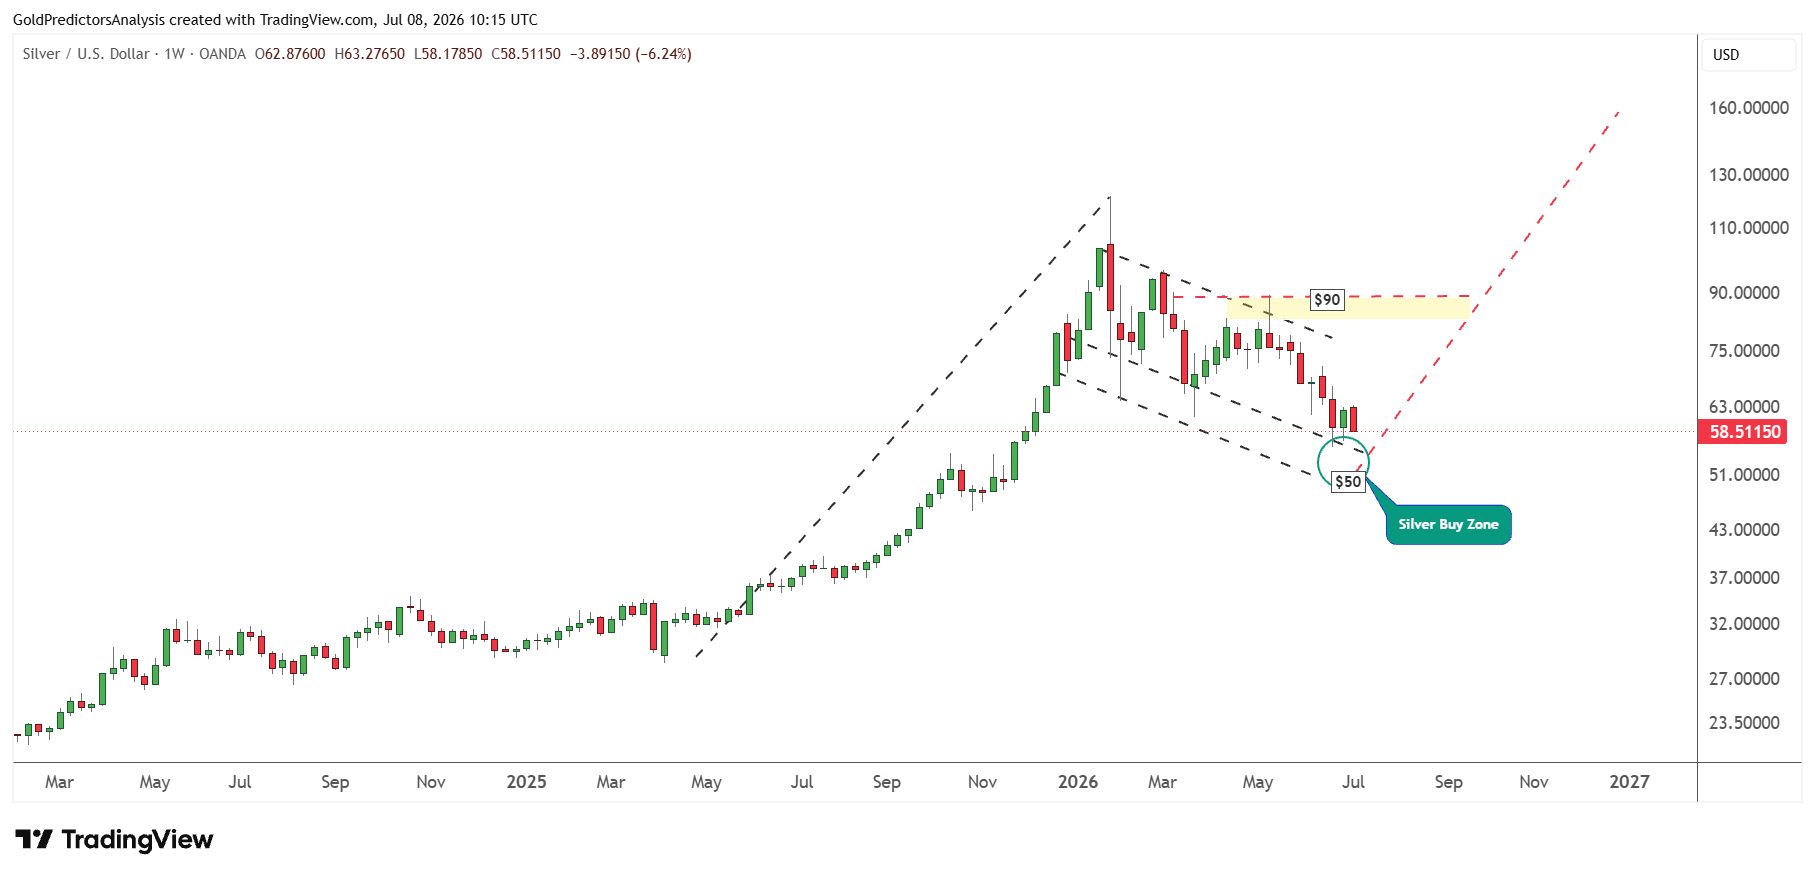
A break above $90 will indicate that the bottom is formed and silver prices will again rally to mark new record highs.
The short-term outlook for silver shows consolidation. These consolidations are forming a price compression pattern within the wedge on the 4-hour chart.
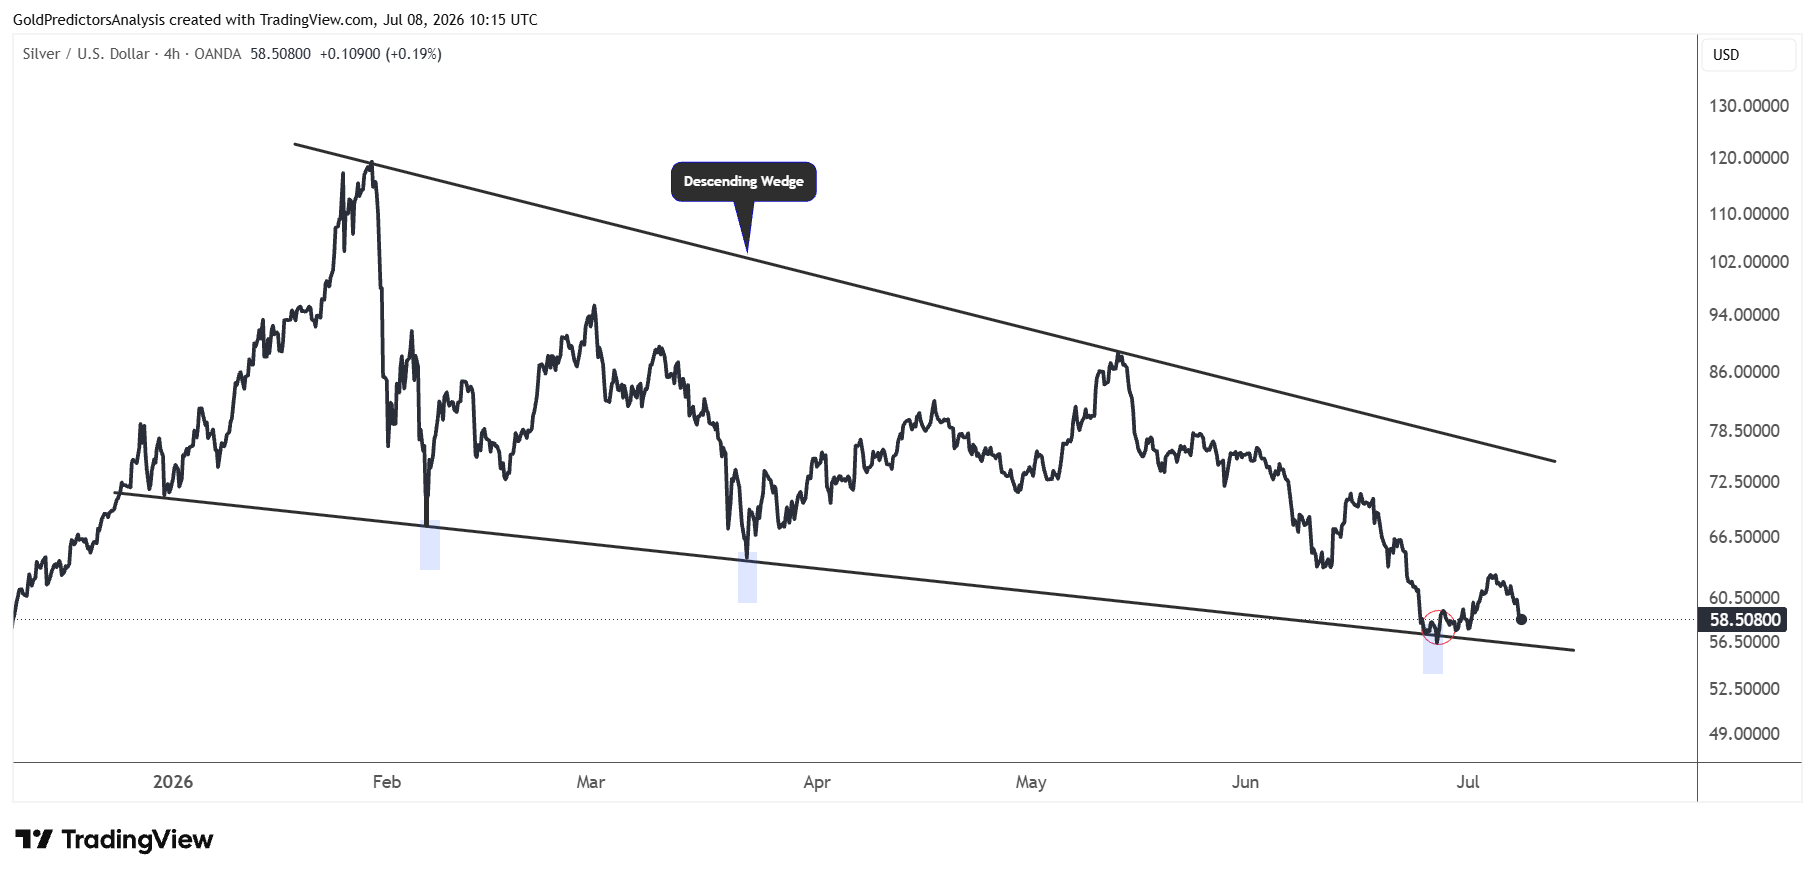
A break below $55 will likely push silver prices toward $50. However, a strong rebound from the $50 to $55 area is likely. The important resistance in spot silver remains the $72 area. A break above $72 will likely push spot silver toward $90.
Silver Price Risks from Dollar Strength and Middle East Tensions
A major risk to silver is the strengthening U.S. dollar and rising interest rates. Silver could remain under pressure if the US dollar index remains above the breakout level of 100.50. The rebound in silver may further be delayed if the US Treasury yields continue to rally to 4.7%.
The other risk comes from the Middle East war. As tensions escalate and oil prices continue to climb, the prospect of rising inflation may again become a concern. This can be a boon for the dollar and a negative for metals in the short term. A break below $45 in the spot silver market will invalidate the bull flag configuration and indicate further correction.
Final Words on Silver Bottom
The US dollar and Treasury yields are rising and putting short-term pressure on silver prices. The renewed tensions between the US and Iran have lifted oil prices and increased the market uncertainty. This has sparked another round of metal sell-off. But this weakness will likely be the last push to the bottom rather than the beginning of a new bear market. The $50-$60 range remains the critical buying zone. A dip towards $50 could complete the correction and set the market for the next rally.
The silver prices remain healthy within the ascending channel pattern and form the bull flag within this channel. As long as the spot silver price holds $45, the next move in silver will likely be higher. A break above $72 is required to add further strength in the silver market to push the price to $90. A break above $90 will confirm the bottom and commence the next major rally to new record highs.
Read more: Oil Spike and Strong Dollar Pressure Gold and Silver