


Silver (XAG) prices remain under pressure as the market reacts to a hawkish Fed, rising Treasury yields and a stronger U.S. dollar. The easing of Middle East tensions has reduced some safe-haven demand while weak freight and trucking data continue to signal caution in the real economy. But the spot silver price is holding the long term support zone of $50-$60. This article presents the macro backdrop, freight and trucking signals, and US Treasury yield and US dollar movements after the Fed decision to understand the next move in silver prices.
Fed, Yields, and Dollar Pressure Silver Near $60 Support
Silver prices are reacting to two opposite forces. One is the Fed’s hawkish mood. The second is the Middle East risk that has reduced following the agreement of the U.S. and Iran to an interim peace framework. The combination of this mix ensures that silver remains volatile as traders trade with lower fear of geopolitical events on one hand and the risk of higher interest rates on the other.
The Fed kept the interest rates unchanged but it did not issue a dovish message to the market. Policymakers suggested that rates could be increased again later this year if inflation proves sticky. This is important for silver because this statement supports the Treasury yields and the US dollar. The strength in these markets put downward pressure on precious metals.
Treasury Yields Rebound After Fed Decision
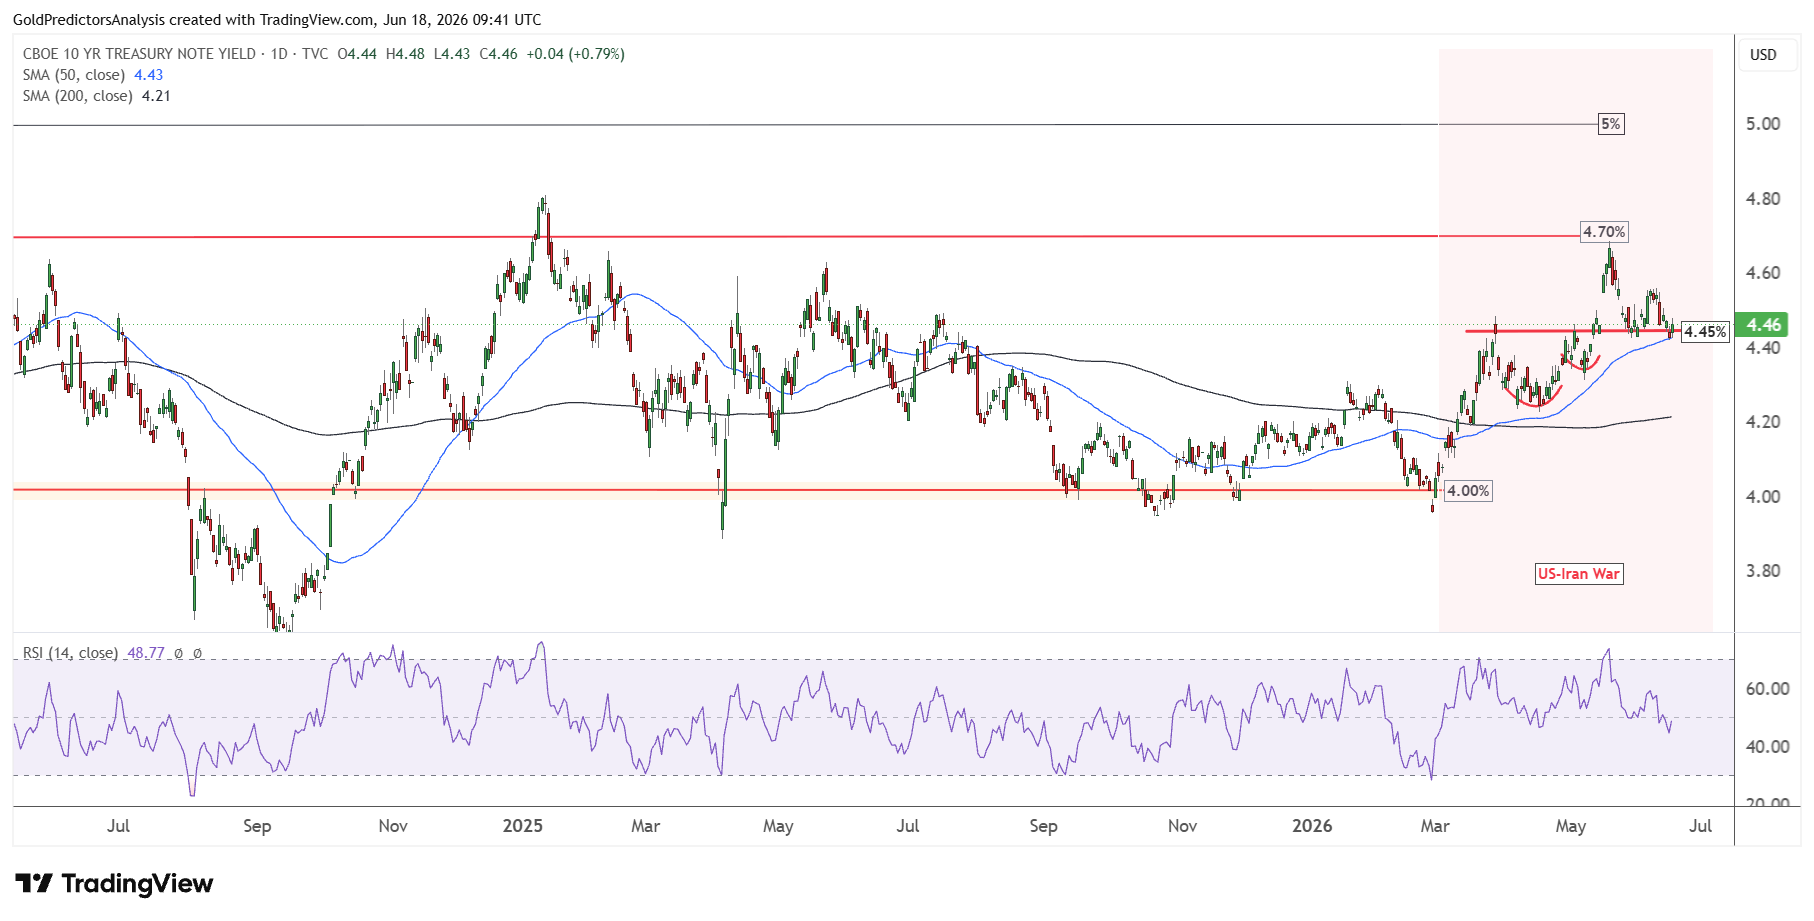
The 10-year US Treasury Yields rebounded from the support zone following the Fed decision. The chart below shows that this rebound in the US Treasury yields developed after it hit the 50-day SMA. The formation of a cup and handle pattern on the daily chart suggests a bullish trend to 4.75% as long as it holds the 4.43% support.
Silver Price Forecast
Every new Silver analysis as it publishes, today's technical signal and key levels, live price — on one page.
See all Silver forecastsOn the other hand, the 2-year Treasury yields surged to 4.18%
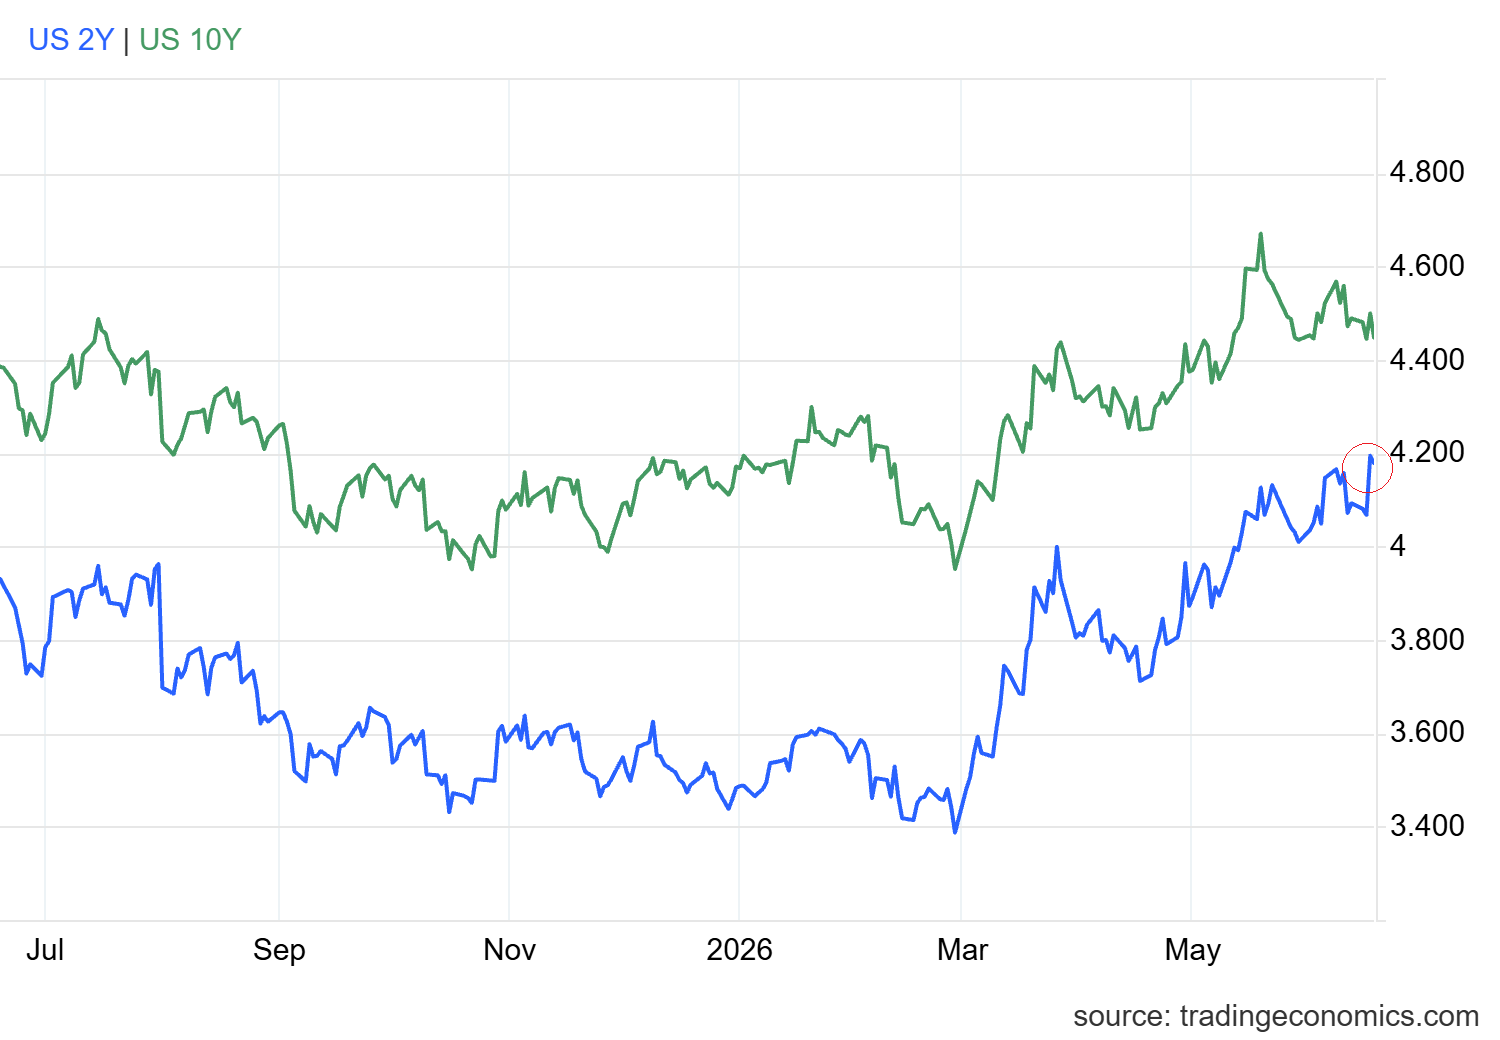
This increase in short-term yields reflects a tightening of the markets’ policy path. This is crucial for silver as the higher yields increase the opportunity cost of holding metals. When investors can get better returns from cash and bonds, they will be less inclined to buy silver unless there is renewed interest in demand from inflation fears.
U.S. Dollar Strength Caps Silver Price Gains
The Fed’s tone was also positive for the U.S. Dollar. The strength of the US dollar can limit the silver price gains in the short term. Thus, silver requires a weaker dollar or stronger safe haven buying to make a better upside move.
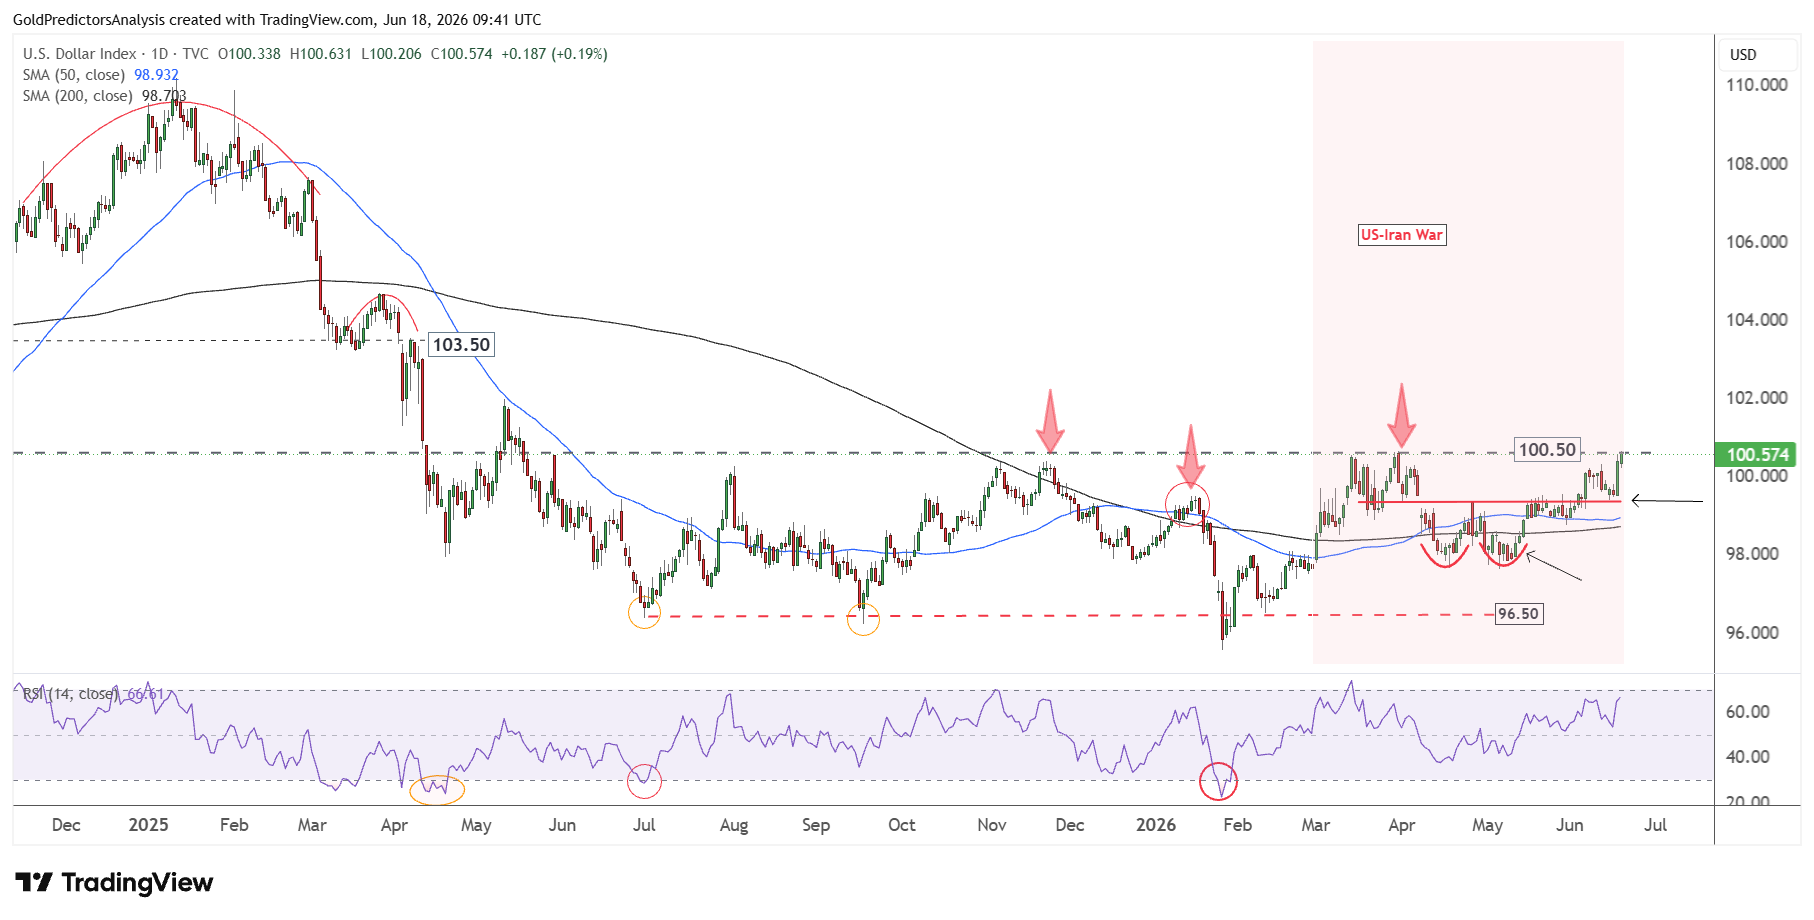
The chart below shows that the US dollar surged after the Fed’s interest rate decision towards the resistance level of 100.50. The US dollar index formed a double bottom above 97.70, which indicates positive price action.
U.S.-Iran Peace Deal Reduces Safe-Haven Demand
Meanwhile, the U.S.-Iran interim peace deal has dampened oil prices. The drop in oil prices diminishes the immediate threat of an energy inflation shock. This can help risk sentiment, but also takes a portion of the panic bid out of precious metals. While inflation pressure may still be positive factor for silver, the initial reaction is mixed as safe haven demand becomes less urgent.
I believe the macro is not all bearish for silver, but it’s more selective. The Fed’s hawkish message is definitely a headwind. But silver is still holding steady as the market is not yet giving up on precious metals. Inflation is still too high, policy uncertainty is high and traders are still waiting for a signal to look at the dollar, yields and oil.
The next move in silver will depend on whether or not yields continue to rise. If the Treasury yields and the US dollar remain strong, silver could struggle to break higher and may come under pressure. But if the oil weakness dampens the inflationary concerns and the dollar begins to wane, silver could move quickly in the opposite direction. That places the prevailing macro setting to the test as to whether silver can continue to maintain its bullish formation in the face of a tighter Fed.
Freight and Trucking Data Signal Caution for Silver
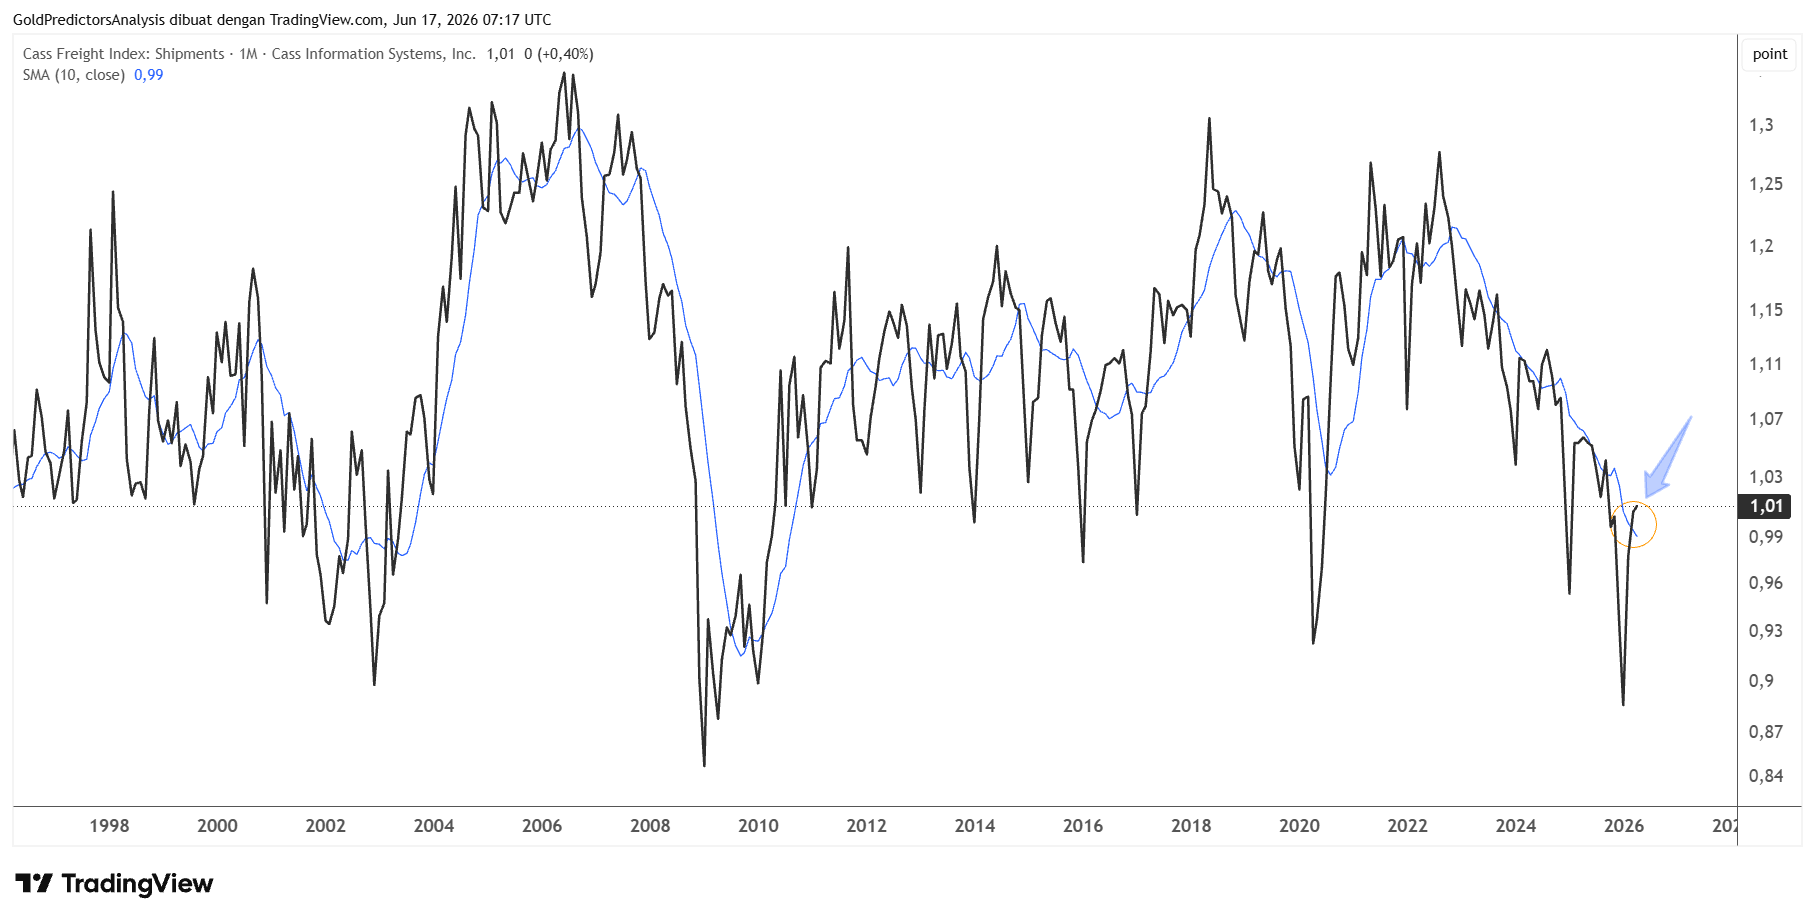
The freight activity indicates the real economy is still not sending a strong risk-on signal. The Cass Freight Shipments Index shows the short term recovery in shipping activity. But the 10-month moving average is trending downwards. This is important because freight activity is an indicator of the flow of goods in the economy. Weaker shipments on a longer-term trend are an indicator of reduced demand. This diminishes business activity and creates a less buoyant economic environment.
The same message is conveyed by heavy truck sales. The 10-month average is trending downwards in April 2026 which indicates a risk-off signal. Transportation/truck sales activity is a sign of confidence in transportation, logistics and other industrial demand. Slowdowns in heavy truck buying signal lower freight demand expectations in the future. This undermines the prospects for the industrial metals and can cap the upside potential for silver as it is also an industrial metal.
This creates a mixed setup for silver prices. The weaker freight and truck data could benefit the safe haven demand. But it can also squeeze silver via the industrial demand channel. If the economic growth rate declines, the demand from manufacturing industries, electronics and solar-related businesses could decline.
Silver Rebound from Buy Zone is Restricted
The long term price structure for spot silver remains strongly bullish despite the 50% drop from record highs in 2026. The chart below shows that the silver price has reached the upper end of the previously discussed buy zone. This buy zone lies between $45 and $60 which has the potential to trigger a strong surge in silver to $300.
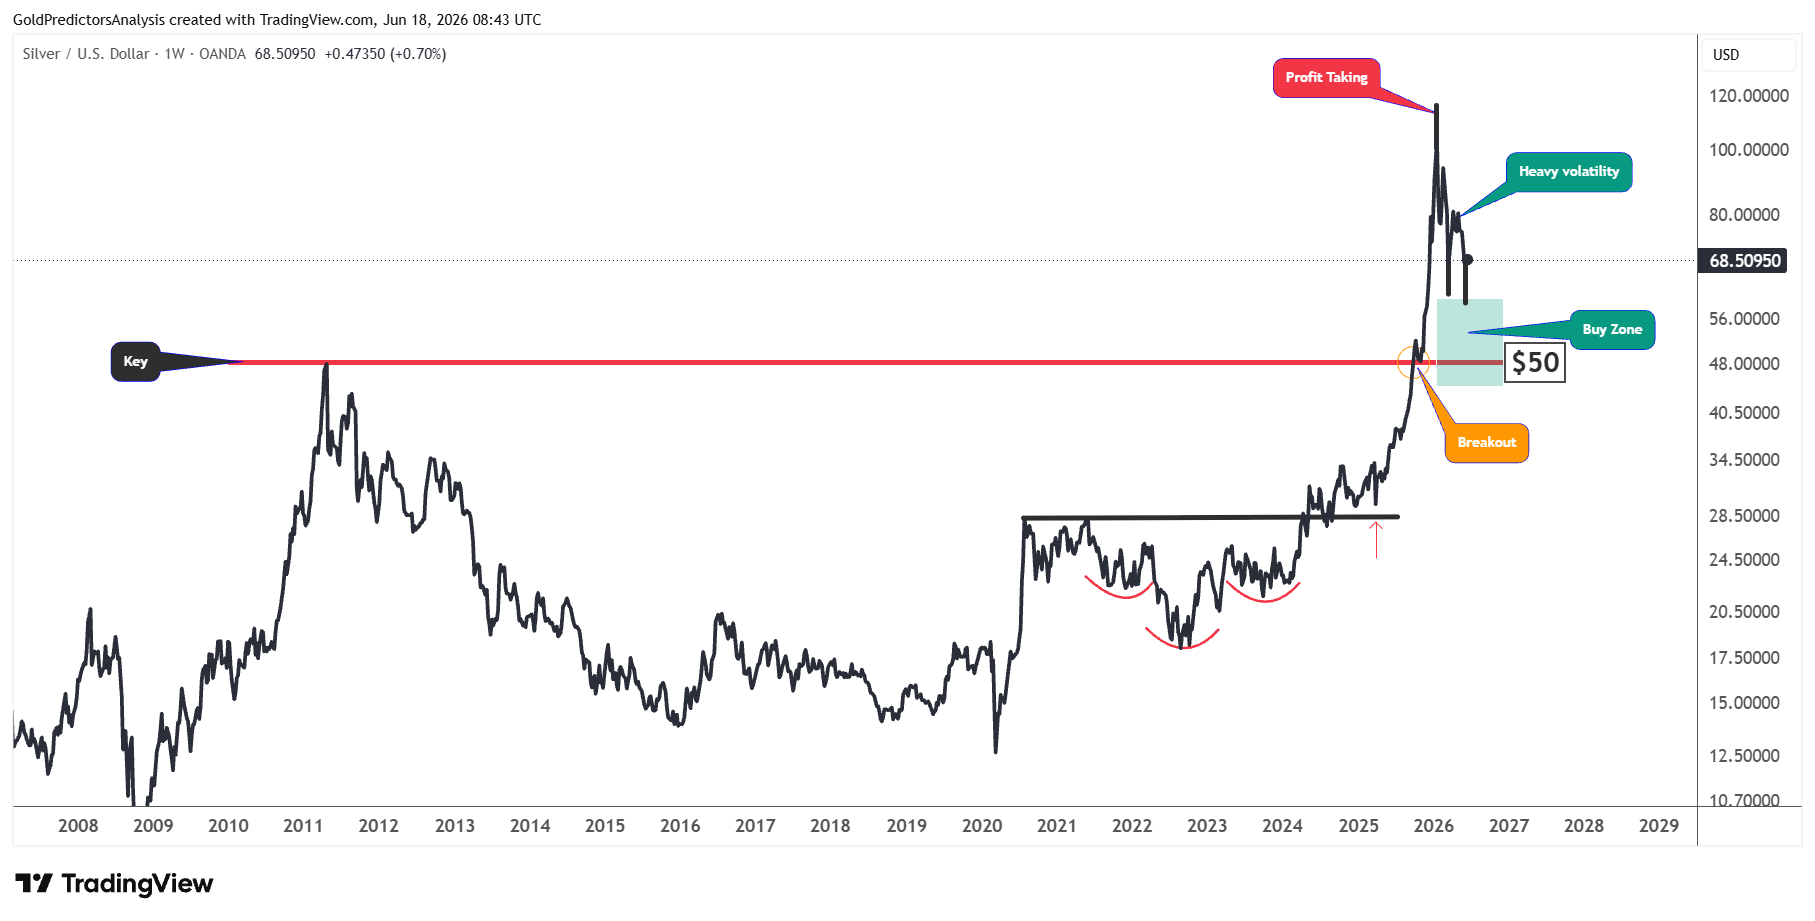
The reason for considering this zone a buy zone is the formation of an inverted head and shoulders pattern from 2007 to 2012. The neckline of this pattern was broken in April 2024 at $28. This breakout triggered the strong rally in silver prices. This rally also broke the decade-long resistance of $50.
After this strong surge in silver prices, profit-taking at $120 is pushing the silver price lower. The $50 area has strong support as it was the breakout area in 2025. But the high volatility stemming from the U.S.-Iran war has complicated the outlook.
Silver Tests $60 Support as $72 Breakout Holds the Key
To further understand the reversal in the silver market from $60, the chart below shows that the reversal last week was from the upper zone of the circle. This circle was drawn on the weekly chart in the $45 and $60 area.
The silver price just hit the upper end of this support and rebounded higher toward the $70 area. But the price failed to break above $70, which keeps silver prices under pressure.
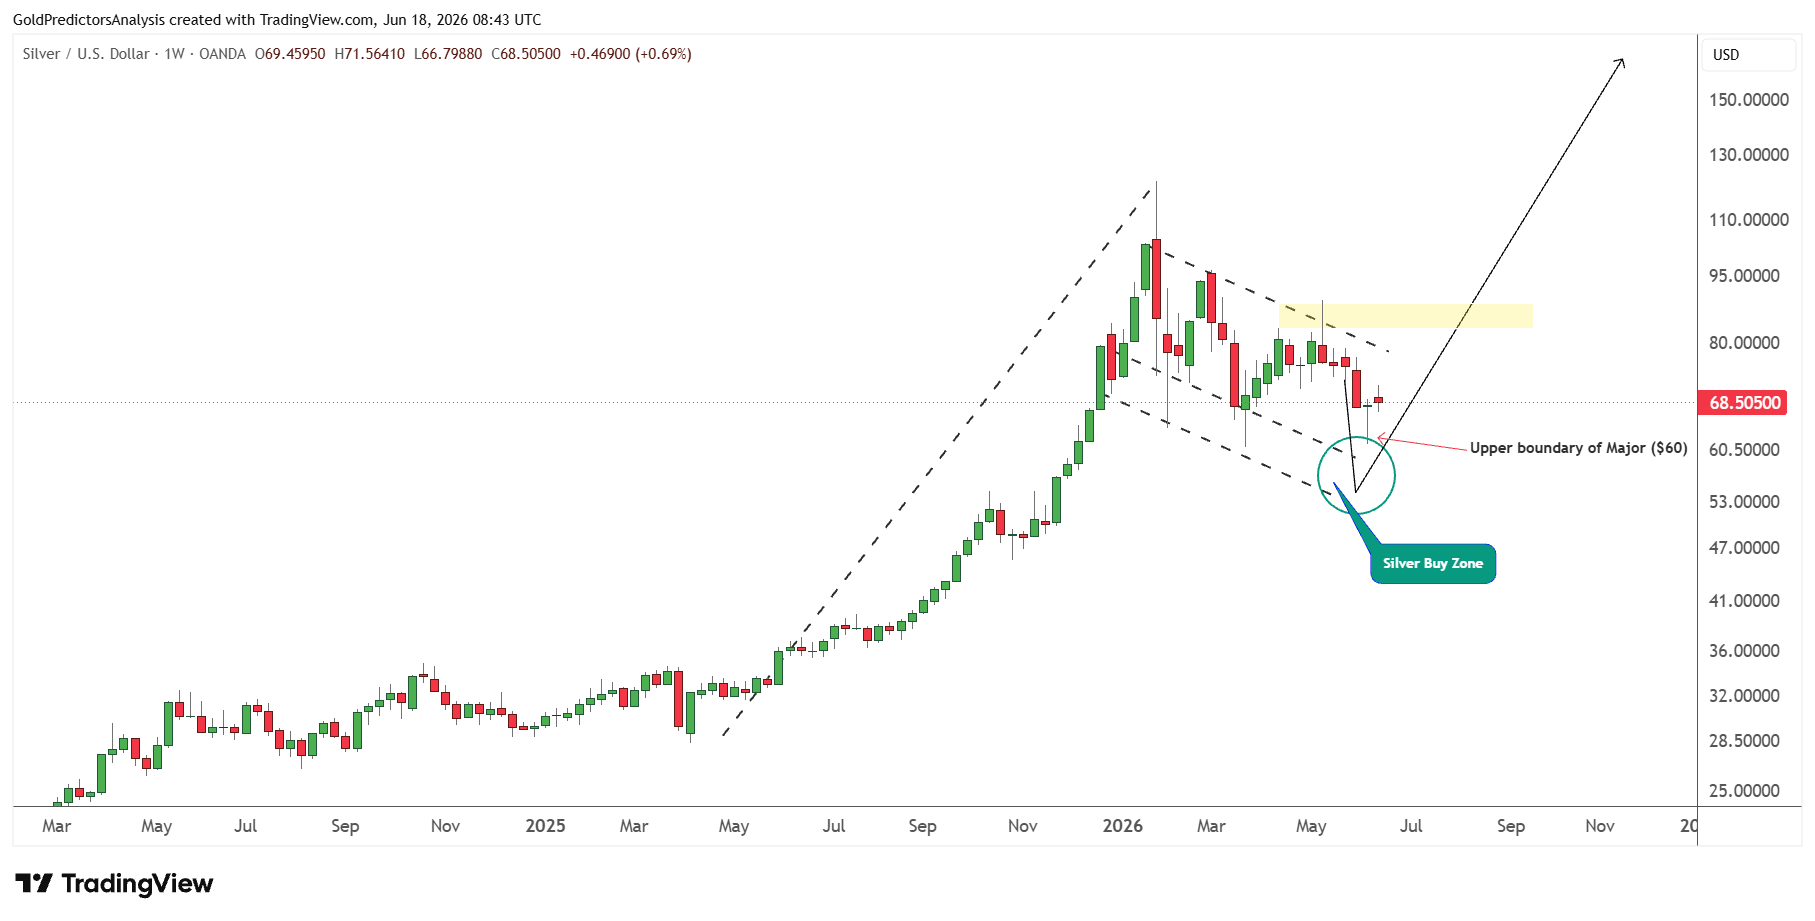
If the U.S. dollar index breaks above 100.50, it will likely keep silver prices below $72. This will likely trigger another drop toward the $50 to $60 region, which might be the strong support for buyers.
The formation of a bull flag pattern from the April 2025 low to the January 2026 high indicates that the next move in silver will likely be higher once this correction is over.
The recent rebound from $60 is also justified by the wedge pattern on the daily chart which shows a strong rally from the lower boundary of the wedge. If the silver price breaks $72, it will likely encounter strong resistance at $78. This level will decide the next move in the silver market.
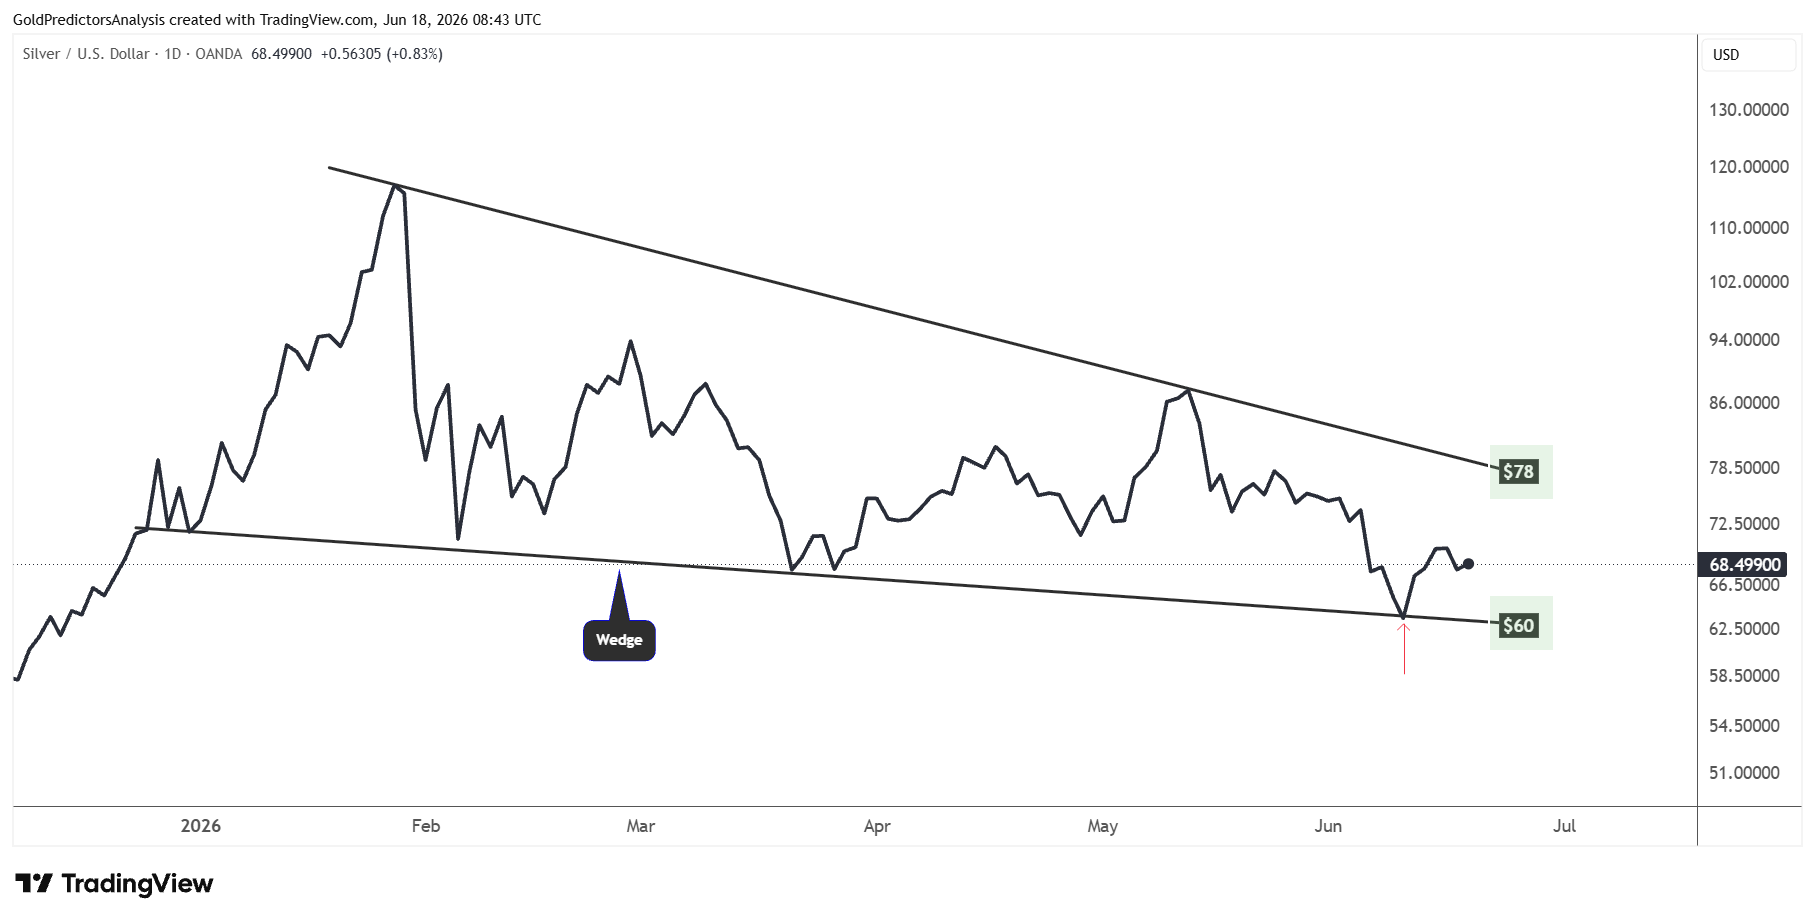
Overall, the silver price is compressing between $60 and $80 and waiting for the breakout of this range to find the next move.
What is Next in Silver Price?
Silver currently trades at a significant decision level. The long-term structure for silver remains bullish but the short-term structure is still under pressure with the stronger U.S. dollar and Treasury yields. The $60 zone has been a solid support zone. The bounce from this area indicates that buyers are still there. But the silver needs to break above $72 to activate the bullish trend.
The next move will be determined by the state of the U.S. dollar, Treasury yields and the demand for industry. If the US dollar index breaks above 100.50 due to the hawkish Fed comments, then silver might test the $50 to $60 support zone again before the next strong surge. However, if the US dollar index fails at 100.50 and drops lower, the silver price will break the $72 and push to $78.50.
The overall price structure for silver remains constructive and therefore any correction within the $50-$60 this time will offer a strong buying opportunity for traders.