


Silver (XAG) price has dropped sharply after last week’s strong U.S. inflation, rising U.S. Treasury yields and a stronger dollar reduced expectations for near-term Fed rate cuts. Silver’s move from the $89 price zone to $75 indicates that it is susceptible to rate shocks due to its high exposure to industrial demand. This article discusses the macro drivers, technical structures and major risk levels that could influence the next step in silver.
Macro Drivers for Silver
Hot Inflation Data Pushes Fed Rate-Cut Hopes Lower
The sharp reversal in silver price last week was due to the shift in the interest rate outlook by Federal Reserve. The price reached its highest point in two months at $89.24 before falling to $75.85 on Friday. The price of gold (XAU) also dropped relatively. That gap is important because silver is affected by the monetary and industrial demand. While the gold price is affected primarily by the monetary demand.
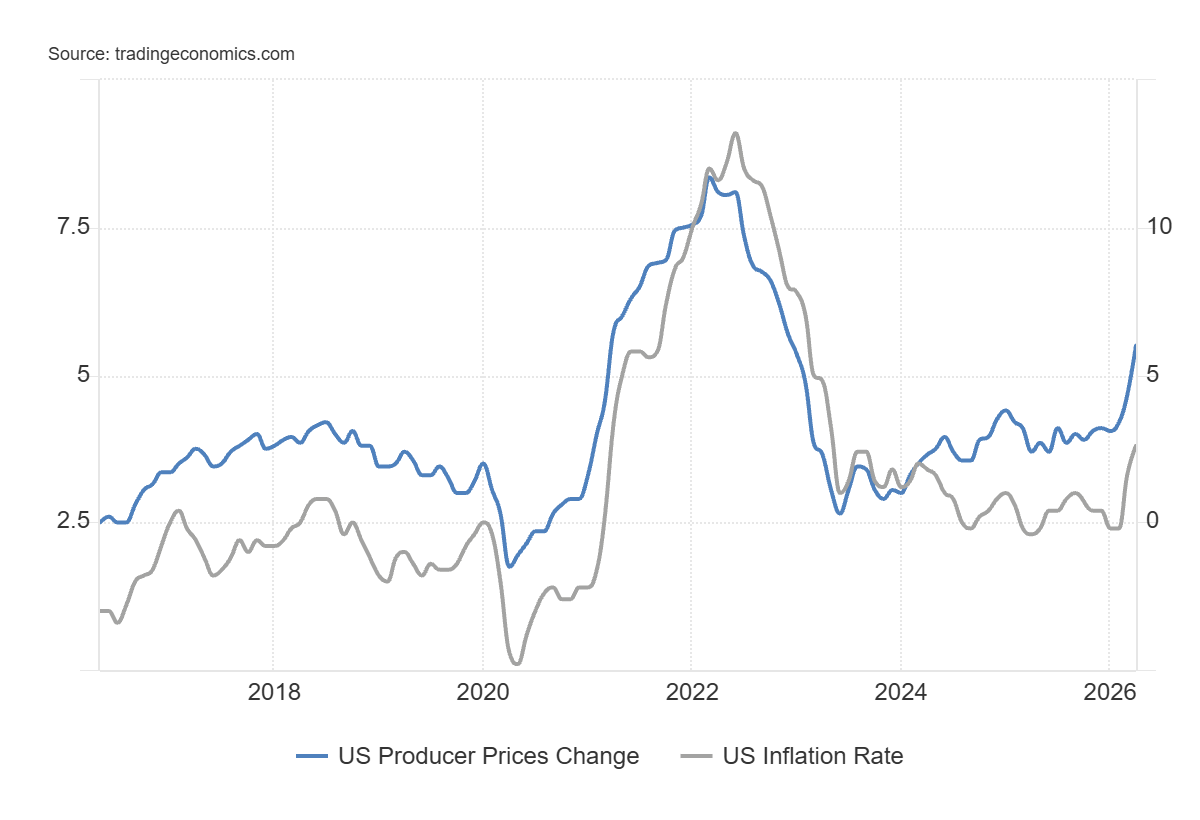
The key for this drop was the U.S. inflation data. The CPI increased to 3.8% in April while the PPI increased 6% as seen in the chart below.
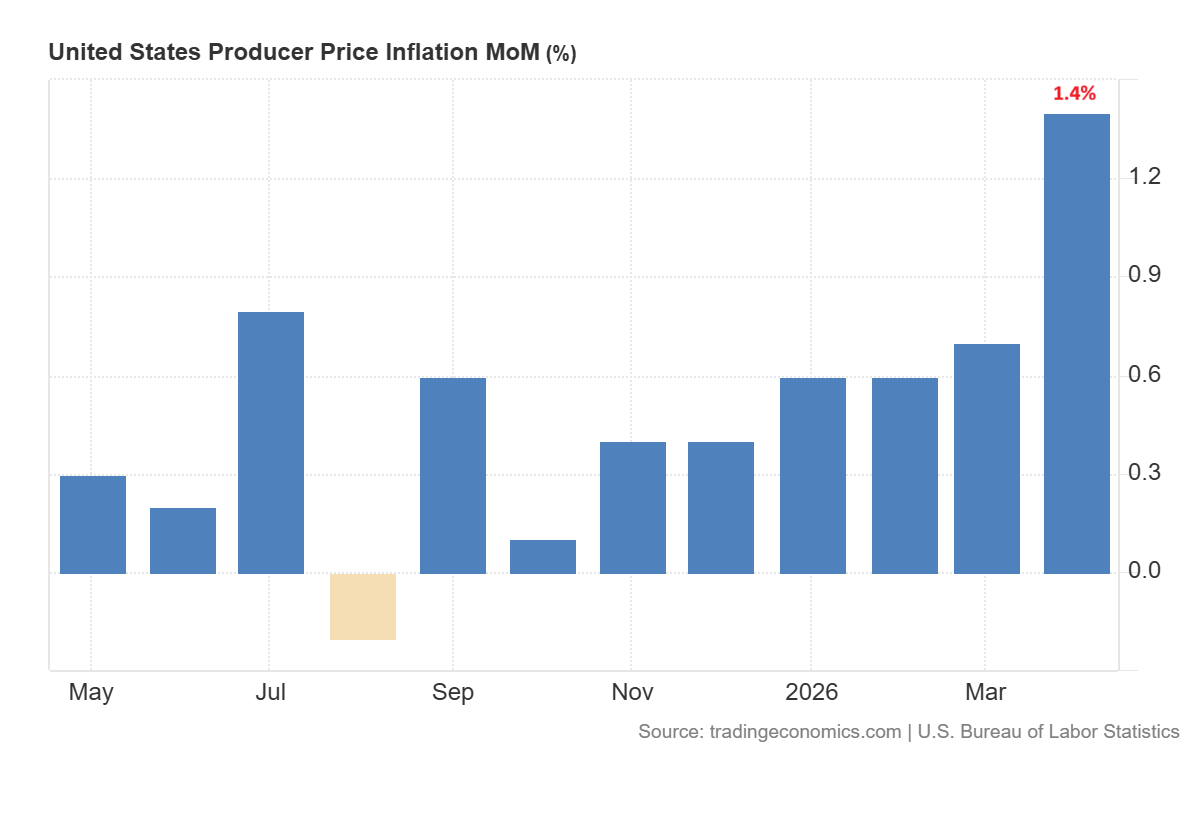
The month-on-month increase in PPI was also strong at 1.4% and higher than the market expectations.
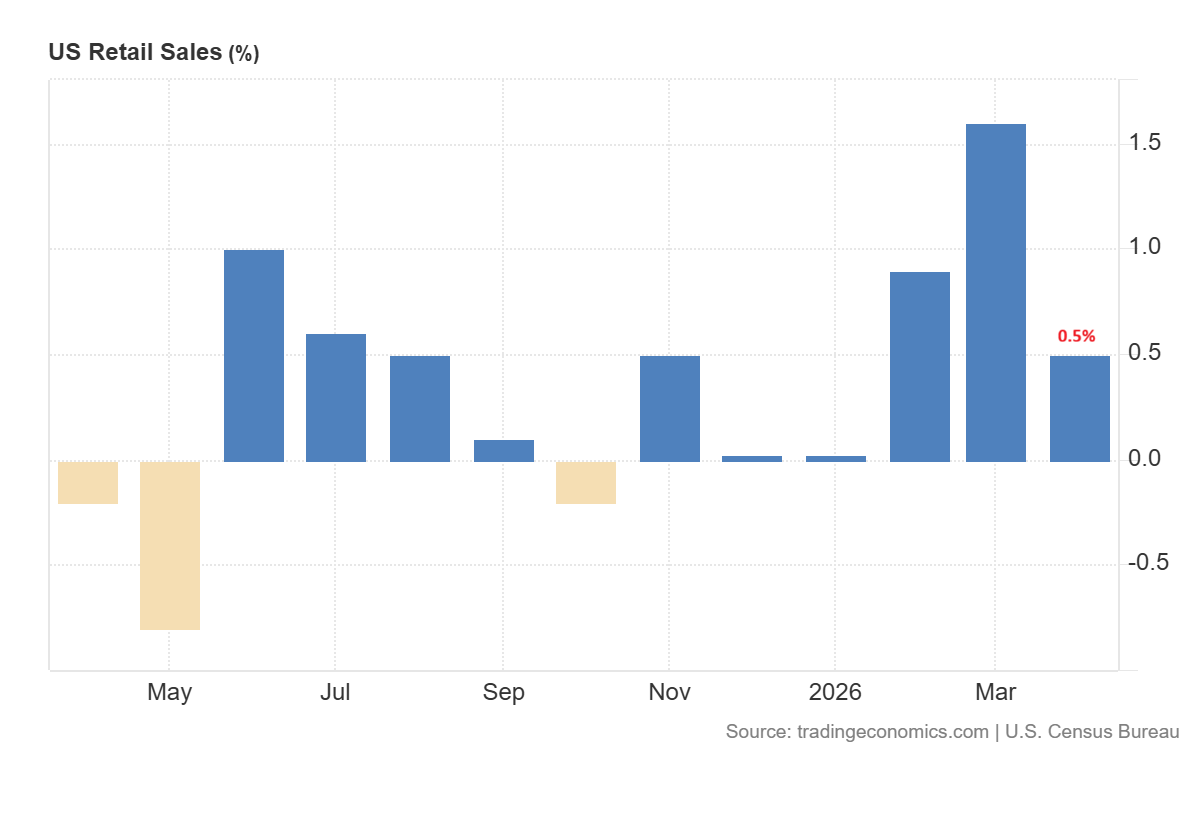
Moreover the retail sales ticked up 0.5% and tempered the case for a faltering economy and a need for near term Fed rate cuts.
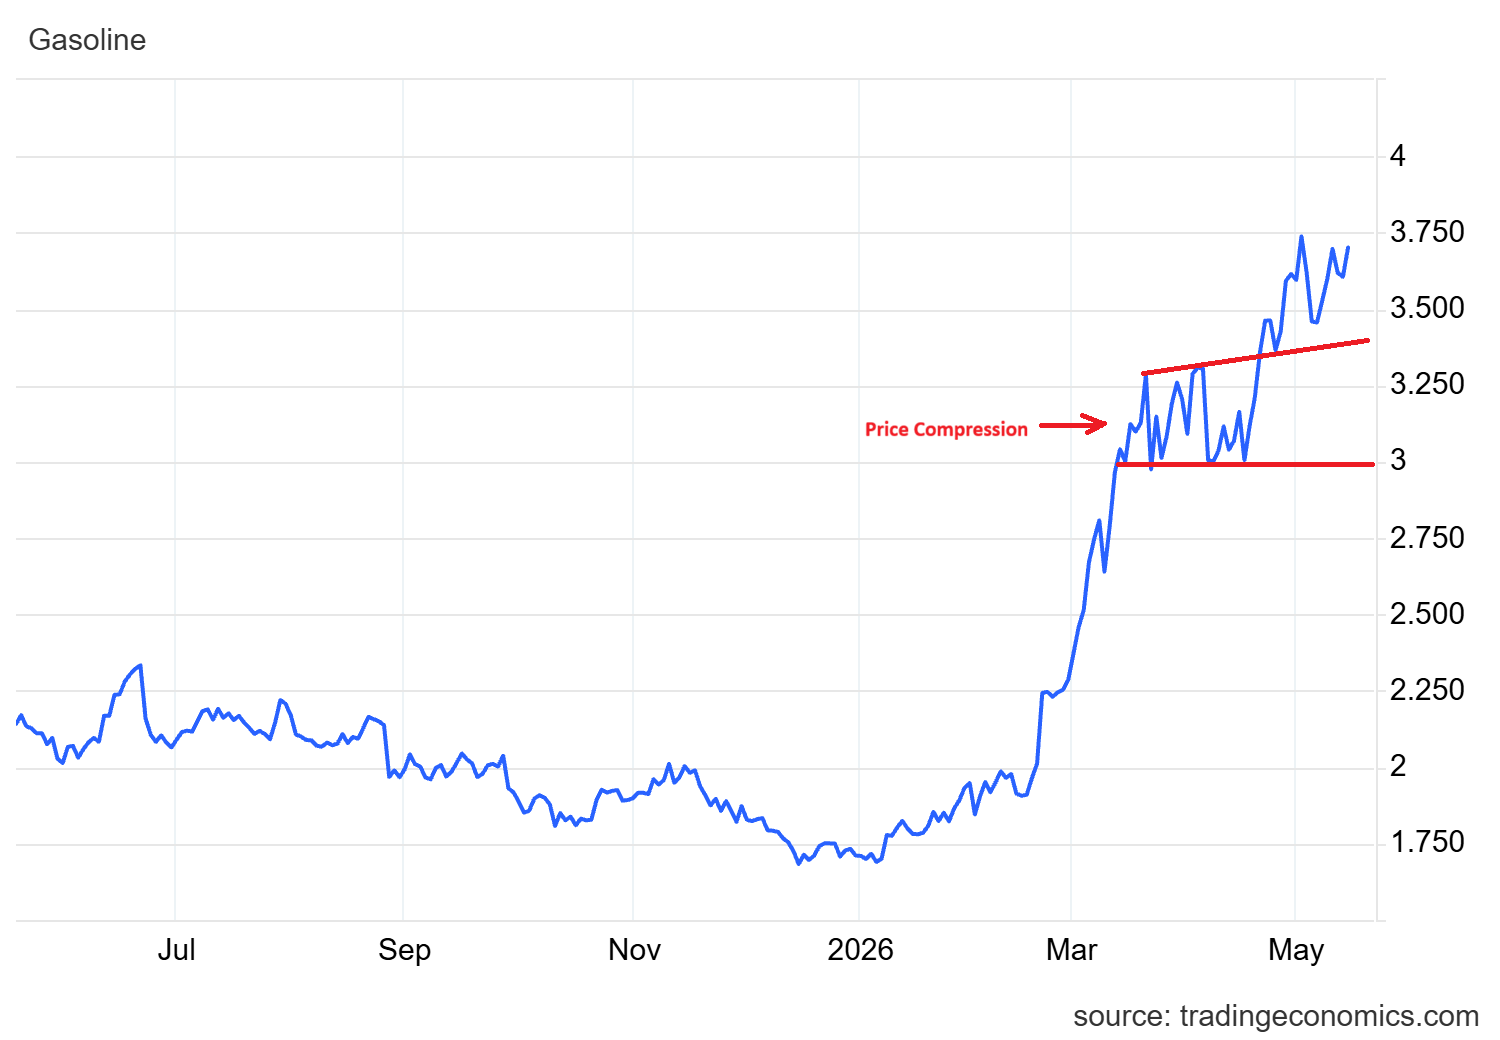
Much of the inflation shock was caused by energy prices. Prices for gasoline rose sharply in April as seen in the chart below. The cost pressure is now passing through the economy. The businesses will now start to pass the higher energy, tariffs and input costs to consumers.
This will likely keep the US interest rates higher for longer. This outlook pushed the US dollar index higher after forming the double bottom pattern.
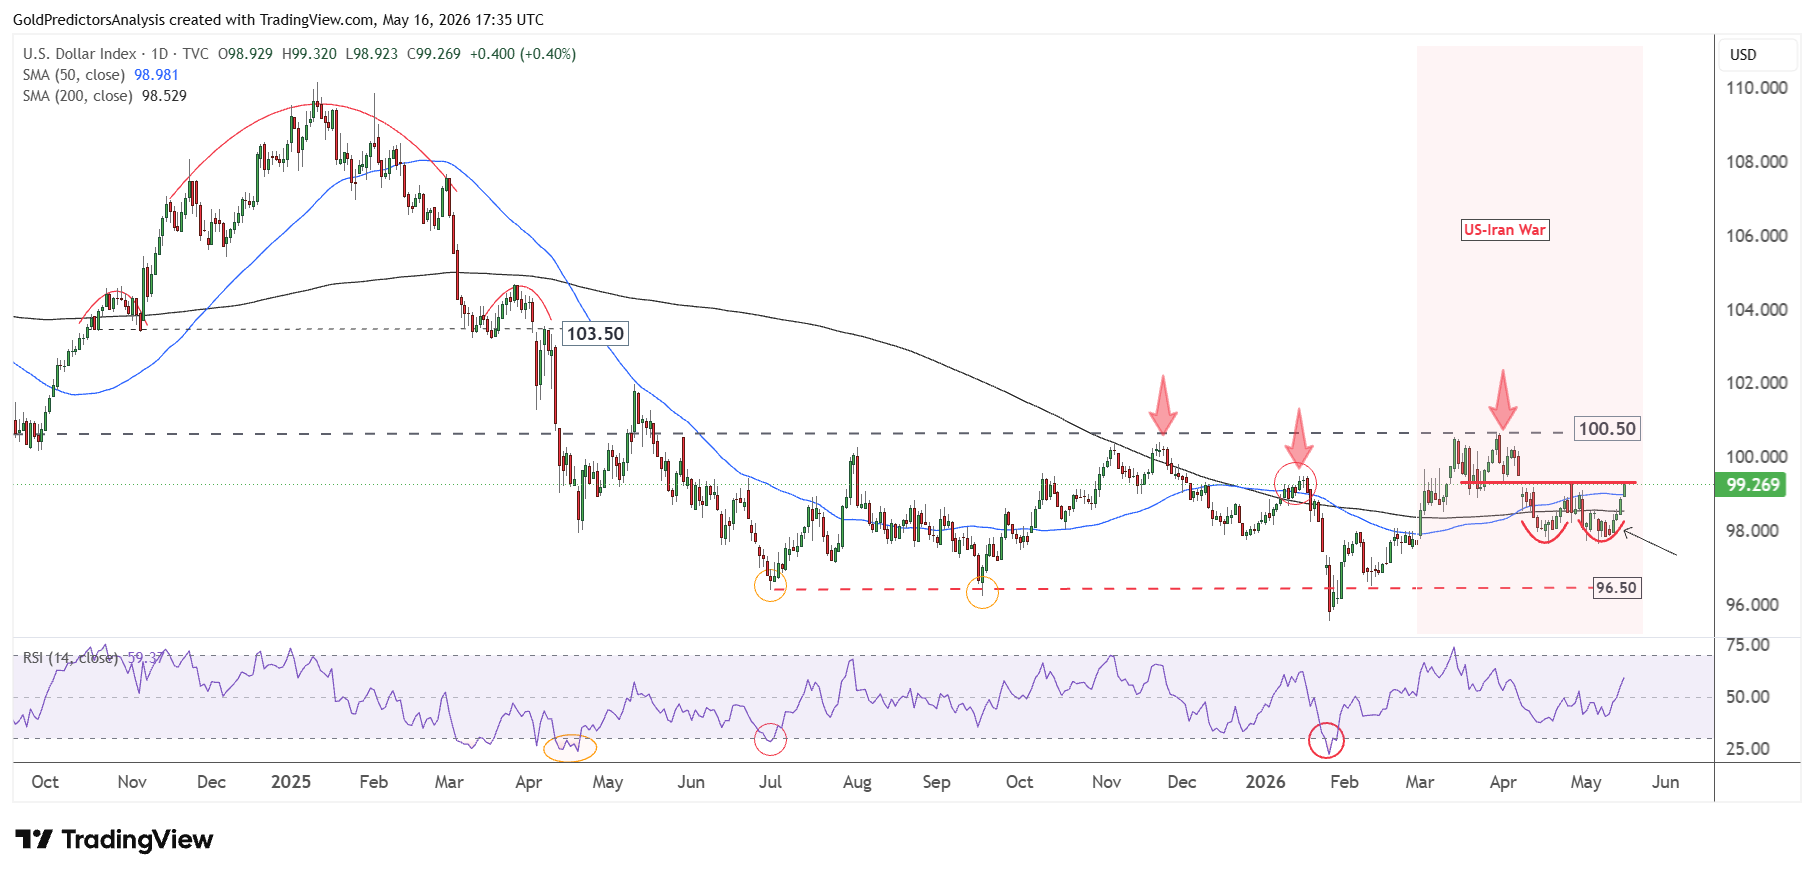
The stronger US dollar further keeps the silver under pressure in the short term. Higher rate expectations also put pressure on industrial demand as they dampen business investment, manufacturing and credit.
That is the reason for the heavier price drop of silver compared to gold. Solar panels, electric vehicles, semiconductors and medical devices are all using silver in their products. The industrial premium is the first to be squeezed when rate fears increase.
Silver Price Forecast
Every new Silver analysis as it publishes, today's technical signal and key levels, live price — on one page.
See all Silver forecastsSilver’s Long-Term Case Survives the Rate Shock
The pullback isn’t hurting the long-term silver argument. In fact, the same inflation data that negatively affected the price of silver in the short term bolsters the monetary function of silver. The 6% inflation figure is another indication of dollar erosion. That helps soften the blow on the market in the future.
The Fed is also confronted with a challenging policy environment. Inflation is still too high for the Fed to cut rates easily, but the inflation source is demand-driven. Stress on energy supplies, tariff pressures and the Hormuz disruption are adding to costs. An increase in interest rates will not reopen shipping lanes or raise energy supply, but this can limit the Fed’s ability to fix the problem without hurting growth.
That policy bind is crucial for silver. The Fed is expected to remain tight, sending more volatility towards the industrial side of silver. Growth may slow later but if inflation doesn’t abate, investors will likely resume buying silver as hedge against currency devaluation and financial uncertainty.
In my opinion, the macro environment still looks favourable for silver in the medium term. The strong drop last week appears to be more of a shock reaction to the rate than a trend change. The next move in silver may be delayed by a strong US dollar and higher yields. However, the big picture for silver remains bullish with continued inflation, energy stress and policy uncertainty.
Silver Long Term Structure Remains Bullish
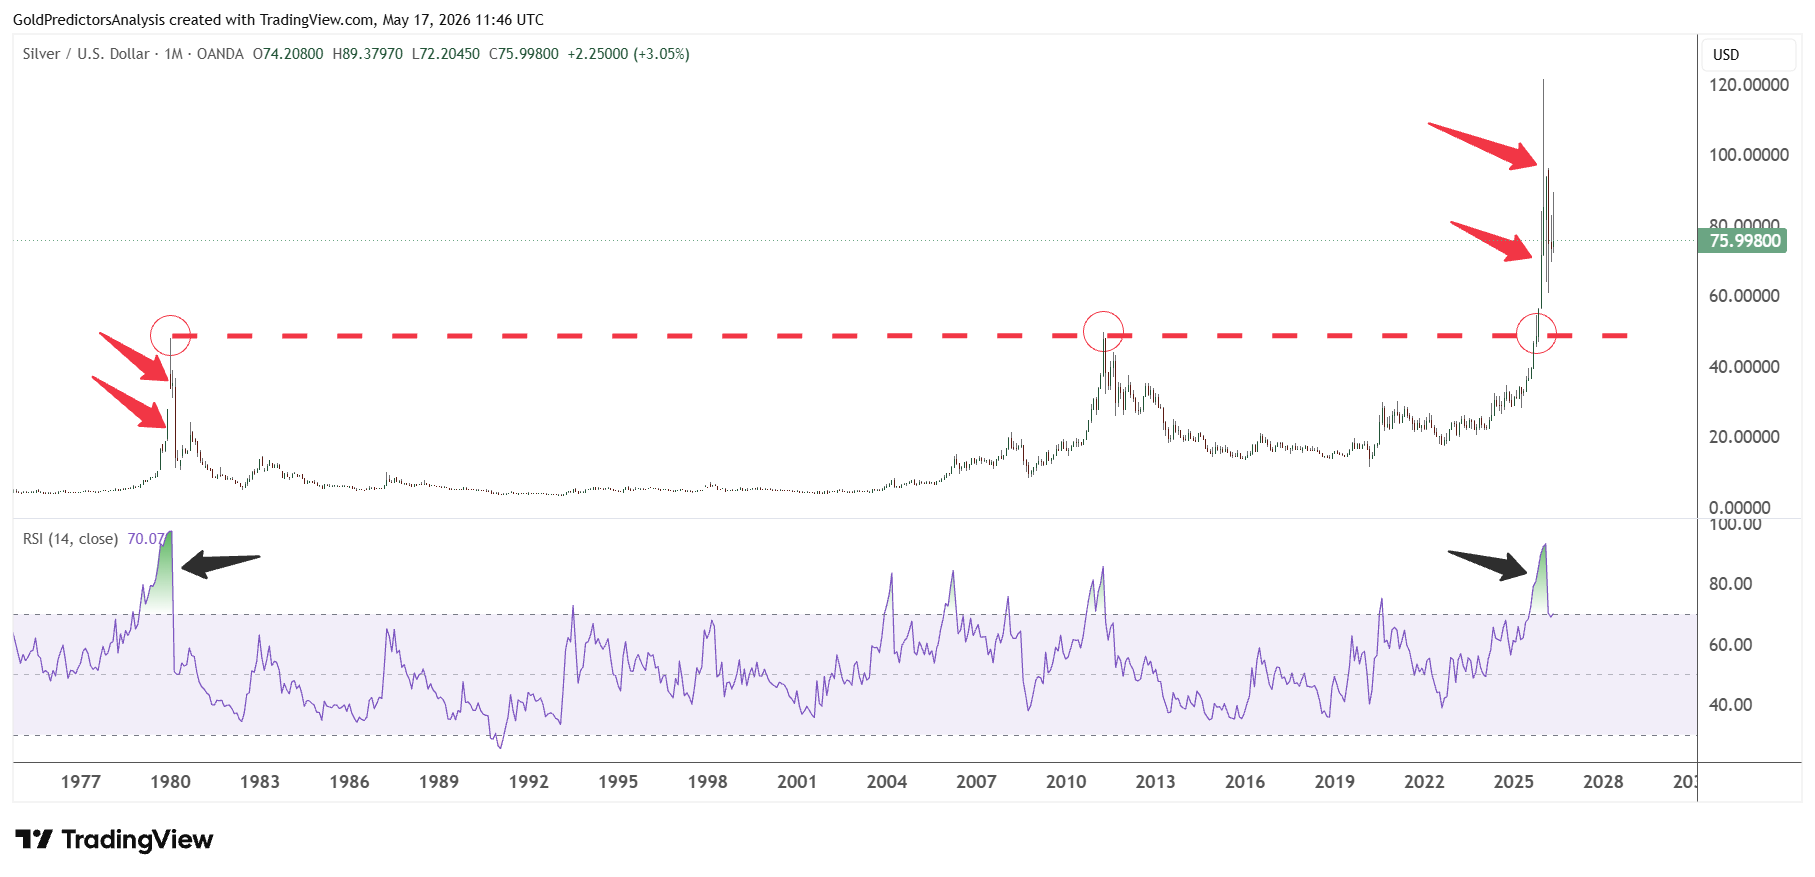
The long-term picture for spot silver remains strongly bullish, as seen by the monthly chart below. The price spiked to $120 in January 2026 before reversing back toward the breakout of the $55 area.
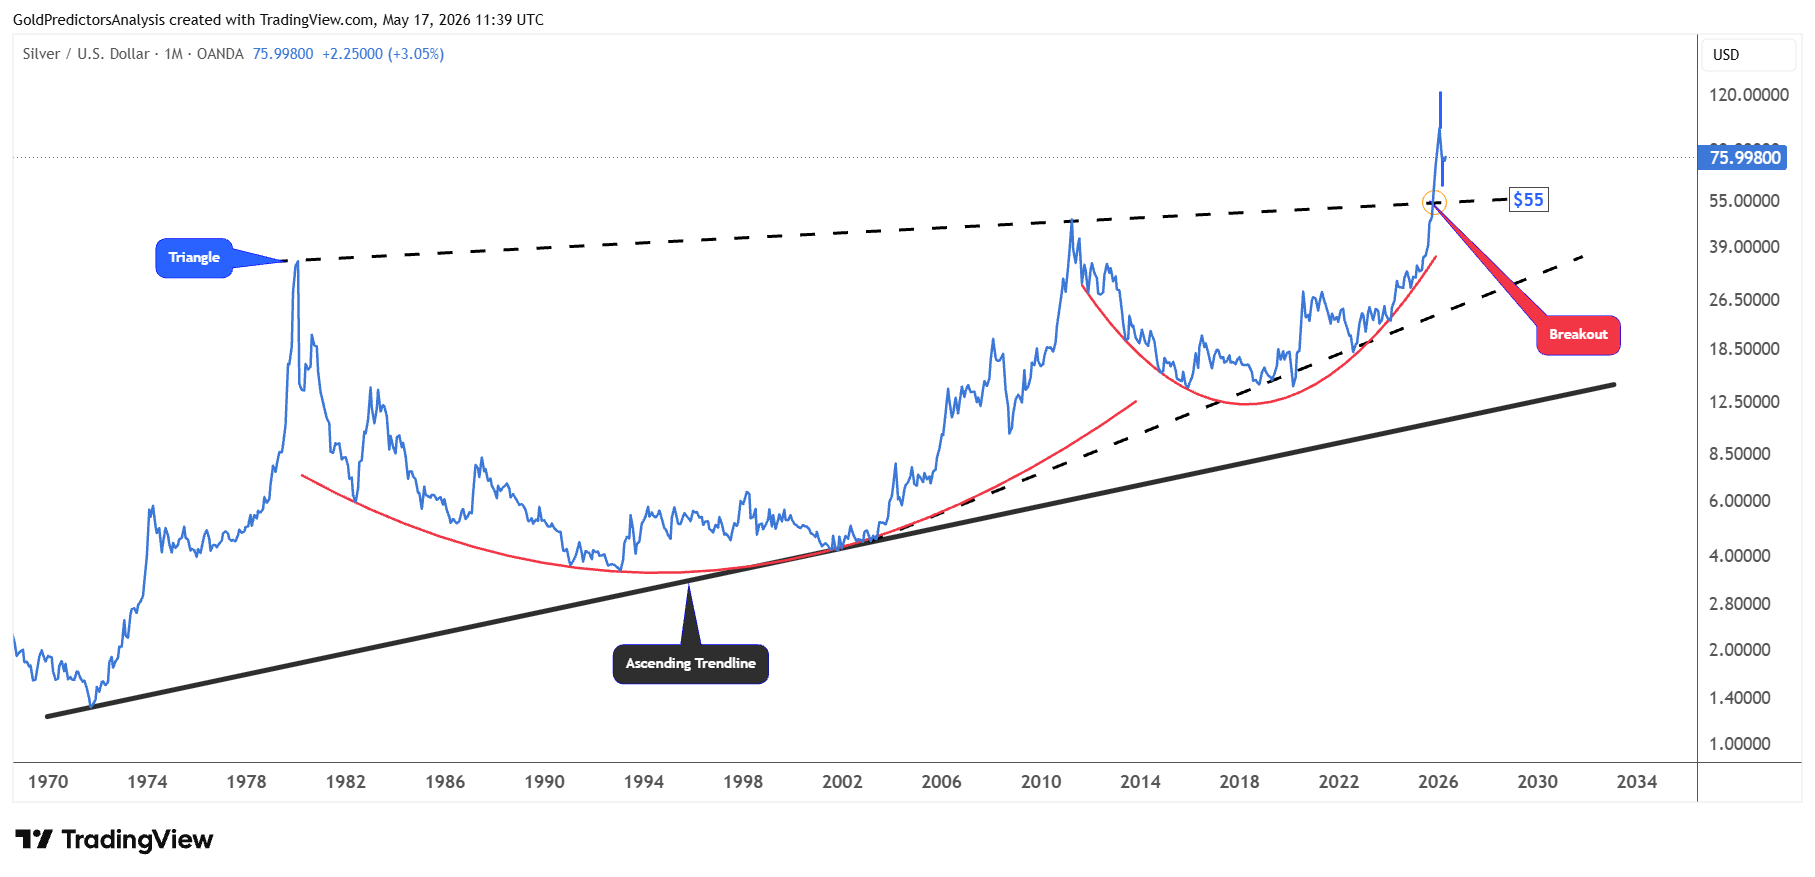
The price hit $61 and initiated a strong rebound higher. But the price failed to break above $100 and continues to consolidate below the lower levels.
This indicates that the silver price is still in strong correction and is poised for further downside toward the breakout area of $50 to $60 to find an attractive buying opportunity.
The emergence of cup and handle patterns since the 1980s and the breakout above $50 indicate constructive price action. Therefore, this correction will likely be considered a strong buying opportunity for long-term investors.
Silver Short Term Structure Shows More Volatility
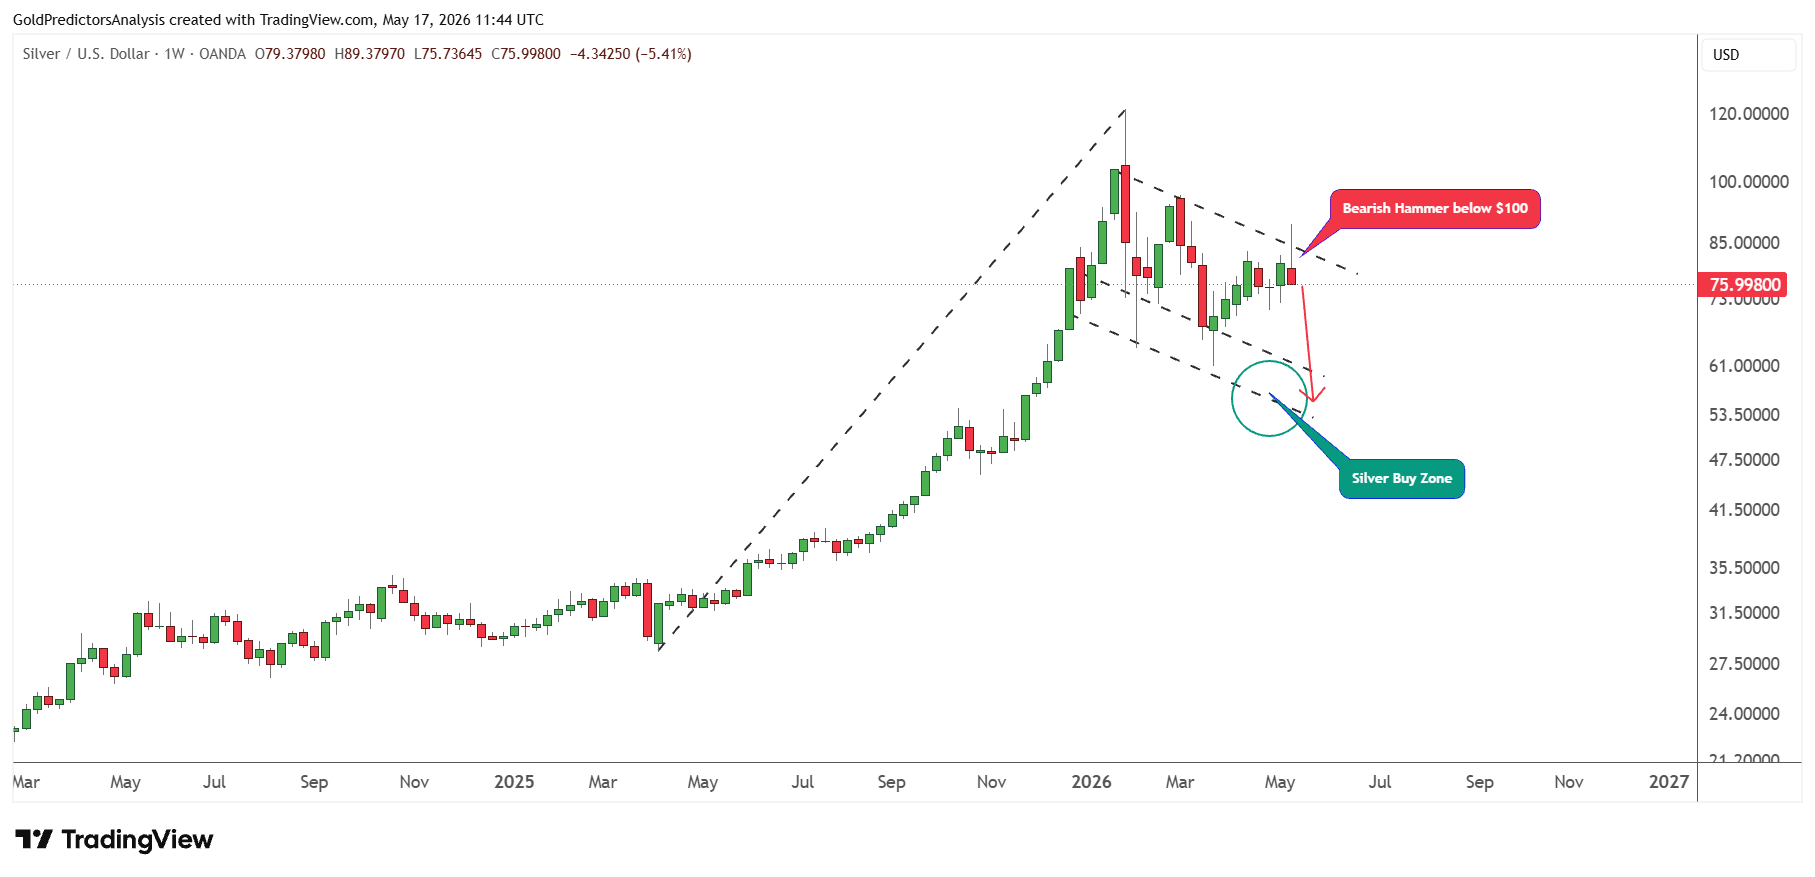
This strong bullish price action in spot silver is also evident on the weekly chart, which shows an inverted head-and-shoulders pattern from 2021 to 2024, followed by a break above $27.
This breakout has opened the door for a continued upside movement toward much higher levels. But the strong profit-taking at the $120 area has introduced strong volatility.
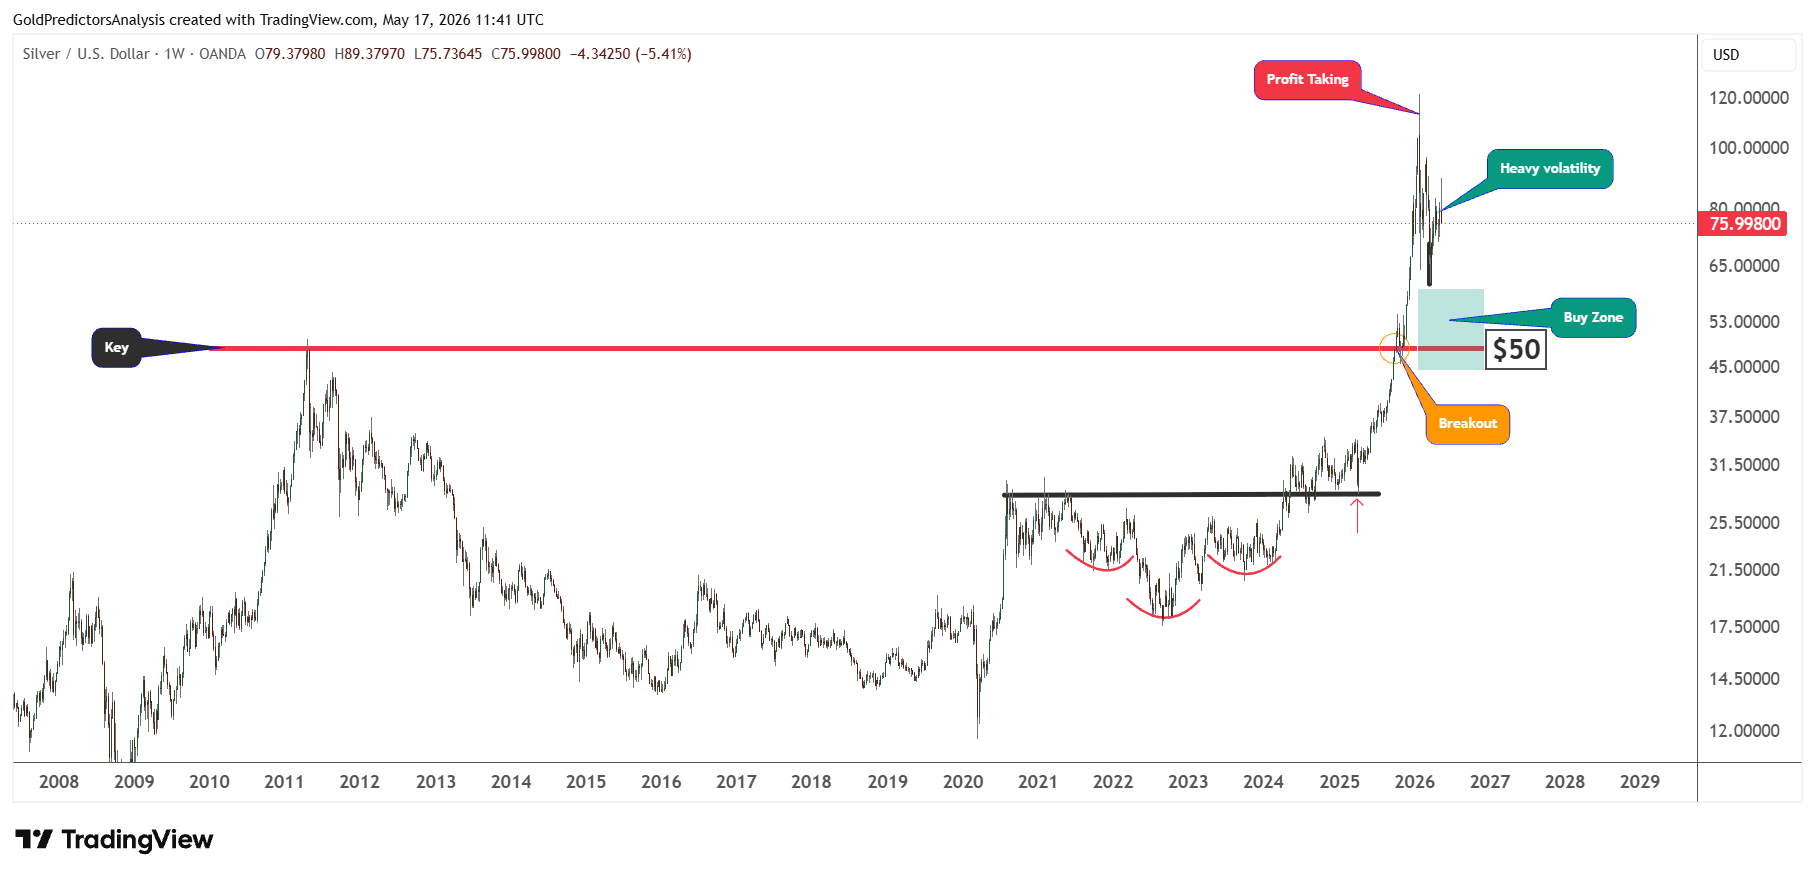
The price dip toward $61 was not enough and the price is still showing some weakness toward the buy zone area. A retracement toward the buy region will likely offer strong buying opportunities for investors.
The price bar for the past few weeks shows heavy volatility, which indicates a stronger move when the price breaks above $120. This upsurge in price swings might be due to the ongoing energy crisis.
The weekly price structure for spot silver has formed a bearish hammer candle below the $100 area. This shows that prices will likely drop further this week.
The descending channel pattern from the high of the $120 region toward the low of the $60 area suggests that if silver breaks below $72 on a closing basis, it will likely trigger a strong drop toward the $50 to $60 region in the next few days. However, a recovery above the $90 region will likely negate this bearish price action and offer further upside toward $100.
Silver Risk Analysis
The main risk for silver is a strong US dollar and high interest rates. The Fed may keep its foot on the brakes longer, given the sticky inflation. This can reduce expectations for rate cuts and increase pressure on industrial metals. In this context, silver could be expected to drop more than gold, as it is more exposed to a range of manufacturing, solar, electric vehicle, semiconductors and other industrial demand.
A second risk is the volatility that occurred after the big turnaround from the $120 area. Hefty profit-taking has already taken place, as evidenced by the momentum that has been lost. The bearish weekly candle below the $100 level indicates that sellers are still around. If the silver price does not make back above the $90 area, then the correction could extend until the next bull move begins.
The third risk in silver is the extreme overbought conditions observed by the RSI, not seen since the 1980s. When the price peaked in the 1980s at around $50, the drop was very quick toward the $10 area within a few weeks. This increases the risk in the silver market because a monthly close below the $50 region will likely trigger a strong drop toward the $30 region. However, this $30 area remains the key pivotal level for decades.
Final Words
The long-term bull market structure for silver remains intact, but the short-term price action remains negative and signals a correction. The inflation concerns, higher US Treasury yields, and stronger US dollar have delayed the next rally in silver. But the same inflation pressure also works in monetary favour for silver. In my view, any correction towards the $50-$60 will offer a long-term buying opportunity for investors. But the emergence of a bearish hammer candle last week points to further weakness in silver this week.
The larger time frame looks more favorable for silver as long as the price remains above the critical breakout area. The market remains supported over the medium term by industrial demand, energy stress and currency erosion. A negative close below $50 will negate the bullish view and bring more correction to $30. A recovery above $90 would indicate that the correction is over and trigger a fresh rally to record highs.
If you’d like to know more about how to trade gold and silver, please visit our educational area.