


Copper (XCU) and silver (XAGUSD) are both sending strong signals for the metals market, but they are pointing in different directions. Copper is attempting to bounce back as traders look to industrial demand, electrification, AI infrastructure and growth in China. Silver is correcting from the recent highs, but its ratio to copper suggests high monetary demand. If silver outperforms copper, the next breakout could be on the precious metals side as inflation, Fed policy and safe-haven demand remain significant factors.
Silver and Copper Send Different Market Signals
Copper Reflects Growth and Industrial Demand
Silver and copper are both industrial metals but they have different stories. Copper is a typical indicator of the health of the global economy, while silver is sensitive to industrial and monetary demand. The silver price reacts to monetary policy, inflation fears and sentiment toward precious metals.
Copper is more directly related to actual economic activity. Copper prices move with demand for construction, power grids, electric vehicles, data centres and AI infrastructure. A strong performance of copper also indicates that traders are anticipating a stronger industrial demand. China is also a major player as it remains a large consumer of copper. This explains why copper can sometimes be a growth signal.
Silver Tracks Monetary Demand and Volatility
Silver will rally if traders believe the Federal Reserve is not hawkish or if the inflation concerns grow. It can also be pressured when dollars appreciate and interest rate prospects move up. That is why the silver prices remain under pressure as the Fed has turned positive and inflation keeps growing with greater momentum after the US-Iran war.
Copper strength tells the story of growth, the appetite for electrification and demand. But the silver strength points to the demand for money, inflation, or a better precious metals cycle. When one metal leads the other, it gives the next theme in the metals market.
Silver Price Forecast
Every new Silver analysis as it publishes, today's technical signal and key levels, live price — on one page.
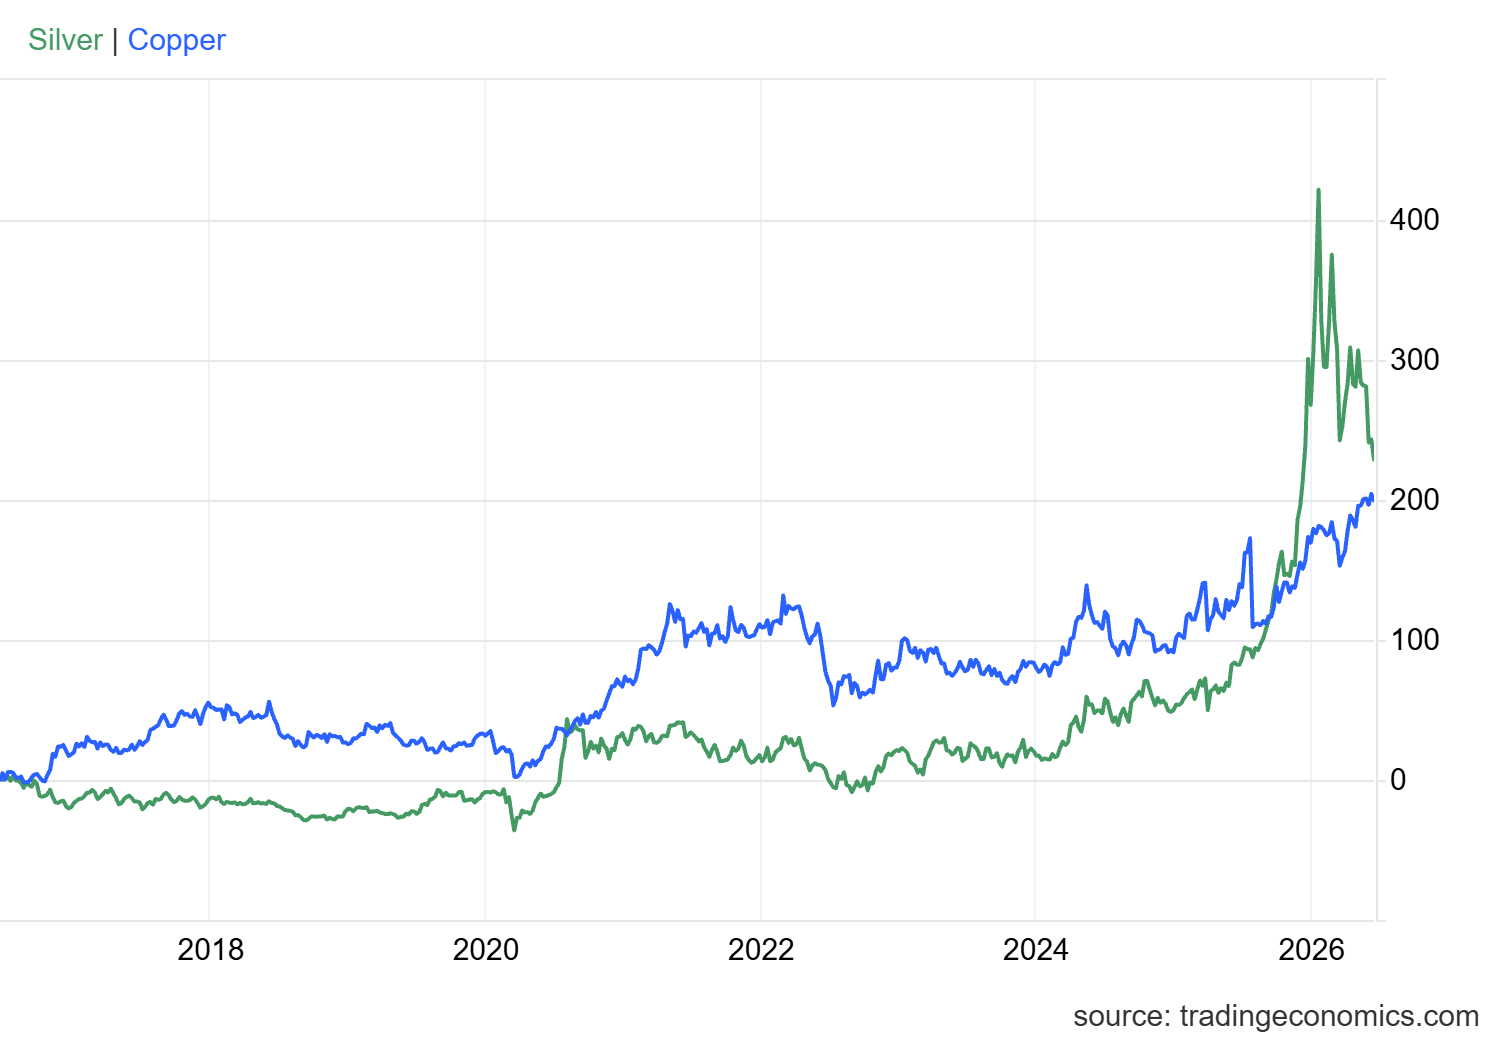
See all Silver forecastsThe chart below shows that the silver price has gained more than the copper price during the past decade. Silver has gained over 480% while copper has gained around 190% over the same period. This means that silver is more “active” in strong metal cycles and copper tends to work more slowly and consistently. The chart highlights that the silver price has moved to extreme levels and requires a correction to normalise the market trends.
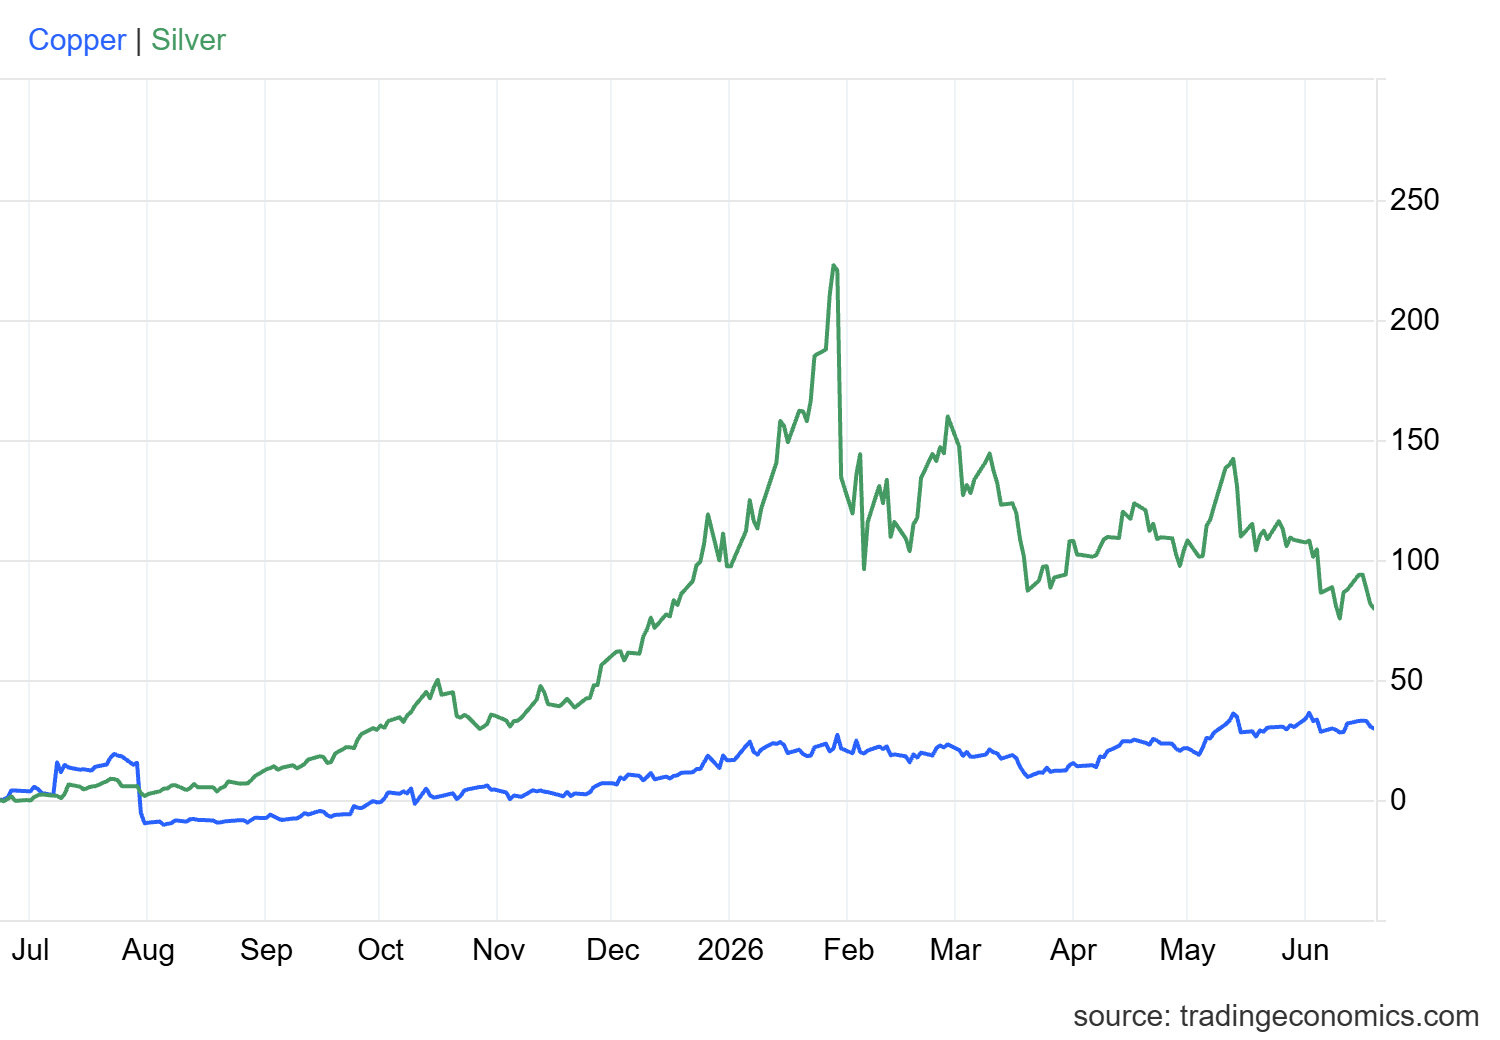
The copper performance over the past year also clearly reflects a steady and consistent trend with the support of themes like industrial demand and electrification. Silver has also shown impressive gains but its movements are more volatile and quicker. This means that copper might continue to experience solid growth demand but silver might offer greater upside opportunities in the event of an increase in monetary demand and precious metals sentiment.
Copper to Silver Ratio Tests Key Resistance
The copper to silver ratio indicates whether copper is outperforming silver or if silver is outperforming copper. If the ratio increases, copper performs better than silver. This is an indicator of increased demand for growth. That implies an increased interest among traders in industrial demand, construction, grids, AI infrastructure and China demand.
The chart below shows that the ratio has been trending within a long-term descending channel for many years. Every significant bounce has pushed the ratio near the upper trendline. The lower trendline has provided support at each major selloff. This indicates that the trend of copper leadership over silver has failed.
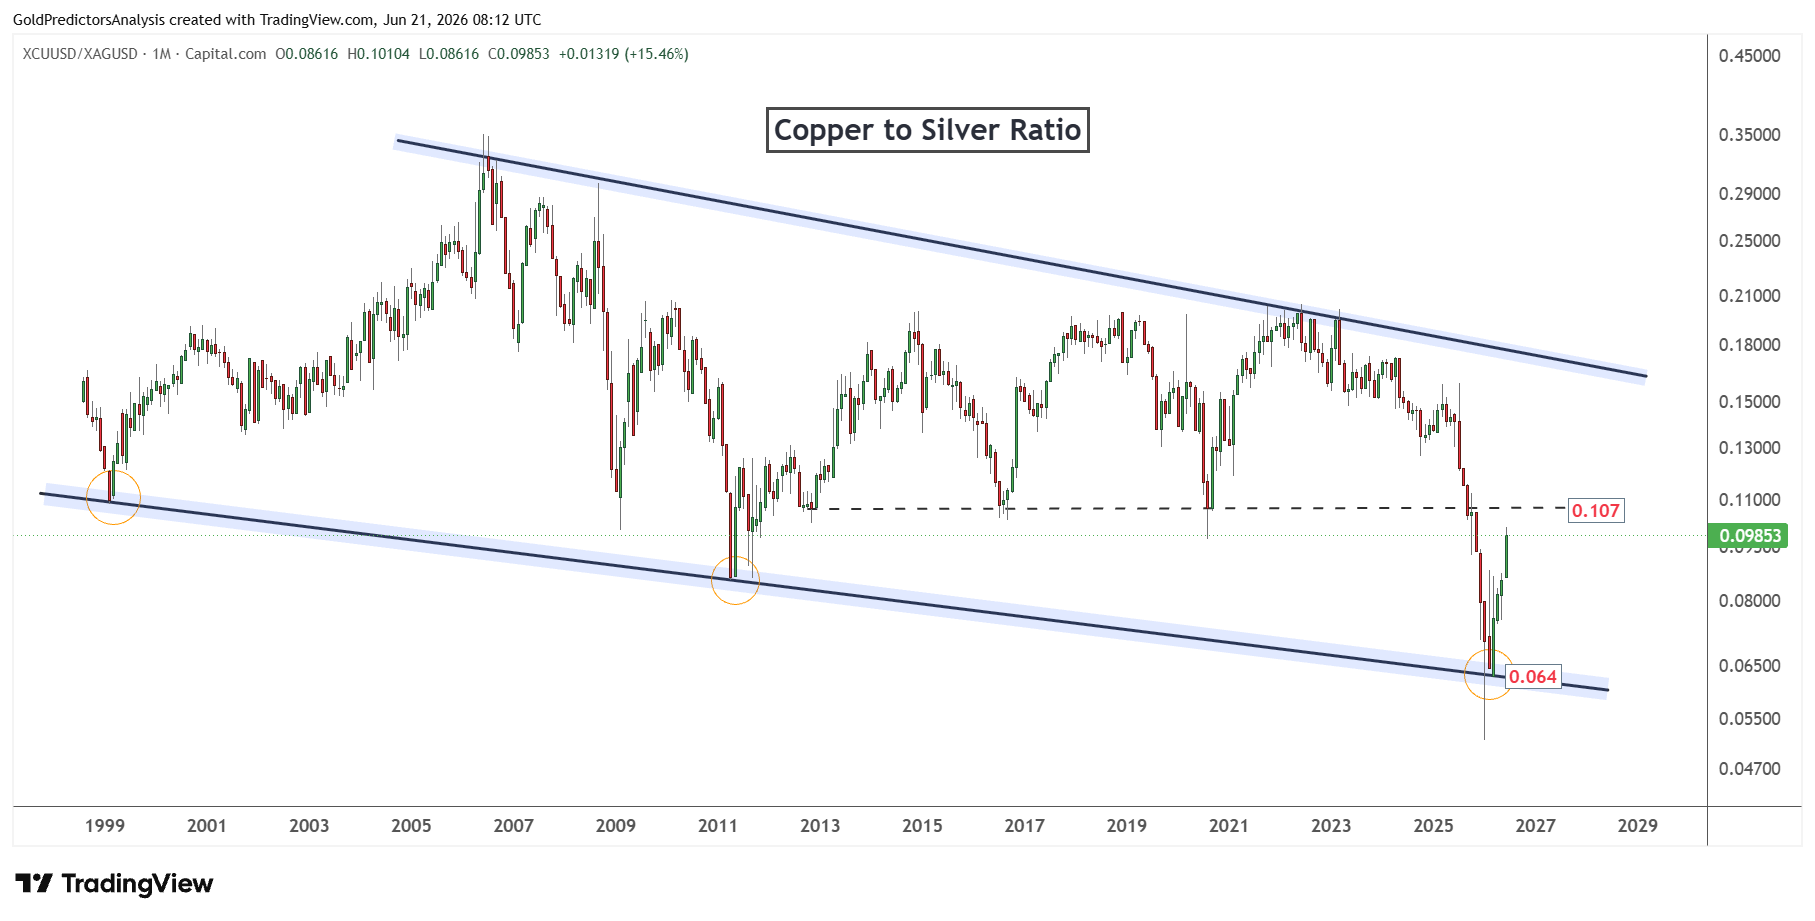
The ratio recently fell towards the bottom support levels around 0.064. This was very significant level as comparable support areas bounced well in the past. Copper is trying to recover against silver as seen in the latest bounce from this zone. But the ratio still has to rise above the 0.107 resistance area to confirm recovery.
A move above 0.107 would be important. It would indicate that copper has regained strength and the metals market is once again hungry for growth. This would further support the bullish sentiment for copper. It would also indicate a shift towards monetary demand from the industrial demand.
If the rally in the ratio remains below the 0.107 level, it would remain under control. If the ratio falls once again from this resistance, this would indicate that the copper rebound is weak. In this scenario, the investors will stick to the silver prices, which will confirm a bottom and trigger a strong rally in the precious metals sector.
Silver to Copper Ratio Supports Silver Leadership
The silver-to-copper ratio conveys the opposite message to the copper-to-silver ratio. As this ratio increases, silver is outperforming copper. This reflects the shift from pure industrial growth demand to monetary demand. It is an indication that traders are increasingly focusing on inflation, Fed policy, precious metals strength and safe haven demand.
The chart below shows that the ratio has broken the long term resistance level near 8.20 in August 2025. This is considered a major breakout. This resistance kept this ratio down for many years. The breakout has brought about a structure change, as old resistance levels are now seen as support. This is a bullish signal for silver as it demonstrates that silver has begun to outperform copper after a lengthy base.
The chart also shows the three big rounding bottoms prior to the breakout. These formations indicate that silver builds strength slowly against copper. Each bottom provided a sound foundation for the next step. Silver has broken out above the trend line which indicates that it has emerged from this long consolidation period.
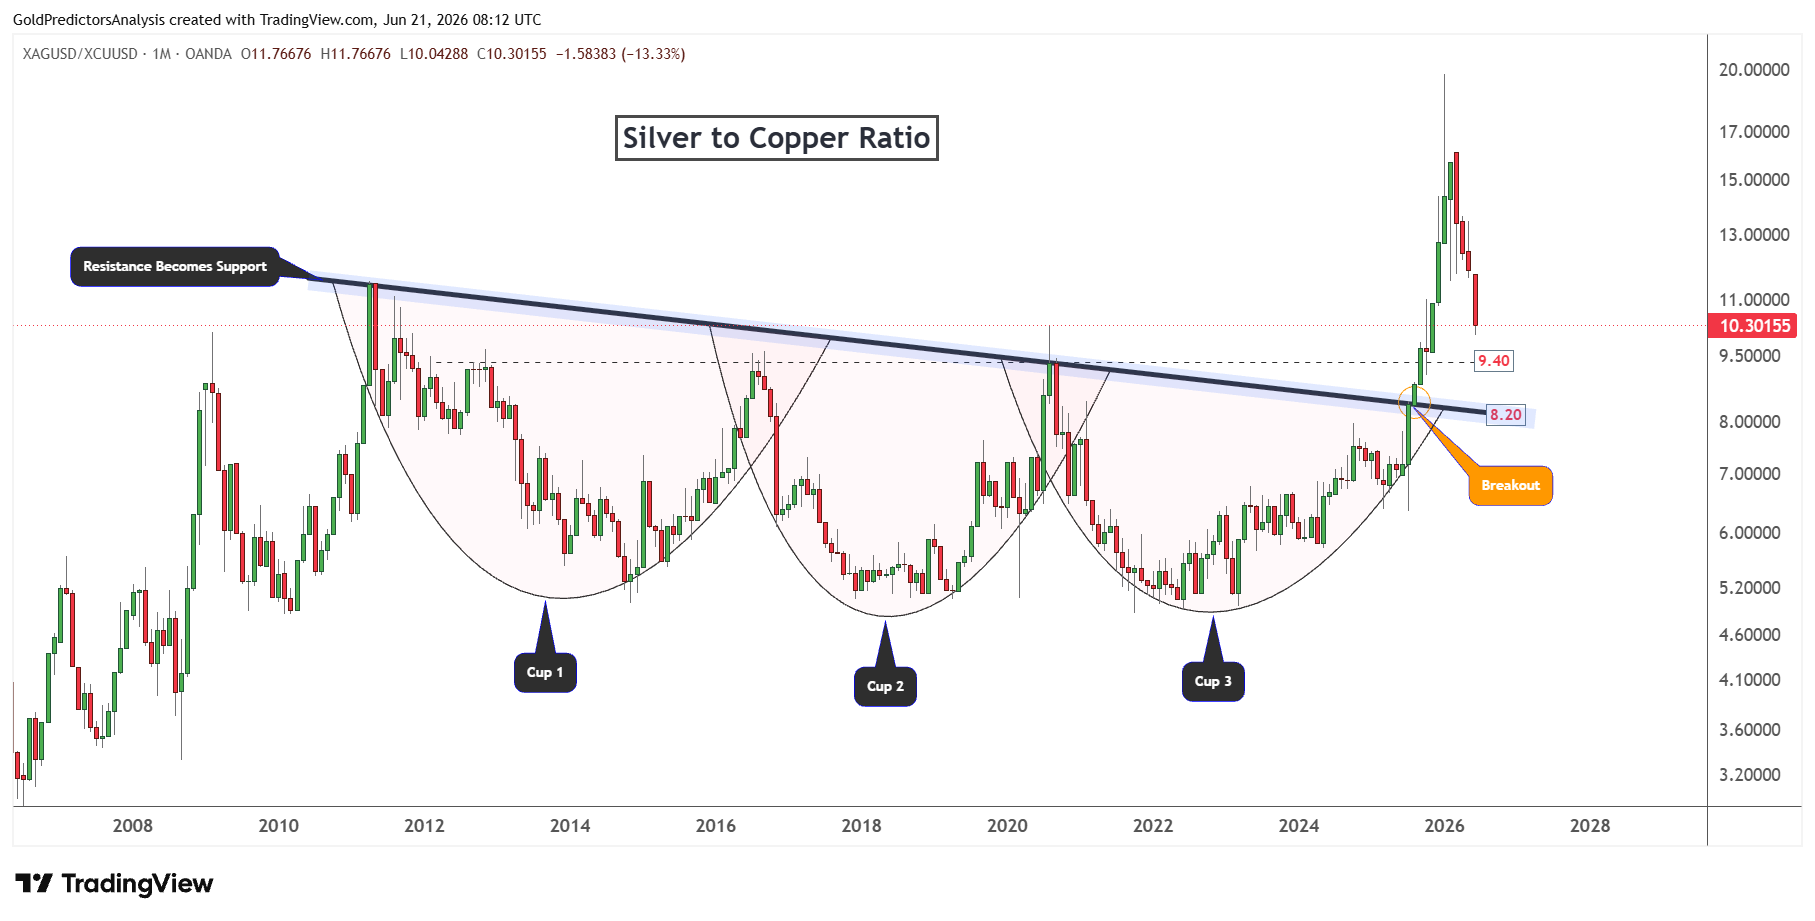
The ratio is again dropping to the support zone of 9.40. A break below 9.40 may push the ratio to 8.20. The strong bullish price action supports the silver leadership signal. If the ratio hits the zone, it will likely offer a strong buying opportunity for silver. The silver price is currently approaching the $50-$60 zone. This may become the buy zone if the silver to copper ratio moves into the 8.20-9.40 range.
What This Means for Copper and Silver Prices
The ratio charts show that silver currently has the stronger relative setup. Copper is trying to recover from the long-term support, as the copper to silver ratio has bounced off the bottom channel. But it has to move above 0.107 in order to validate copper’s leadership. Until then, silver will be in control as the silver to copper ratio has formed a constructive price action above 8.20 and 9.40 levels.
Copper may be able to keep moving higher as industrial demand, grids, AI infrastructure and growth in China continue to provide a positive momentum signal. A breakout above 0.107 on the copper-to-silver ratio would put the momentum back in favour of copper.
Copper Price Eyes $6.70 Breakout
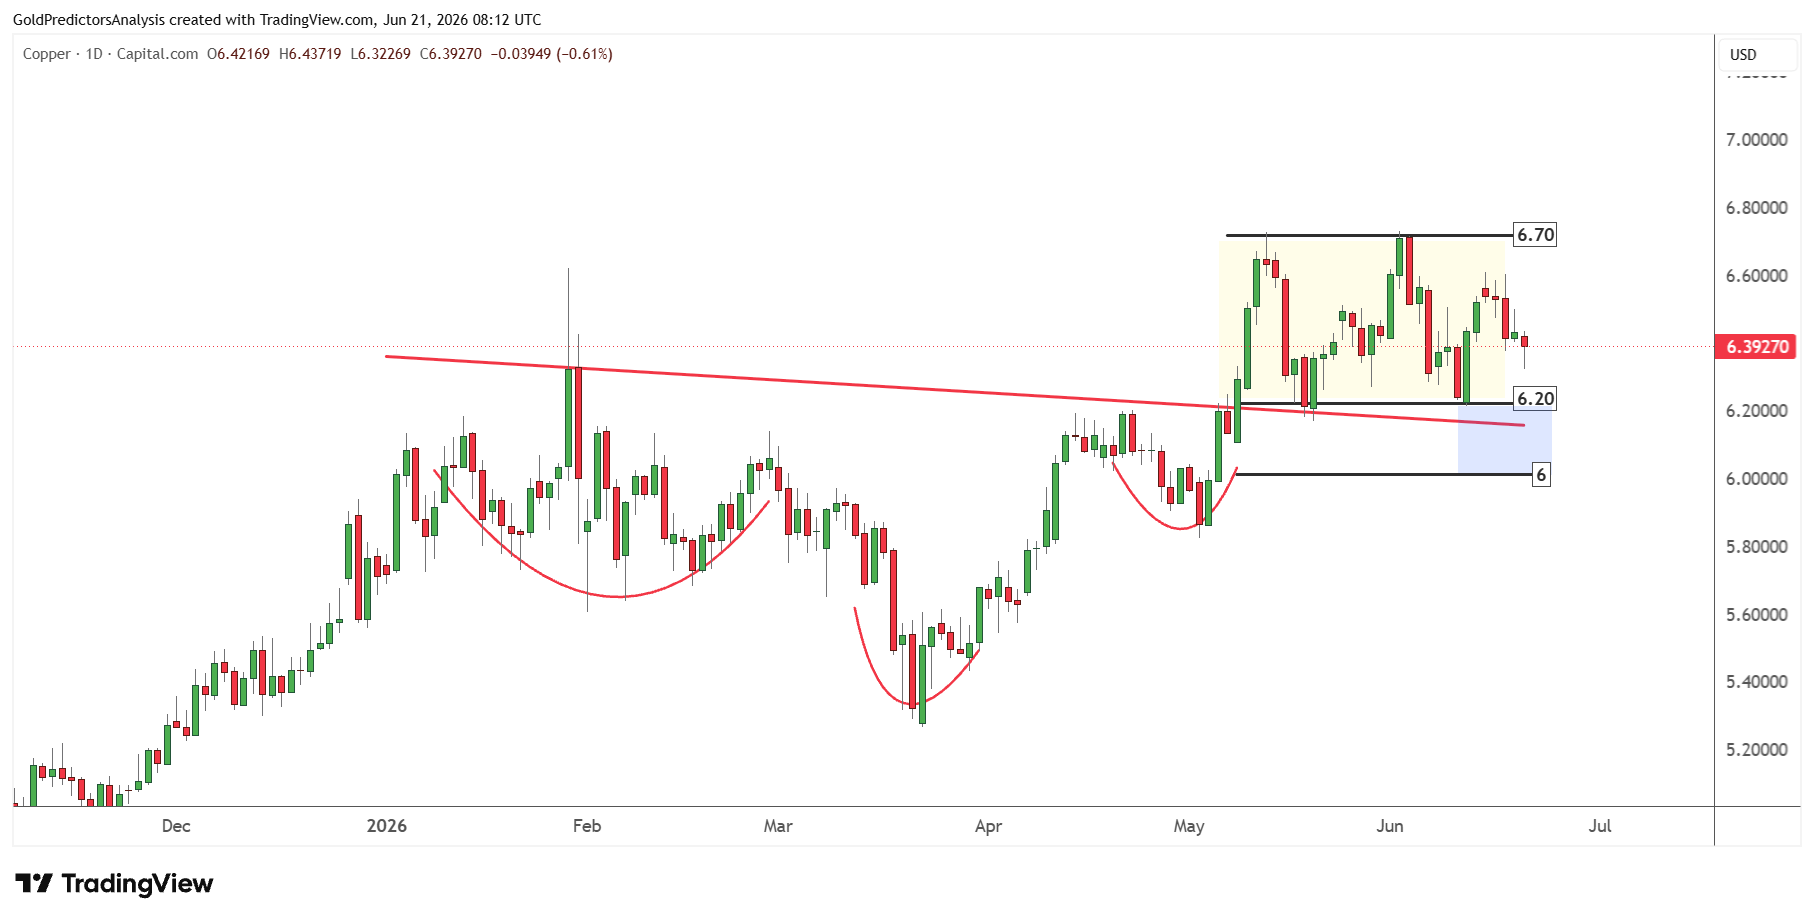
From technical perspective, the copper price has been consolidating between $6.20 and $6.70. This consolidation comes after the strong bullish formation from January 2026 to May 2026. This bullish formation is seen by the inverted head and shoulders pattern.
Therefore, a break above $6.70 will likely push copper prices higher. But the $6.00 to $6.20 range remains the key support zone in the short term. A break below $6.00 will likely push prices further to the downside toward $5.30.
Silver Price Eyes Buy Zone After Pullback
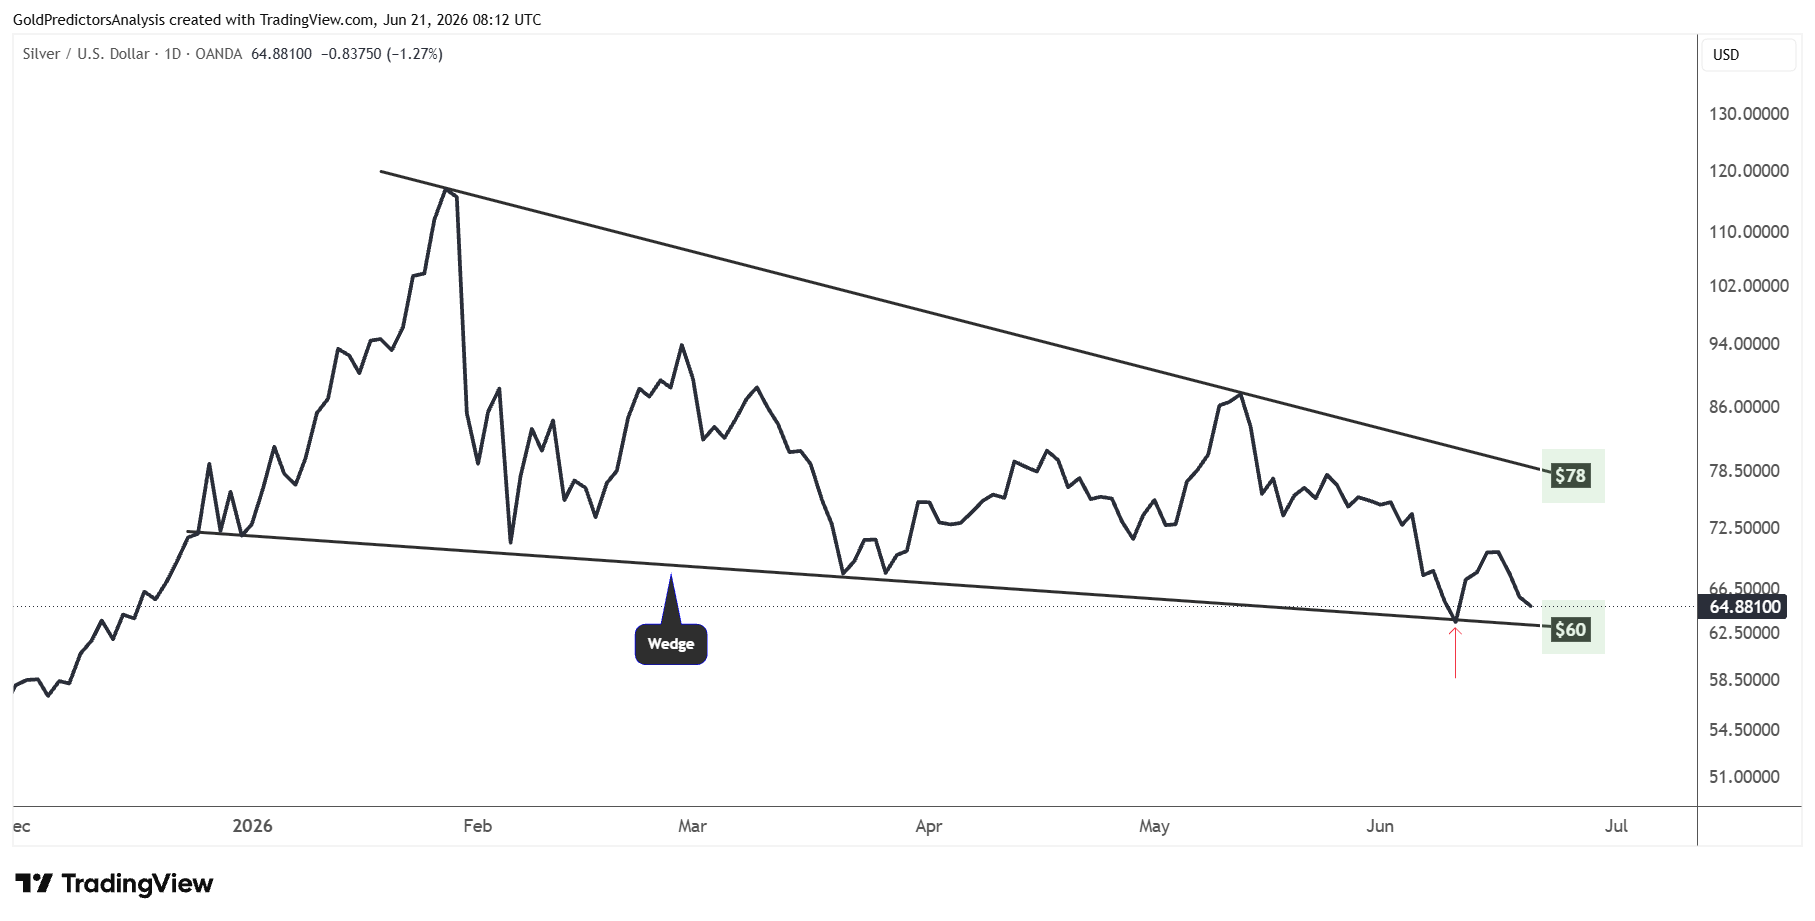
The silver price has also been declining since the January 2026 highs due to strong profit-taking. The formation of a wedge pattern shows that the price has been compressing between $60 and $78. A break of any of these levels will likely push silver prices in the next direction.
The latest drop toward the $60 region comes at a time when the silver-to-copper ratio approaches the long-term support of 9.40 to 8.20. Therefore, this correction in silver prices toward the $50 to $60 region will likely offer a strong buy signal for long-term investors.
Which Metal Leads the Next Rally?
The copper to silver ratio shows that copper is trying to recover, but the recovery is still not confirmed. The ratio needs to break above the 0.107 level to indicate that copper is again in charge. But the silver maintains the stronger relative setup. The strong long-term support in the silver-to-copper ratio at 8.20 to 9.40 indicates a strong bullish setup for silver. This bullish setup emerges from the cup patterns in the silver-to-copper ratio. This indicates that the monetary demand is still stronger than pure industrial demand, and the recent correction in silver will likely be a strong buying opportunity.
Copper has the potential to rally further if it breaks above $6.70 and remains above the $6.00 to $6.20 support zone. But the price is currently elevated and may correct before the next surge. This is due to the stable long term steady increase in copper prices. Silver is already approaching the long-term support zone of $50 to $60, where the next buy signal may emerge. Therefore, investors may consider buying silver near the long term support zone of $50 to $60 while waiting for copper prices to correct lower before building fresh long-term positions.
Read more: Hawkish Fed Puts Silver under $60 Support