


Silver (XAG) has rebounded from the $60 area after a sharp correction from the $120 high in January. In my view, this rebound shows that long term buyers are entering the market near the major $50 to $60 support zone. This article examines the inflation backdrop, Treasury yields, long-term price structure, short-term breakout levels and the key levels that may decide the next bottom in silver.
Sticky Inflation Supports Silver Rebound
Silver rebounds from the $60 after the strong pressure from sticky inflation and rising Treasury yields, but the long-term backdrop is improving. The US inflation rate increased to 4.2% for the 12 months to May 2026.
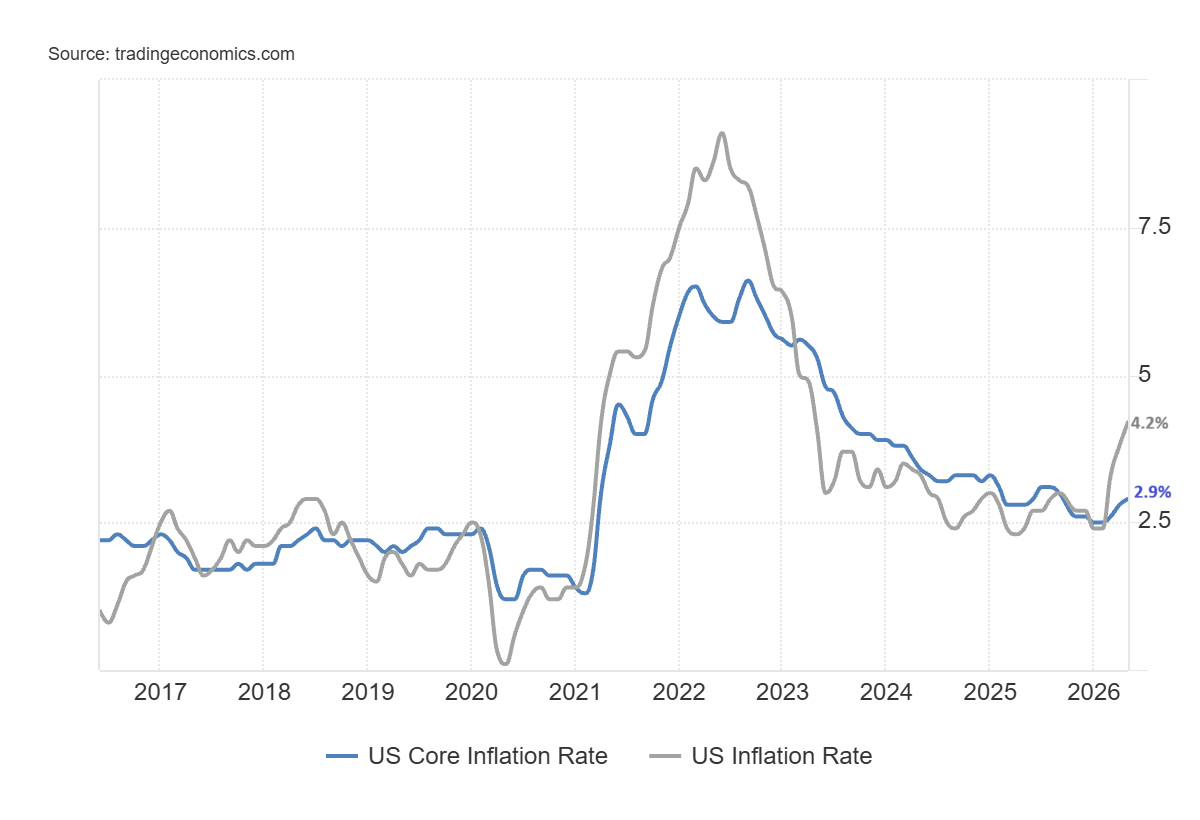
But the monthly CPI dipped to 0.5% for May 2026, which still translates to an annualized rate of almost 5.7%.
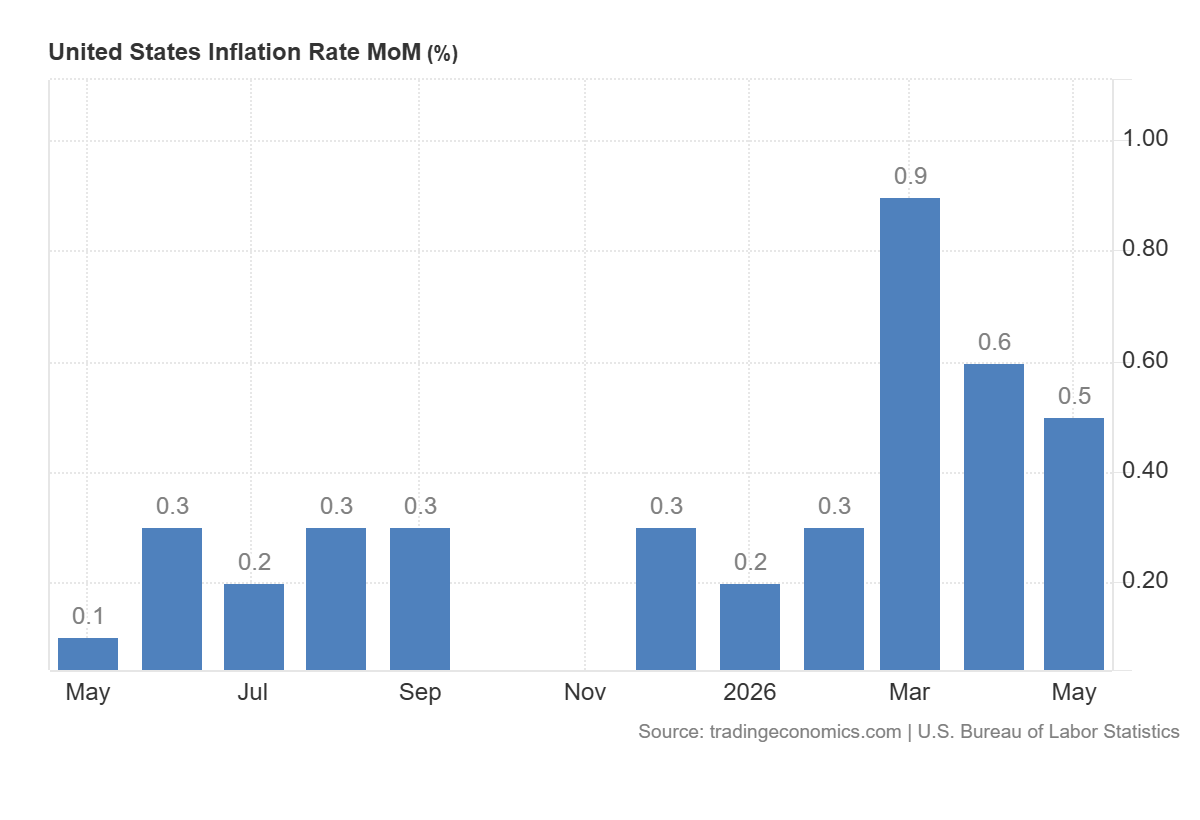
The bulk of the pressure is due to energy costs, which are linked with the energy impact of the US-Iran conflict and disruption of oil flows. This leaves the inflation risk on and supports silver prices.
Silver Price Forecast
Every new Silver analysis as it publishes, today's technical signal and key levels, live price — on one page.
See all Silver forecastsTreasury Yields and Fed Rate-Hike Fears Limit Silver Upside
The 2-year Treasury yield has increased to 4.16% after the US jobs data, which indicates that the markets are expecting rate hikes. These positive trends in yields put short term pressure on the silver price. But the latest hopes of a US-Iran peace deal have resulted in a downside correction in Treasury yields which has lifted silver from the significant support area.
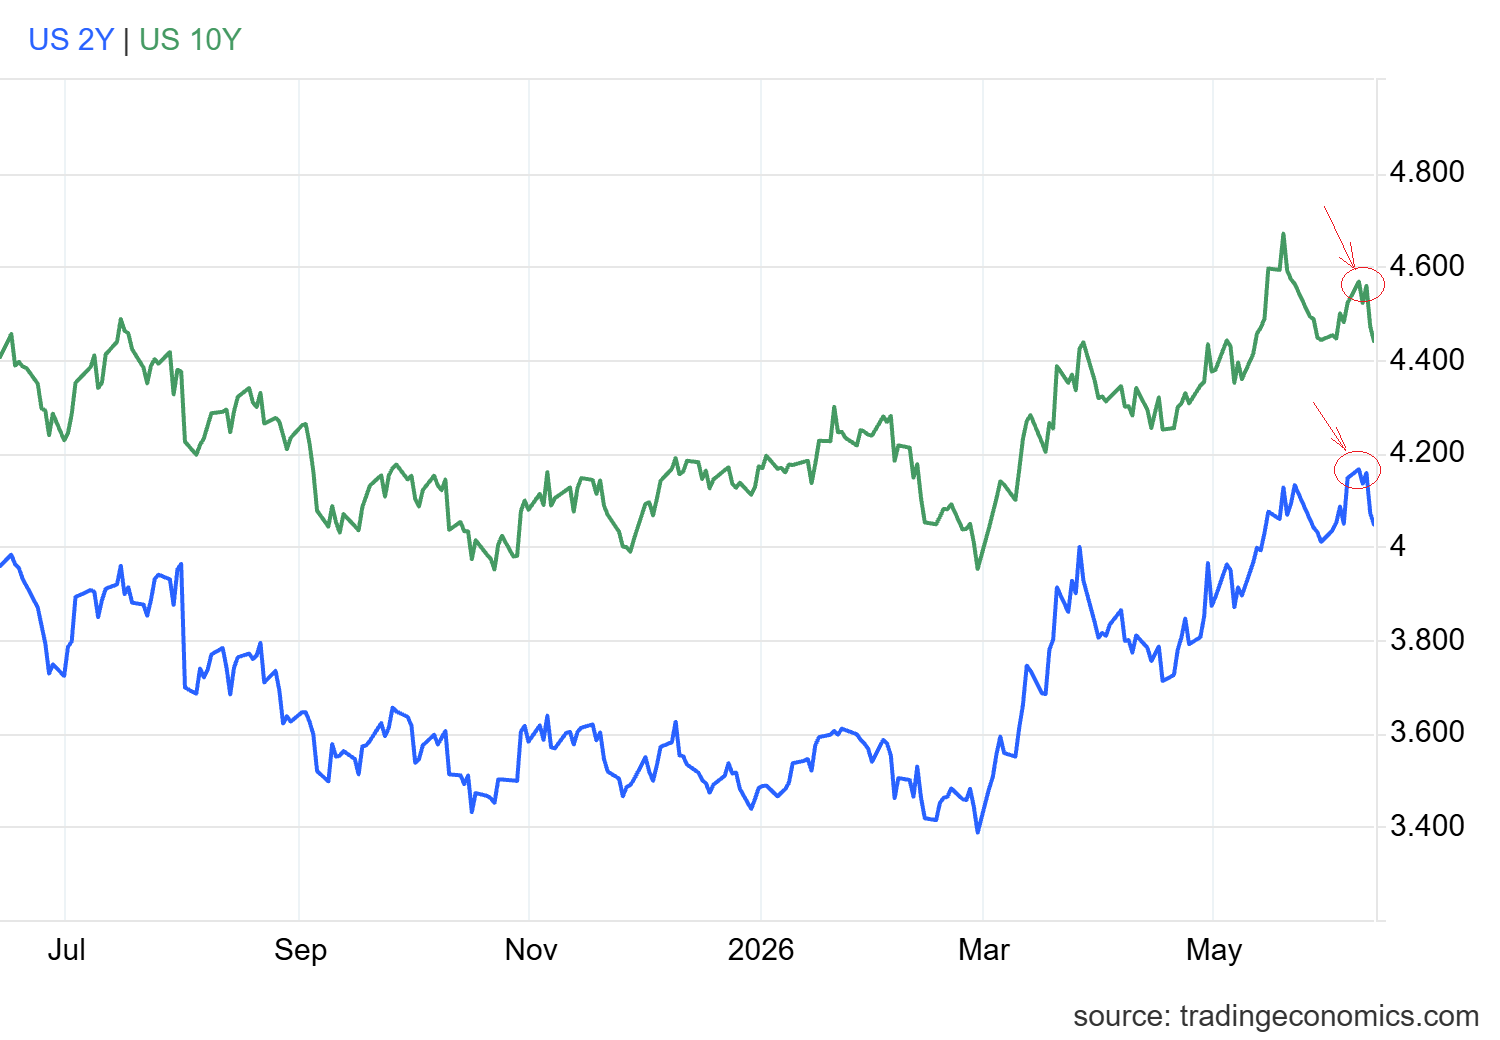
The 10-year Treasury yield also made a step down after the headlines of the US-Iran peace deal but is still above 4.5%. If the 10-year yield maintains the 4.5%, the next move might develop to 4.75%.
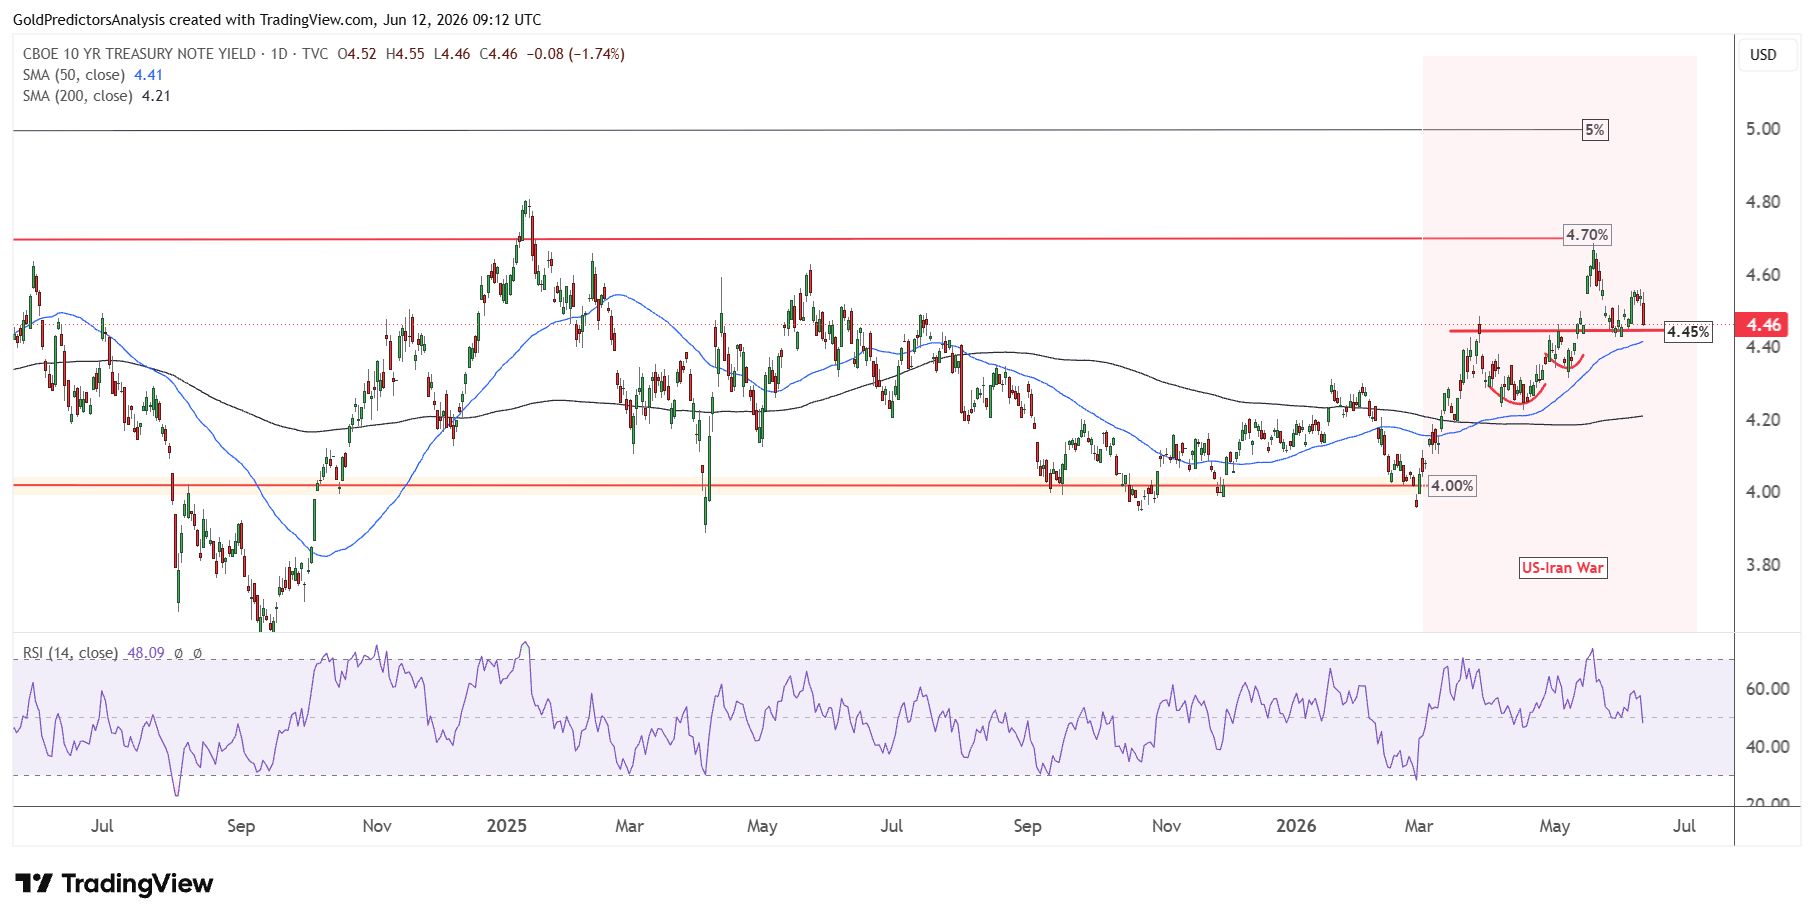
So if energy stress and the Fed continue to lag and inflation continues to ramp up, there may be opportunities to invest in silver during corrections. Hence, the $50-$60 price band is still a good opportunity to load up for the long run.
Financial Conditions and Energy Risks Support Silver
Financial conditions are also loose. The Chicago Fed National Financial Conditions Index was at -0.506, indicating easy monetary conditions. But the downtrend is slowing. That implies that liquidity remains conducive, but the market might react more strongly to inflation shocks, Fed signals and energy prices.
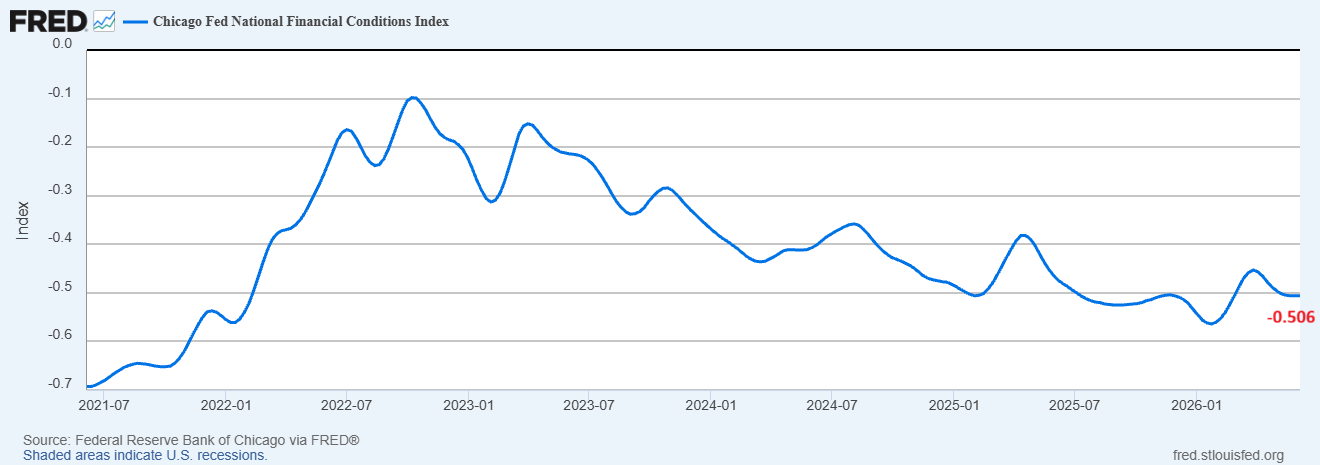
This is a mixed short-term setup for silver. Easy financing conditions are conducive to risk assets and industrial demand, and rising yields and a strong dollar can limit upside.
The bigger catalyst remains the shock of energy from the Middle East. A deal between the US and Iran could ease pressure on oil markets and take off some inflation worries. But a permanent solution is yet to be found. The inflation could remain higher if energy prices continue to rise, which may push the US Treasury yields to 5%.
This would certainly introduce short term volatility into silver. But it would also strengthen the long-term bullish picture for silver as the purchasing power of the U.S. dollar will be eroded by inflation. In my view, the current weakness in silver is not a failure of the long-term bull market.
Long-Term Silver Price Patterns Signal Strong Support
The long-term price for silver remains in a strong bullish ascending channel, as seen in the monthly chart below. The price hit $120 in January 2026 at the resistance of this channel pattern and started a strong correction. The formation of sharp shadows in the monthly candles of January 2026 and May 2026 indicates selling pressure. This pressure pushed prices towards the breakout zone of $50 to $60.
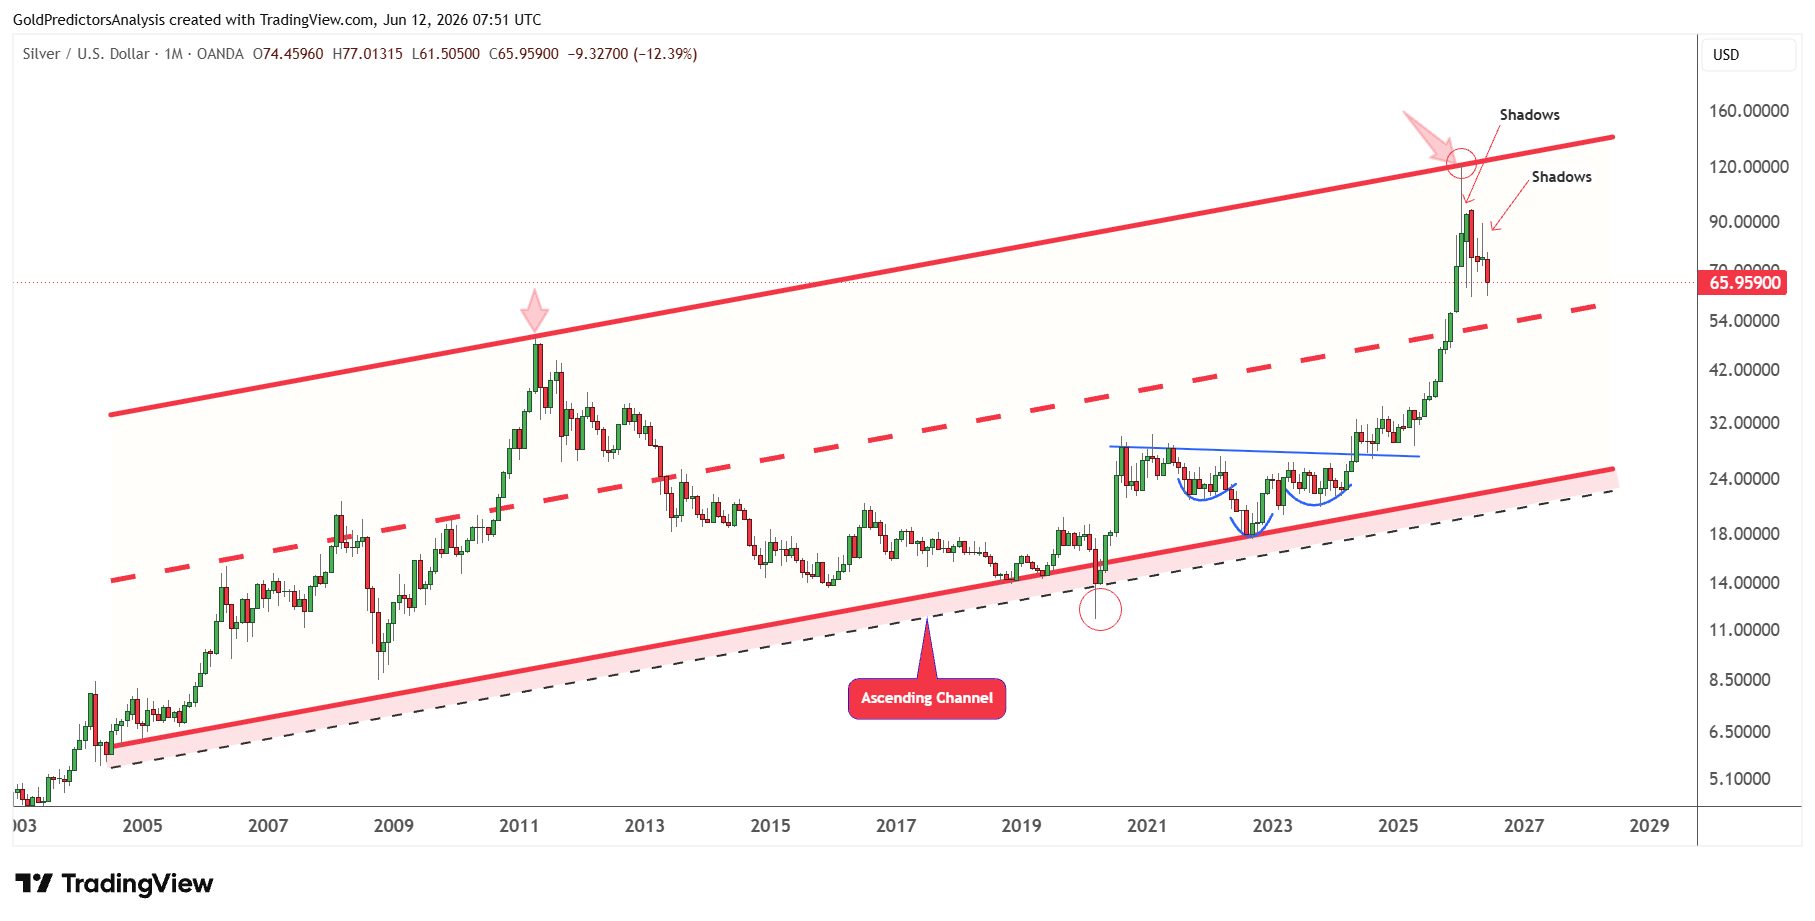
However, the overall price structure remains strongly bullish. The monthly candle of March 2020 formed a sharp shadow. The inverted head and shoulders pattern from September 2020 to May 2024 further supported this bullish structure.
Therefore, the recent correction from the $120 is considered a profit-taking move. This move will offer strong buying opportunities for long-term investors once this correction is over.
The bullish structure is further observed using the cup-and-handle formation within the triangle pattern on the monthly chart. This cup-and-handle pattern broke at the $50 region at the black dotted trend line, which pushed prices towards $120. Now the price is retesting this breakout area to form the foundation for the next surge.
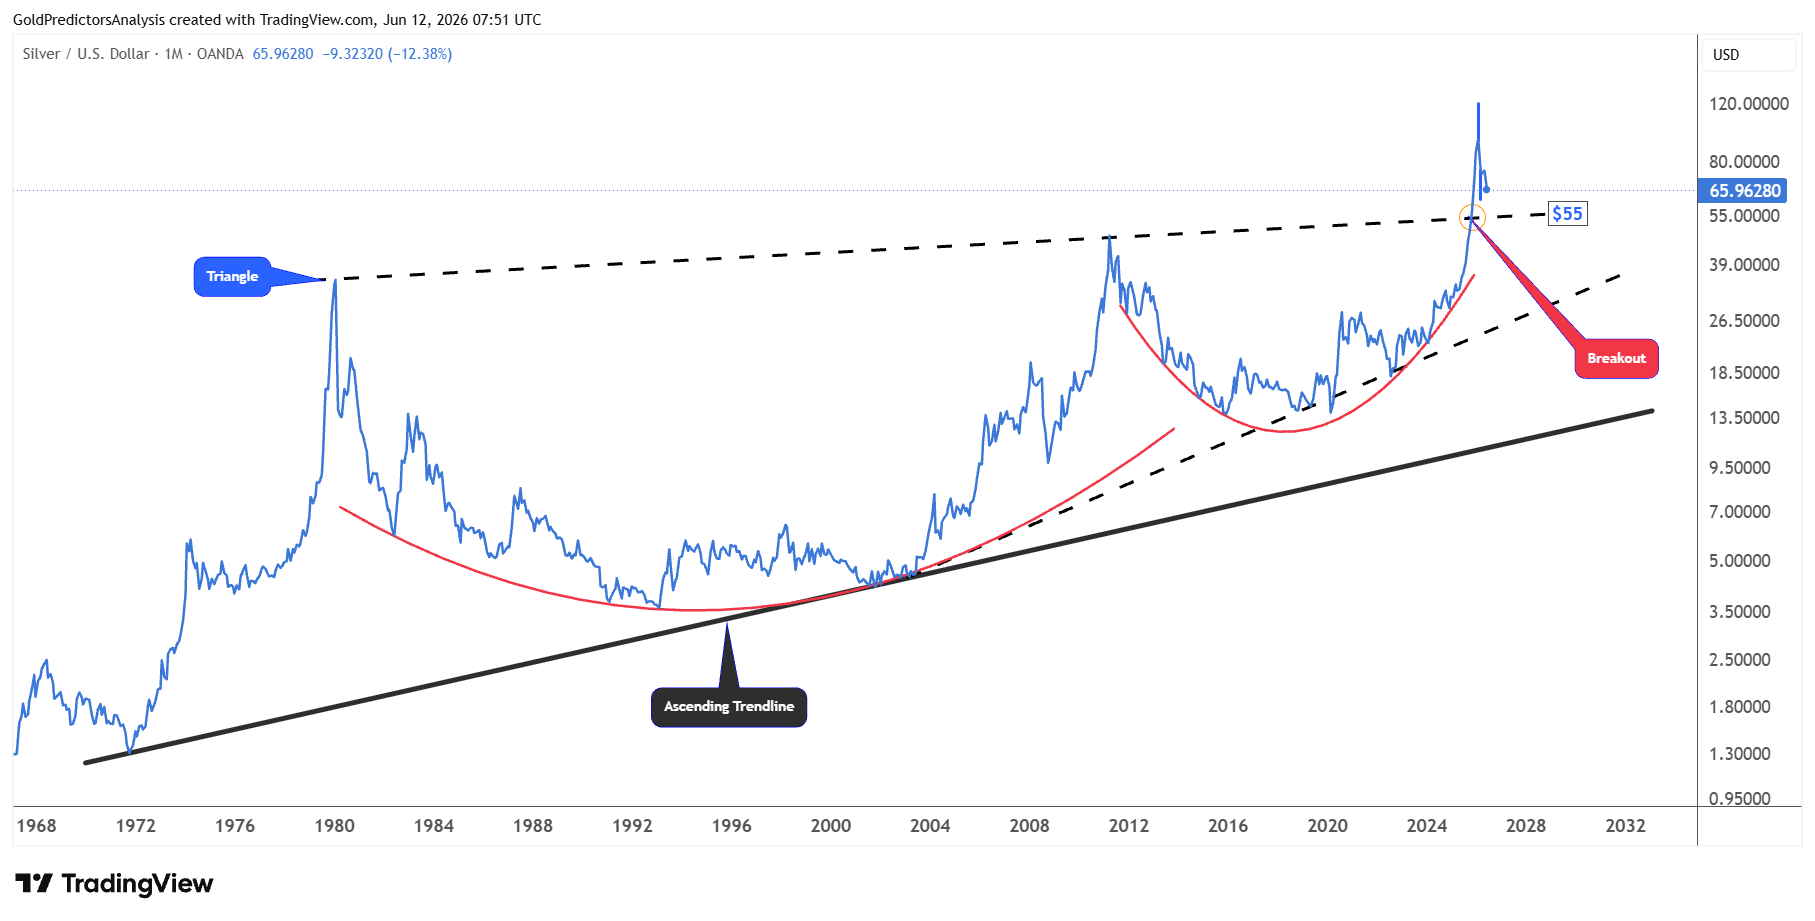
To further understand the same cup-and-handle pattern, the chart shows the peaks of 1980, followed by 2011. These peaks draw the neckline that approached the $50 in 2026.
The $50 level has a strong deviation of $10. Therefore, this zone is defined between the $40 to $60 region.
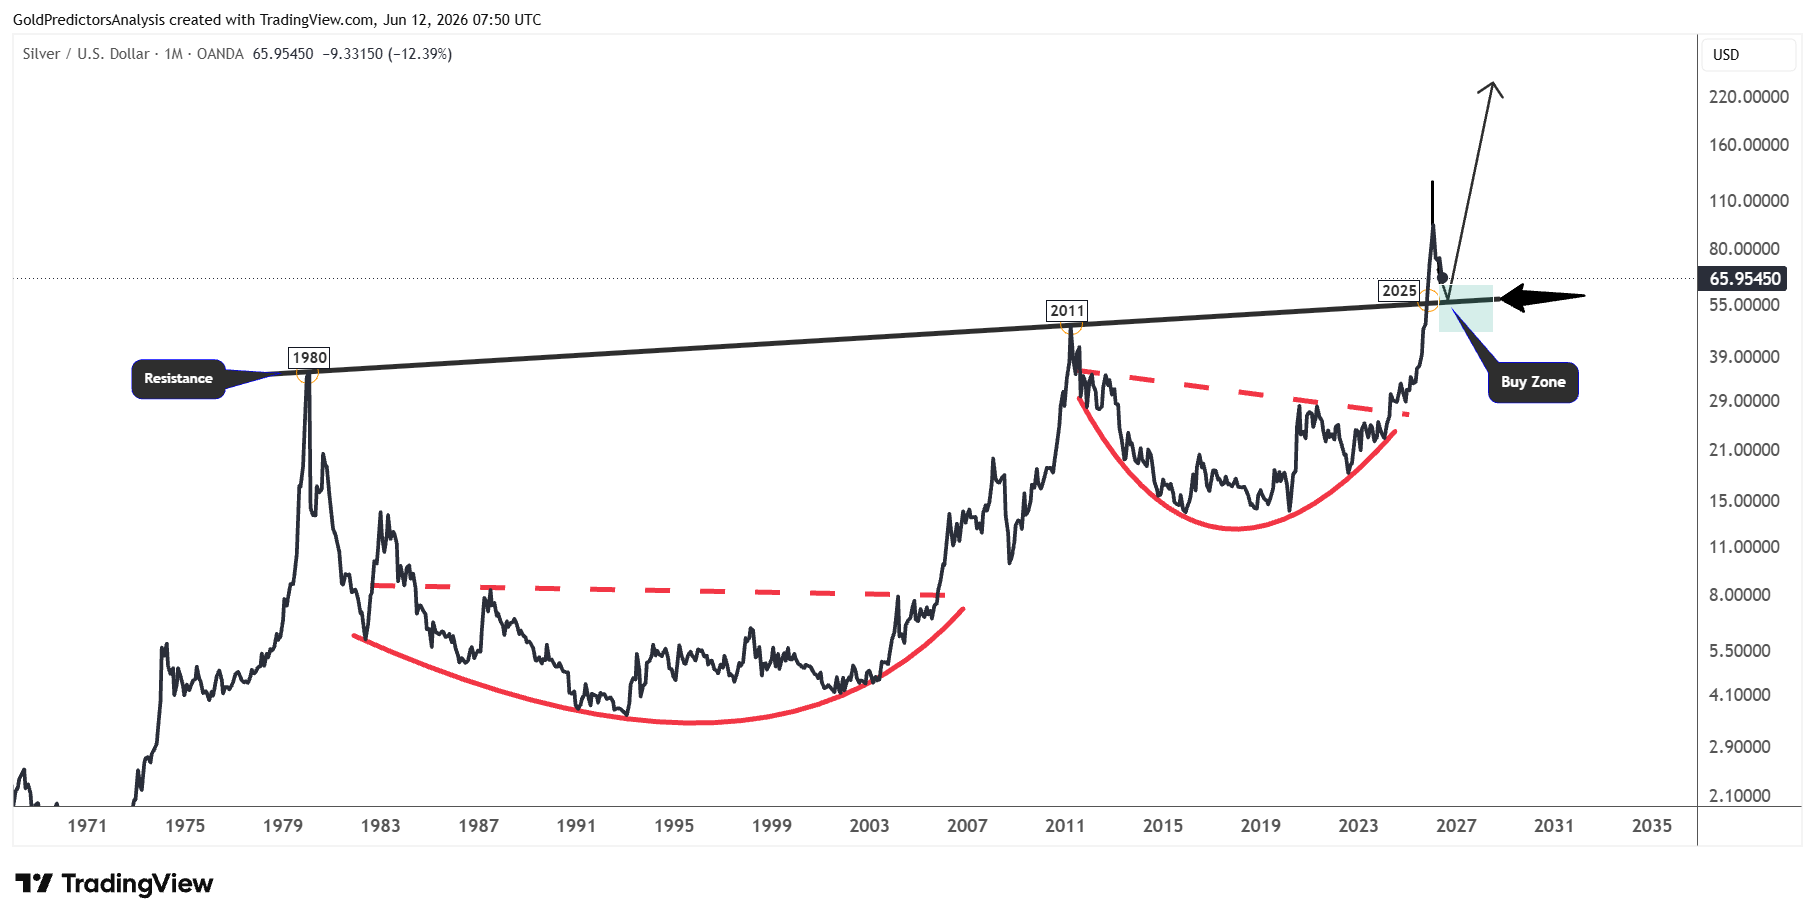
Recently, the price has hit the upper band of the support zone, which lies around the $60 area. The price is initially retracing and rebounding from this area and requires further confirmation. A break above $76 is required initially to push the prices to $80. But a confirmed break above $100 in silver is still required for a confirmed bottom.
Short-Term Silver Forecast: $76 Breakout Holds the Key
The short-term price structure also shows that the recent correction in spot silver remains in a healthy bullish trend. This healthy bullish price pattern is formed by the formation of a bull flag pattern as discussed in the previous article.
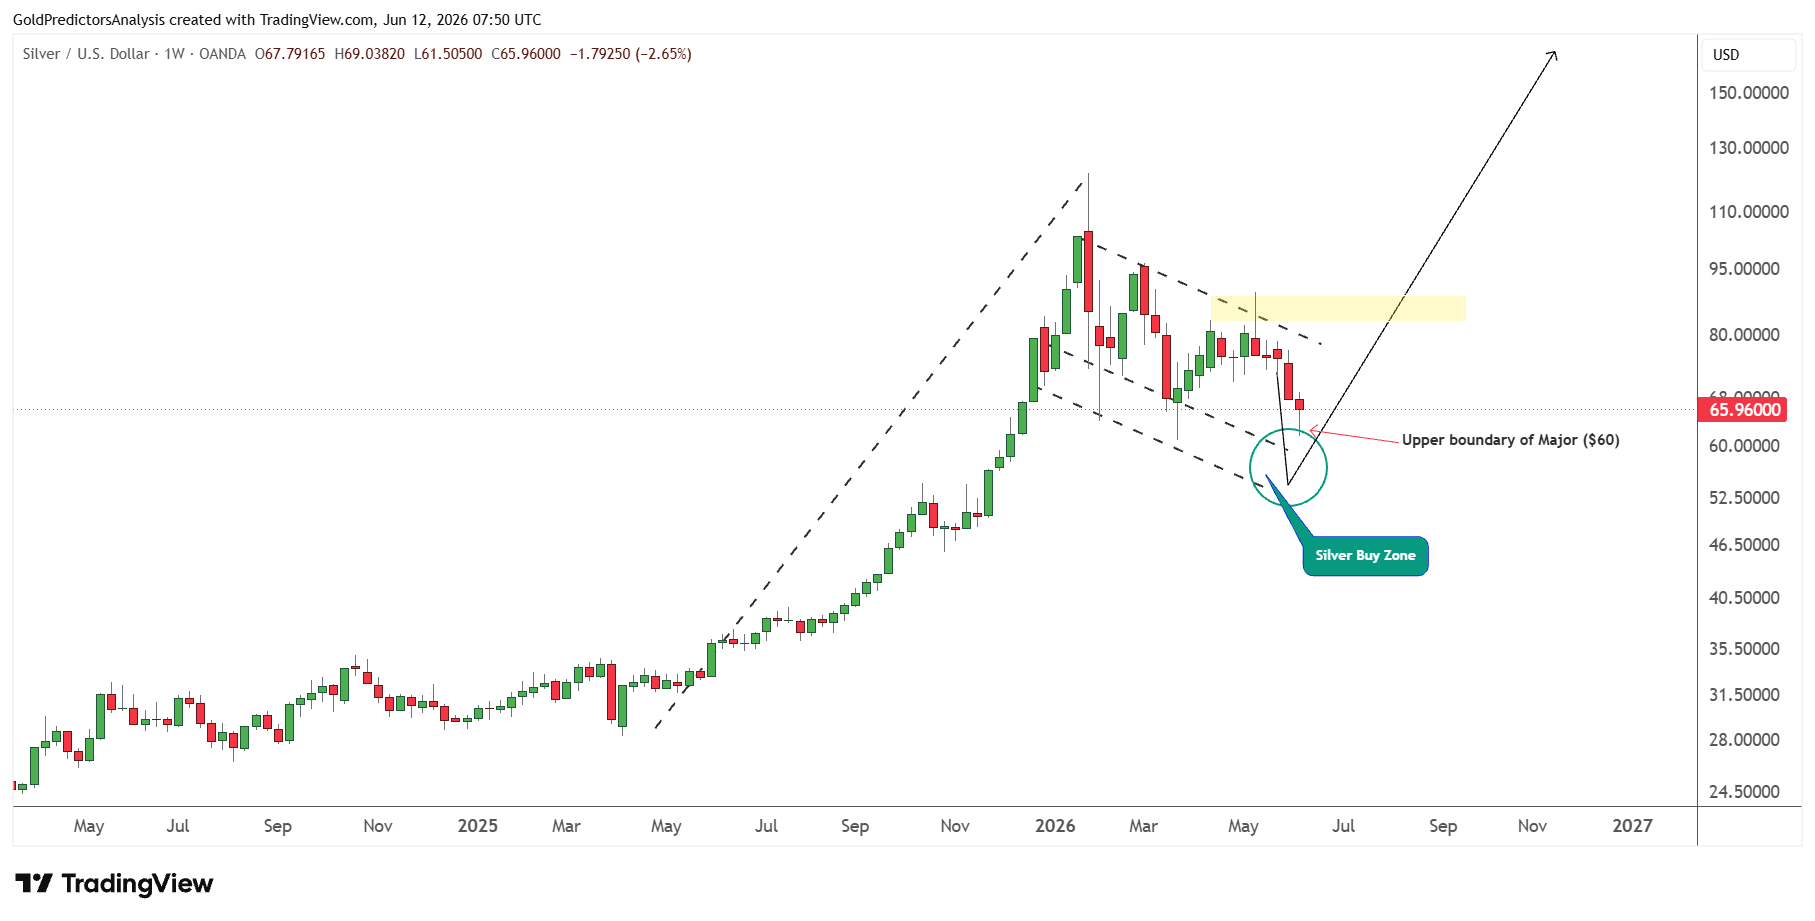
The silver price is already retracing and has hit the $60 area, which is the upper boundary of the major $60 support. The silver price may further drop towards the $40-$60 region and consolidate at a lower level before reversing higher. However, the recent reaction in silver around $60 is due to the strong daily support.
Now it requires a weekly close in the silver to confirm the next move. A weekly close above $76 will likely indicate that the rally may extend towards the $80 to $95 region in the short term. But if prices close at lower levels below $65, it will likely indicate further consolidation or a drop to attract new buyers.
This rebound in the silver price is also evident on the daily chart. The chart shows the formation of a wedge pattern. This wedge lies around the $60 to $62 level, which triggered demand. A break below $60 will likely push prices further downside towards the $50 area.
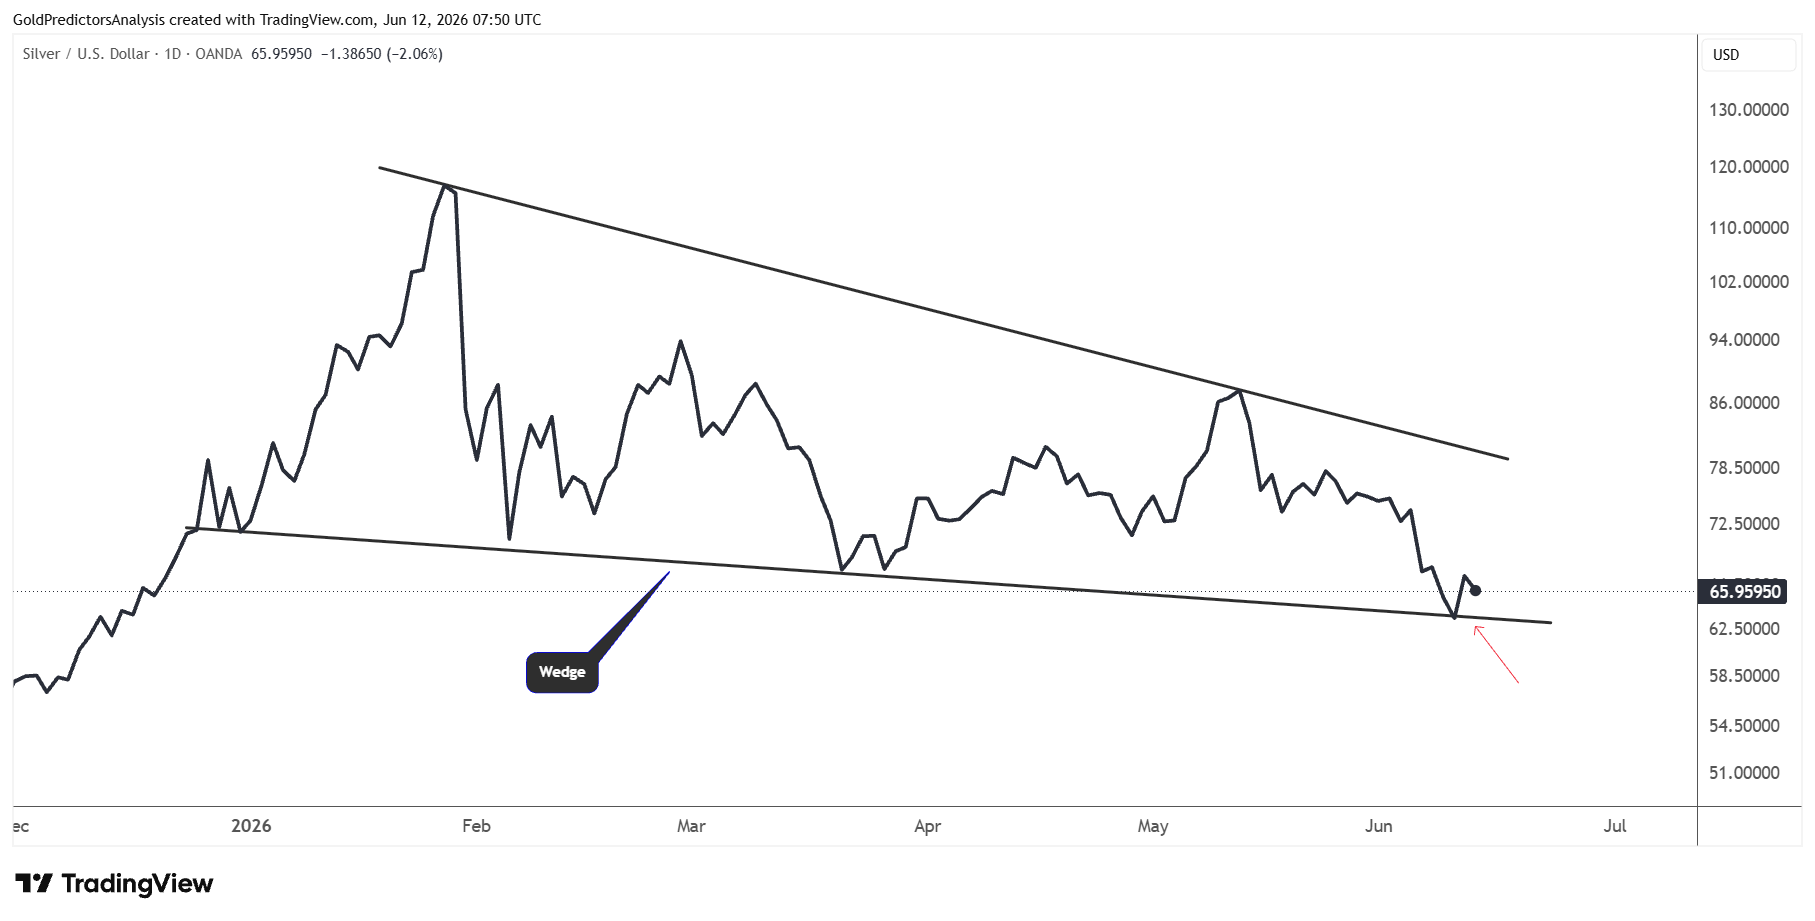
Overall, the silver market remains within correction mode and requires further confirmation for the bull market. This correction remains healthy and will offer strong buying opportunities for the next move in silver.
Key Risks to Watch for Silver Prices
The key risk to watch is the strength in the U.S. Treasury yield and US dollar. If the U.S. Treasury yield continues to accelerate towards 4.75%, it will likely keep silver prices under pressure below the $80 area.
If the USD index continues to move towards the resistance of the 100.50 level, silver prices may face limited upside in the short term. But if the USD index breaks below 96, silver prices will likely confirm a bottom.
From technical perspective, the silver price presents strong blow-off conditions similar to the 1980s, which triggered a strong top. The chart below shows that the silver market has pushed the RSI to similar levels to those of 1980s.
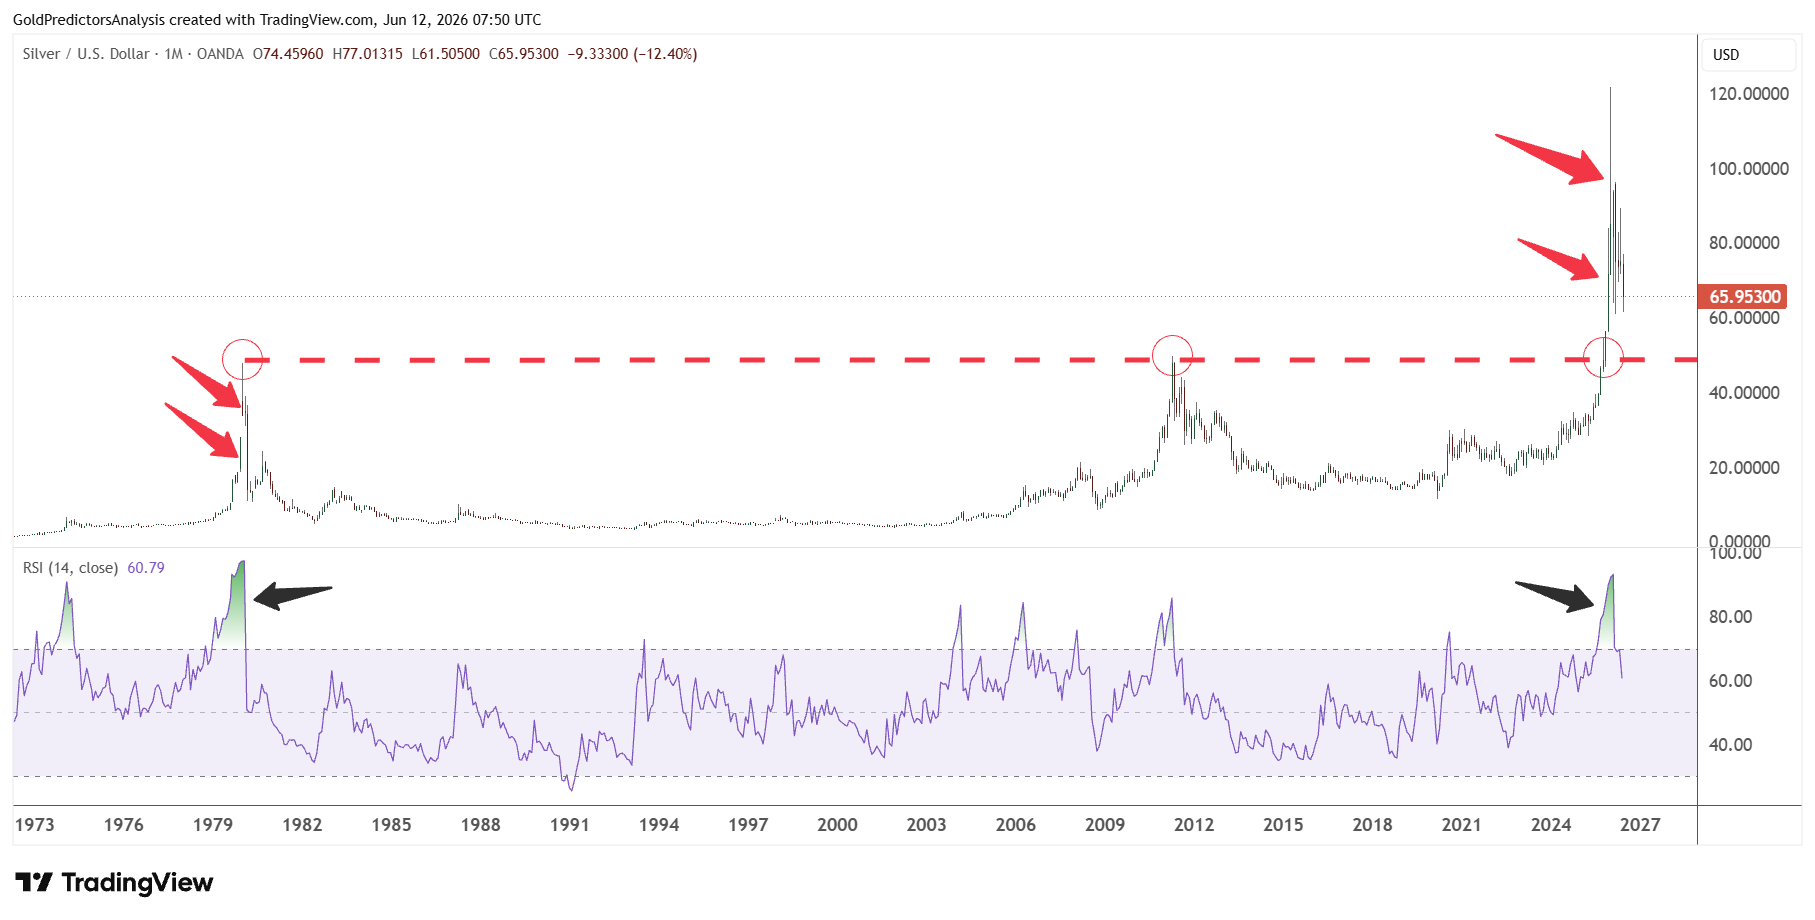
The recent correction from $120 towards the $50 to $60 region is similar to the way it developed in the 1980s. Therefore, if silver prices break below $50, they will likely continue to trade towards the $30 to $31 region. This will likely keep silver prices under consolidation for a longer period.
What is Next for Silver Prices?
Silver remains in correction mode but the broader picture continues to point to a long-term bullish scenario. The big area to pay attention to is the $50 to $60 zone as it is the major long-term support. If the price breaks $76 on the weekly chart, it will be the first real indication of the return of the buyers. A break above this level may push the silver price to the $100 area. A break above $100 will confirm that the long-term bottom.
The biggest risk comes from the U.S. Treasury yields and the U.S. dollar. If the US dollar index rises towards 100.50, silver may stay under pressure for longer. But if the dollar support level at 96 breaks and yields begin to loosen, then silver could create a more solid bottom. I believe the current dip is a good buying opportunity within the healthy bull market. Silver is currently rebounding from the upper band of the support zone and requires a weekly close above $76 to confirm the next move.
Read more: Why Silver Could Still Reach $300 Despite Pullback