


Silver (XAG) remains under pressure as robust U.S. employment data, rising Treasury yields and a strong U.S. dollar continue to support the expectations of higher rates for longer. These factors put downward pressure on precious metals. In my view, this correction will set up the next significant buying opportunity for long-term investors. This article discusses the macro factors, oil-driven inflation risks and the mixed messages of the ISM manufacturing data. The article focuses on the short-term and long-term price structures to understand how these macro factors may shape the next move in silver.
Fed Rate Fears and Oil Inflation Pressure Silver Prices
Silver remains under short term pressure as strong U.S. jobs data keeps Fed rate hike fears alive. The demand for precious metals has been dampened by interest rates and a stronger U.S. dollar. This pressure has hit gold (XAU) and silver, but silver still has better industrial demand support than gold.
Despite this support from the industrial side, the silver market dropped harder than gold, which suggests strong market volatility. Gold prices dropped by 4.68% last week, while silver dropped by 10.01%. On the other hand, the daily loss after the U.S. jobs data was 3.29% in gold while silver dropped by 8.31%. This drop was due to the expectations that the U.S. Fed would raise rates after the latest U.S. labor data.
Another important factor for silver is oil prices. Crude prices rose as renewed Middle East tensions raised inflation fears. This makes it a challenging situation for silver. Inflation also helps hard assets in the long run but it can also force the Fed to maintain higher rates for longer. That is why silver is falling in the near-term despite the overall inflation theme.
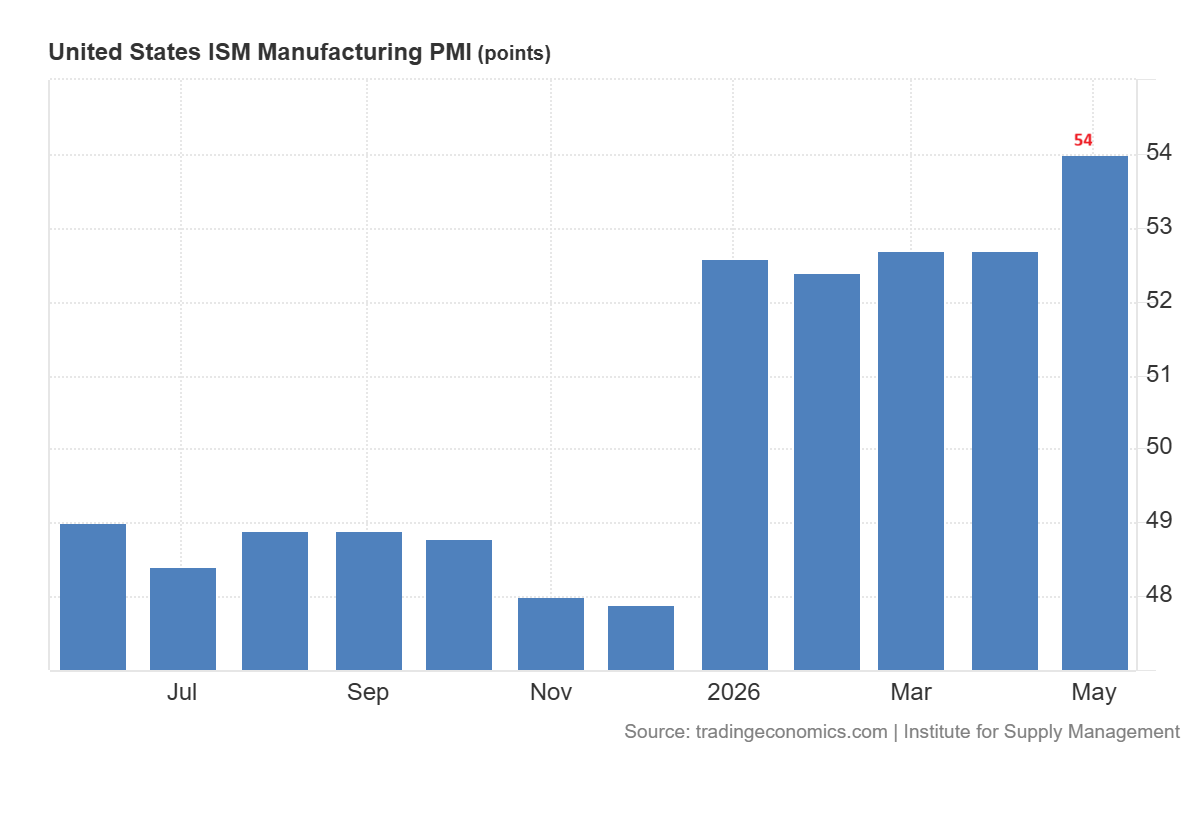
The ISM manufacturing PMI is a mixed bag for silver. The chart below shows that the factory activity improved in May.
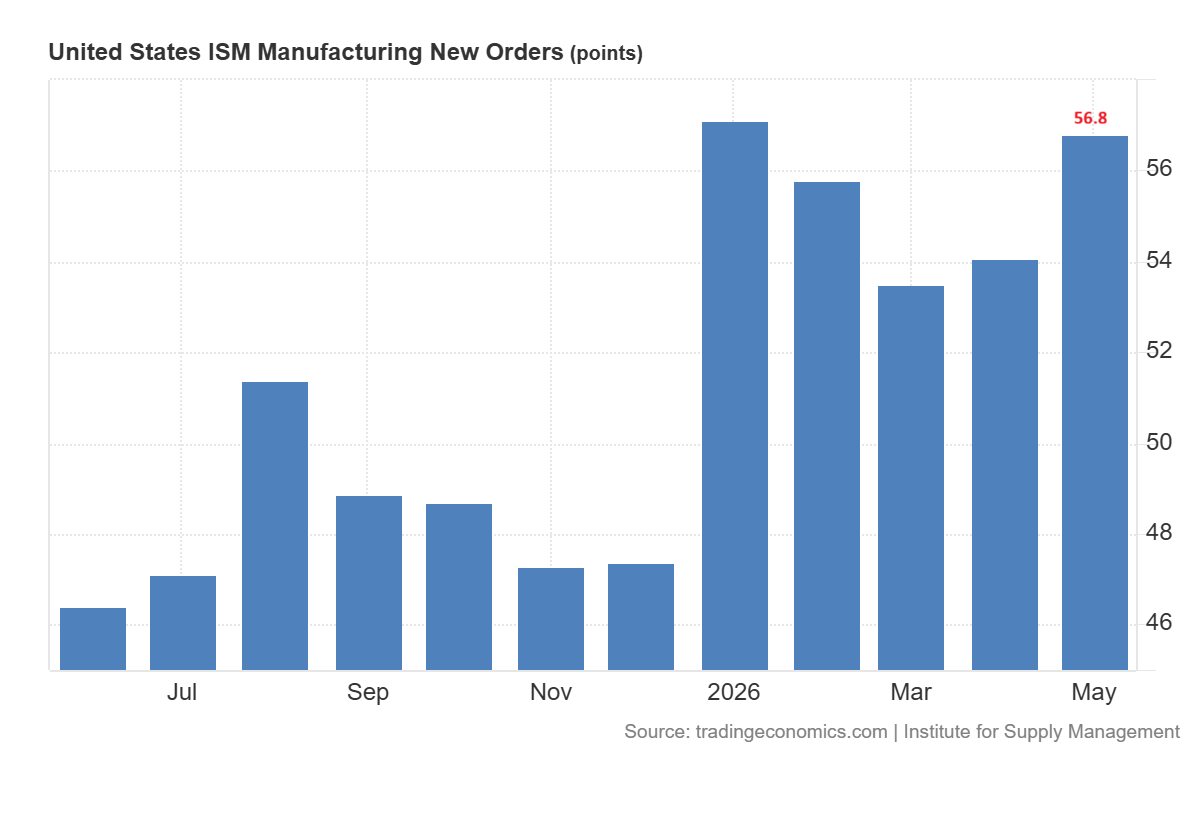
Moreover, the new orders also reflected improved demand.
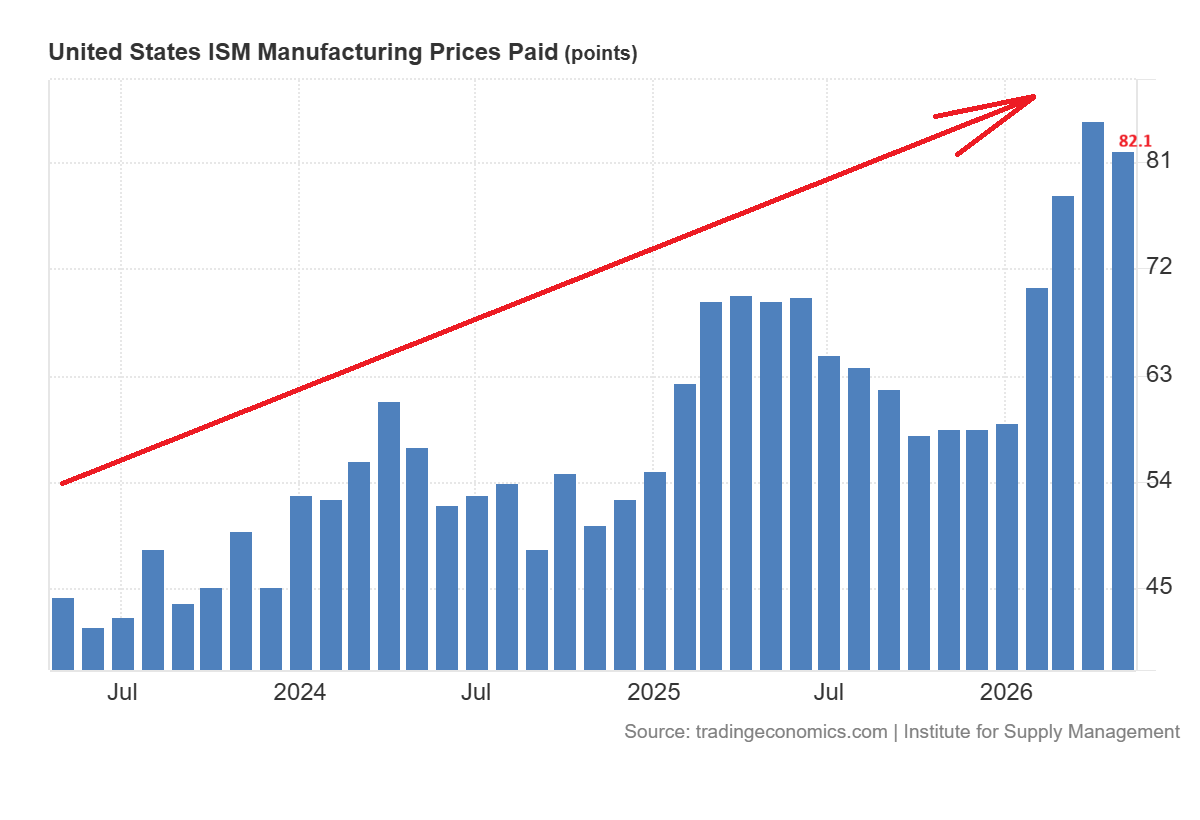
This helps the industrial aspect of silver since silver is utilized in the manufacture of electronics, solar, electric frameworks and supplies. But the ISM prices index continues to indicate that cost pressure remains high due to petroleum-based products, tariffs, steel and aluminum. This maintains the inflation risk high and increases pressure through Fed expectations, despite improving manufacturing demand.
Silver Price Forecast
Every new Silver analysis as it publishes, today's technical signal and key levels, live price — on one page.
See all Silver forecastsPrevious Discussion on Silver Correction
Silver price has begun the more defined short term correction as mentioned in the previous analysis. It was expected that a break below $70 will open the door for a drop to the $50-$60 zone. This is the zone where the buying interest might develop. The latest breakdown now highlights the growing volatility and lack of short-term momentum, making that situation increasingly important.
But that doesn’t necessarily negate the larger bullish trend. The larger trend continues to be driven by the long-term breakout from the prior resistance area, the supply deficit, industrial demand, growth in renewable energy demand and growth in the AI infrastructure. The price could continue to be under pressure in the short term. But a bounce from the major support zone may set up the next solid bottom for the next rally.
Silver Price Structure: Long-Term Breakout and Yearly Close
Price Breakout Confirms Long-Term Bullish Structure
The long-term price structure for silver remains strongly bullish, as the silver price broke the $30 level for the first time in 2025 (confirmed yearly close). The price also broke the $50 level for the first time in 2025 and marked the highest yearly close.
This breakout was important because the silver price had been forming a cup and handle pattern over the past 40 years. The price attempted to break above $30 in 2011 and 2024. But each time it reached this level, the silver price corrected sharply.
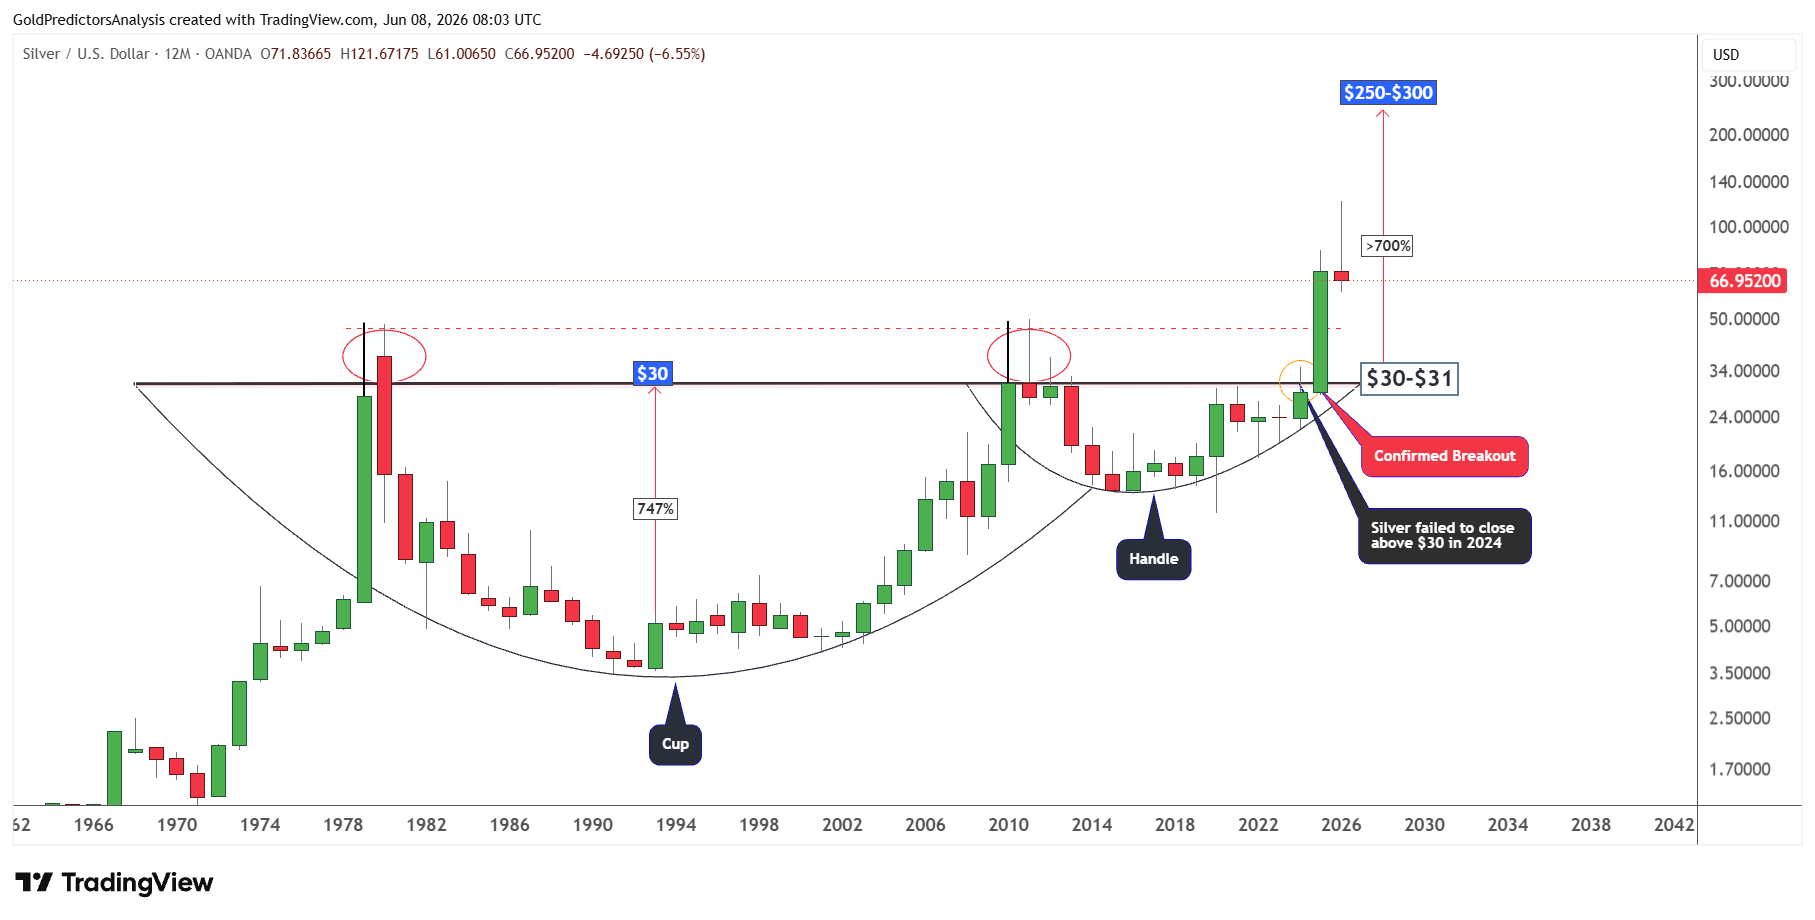
The massive breakout in 2025 pushed the silver price to a high of $120 in 2026. This breakout indicates that the price may surge by 700%. The cup and handle breakout measures this target of $250-$300.
Silver Yearly Close Will Decide the Next Major Move
To further understand this correction in the silver market, silver must close the yearly candle above $100. This closure will maintain a bullish outlook for 2027.
The silver price is correcting lower after strong profit-taking at record levels. If the silver price closes above $100 in 2026, it will keep the possibility of a continued rally in 2027.
But if the silver price corrects and continues to consolidate below $100, there are two possible scenarios. The first scenario is that the silver price corrects towards $50 and then continues to surge towards the $250 area. On the other hand, the second scenario is that the silver price corrects with a big factor towards the $30 level and then continues to move towards the $250 area.
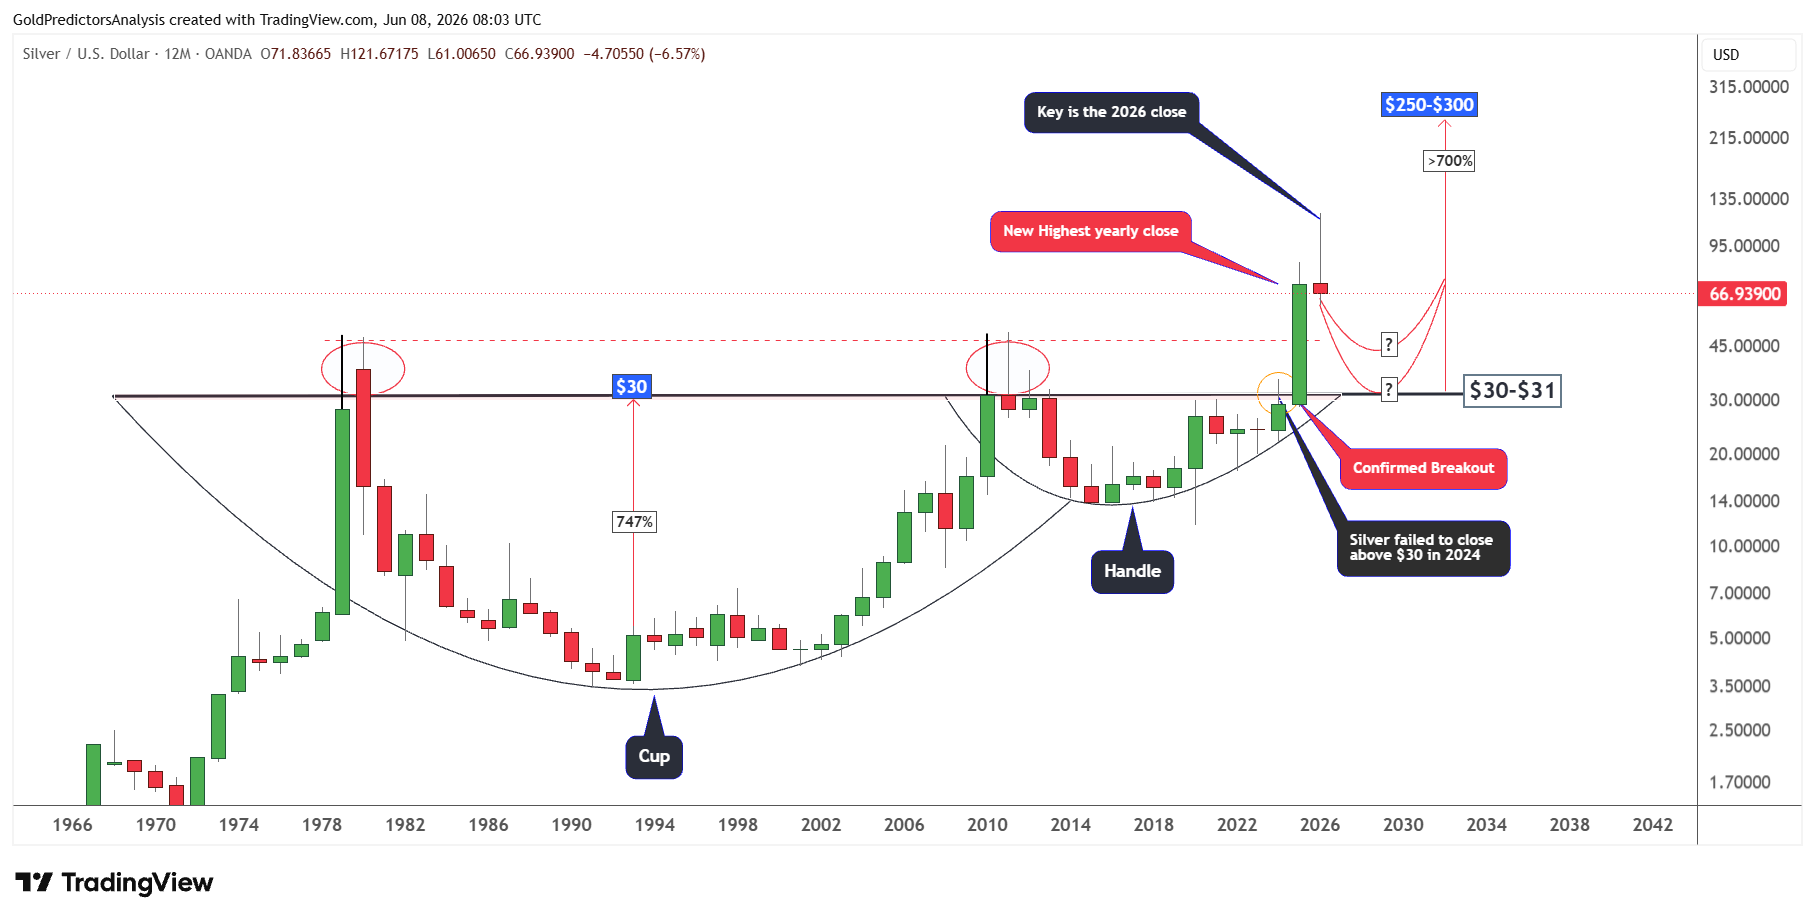
But a yearly close below $30 will invalidate the bullish outlook and signal further downside during the next quarters. But this is an unlikely scenario at the moment.
The silver price has already fallen by around 50% since the record high of $120 in 2026. The strong big candle in 2026 is very important and very similar to 1980 and 2011, when silver prices marked big record highs. The linear scale shows this candle more clearly by introducing the volatility in the long-term chart.
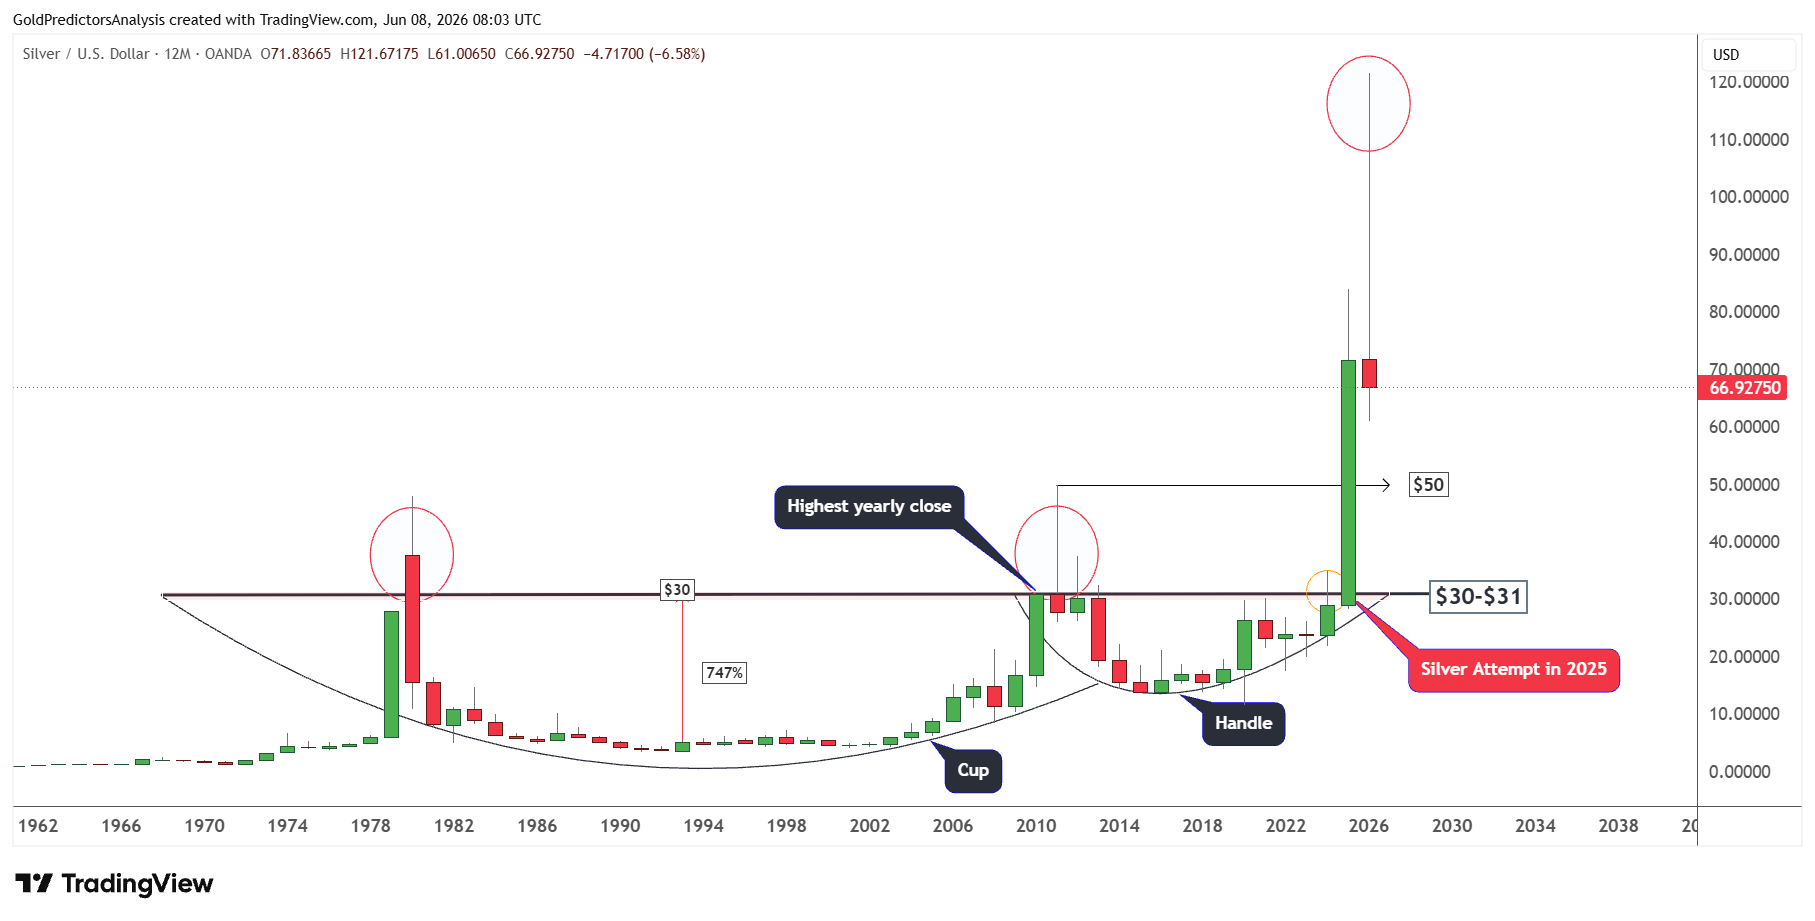
But it is important to note that the yearly close is required to further understand the long-term dynamics. If silver forms a bottom at $50 and rallies back above $100, it will even become a more constructive pattern for 2027.
Therefore, the $50 level remains the key support level in the silver market. A break below $50 will likely push silver towards the $30 to $31 area.
Silver Short-Term Setup Eyes $50–$60 Support
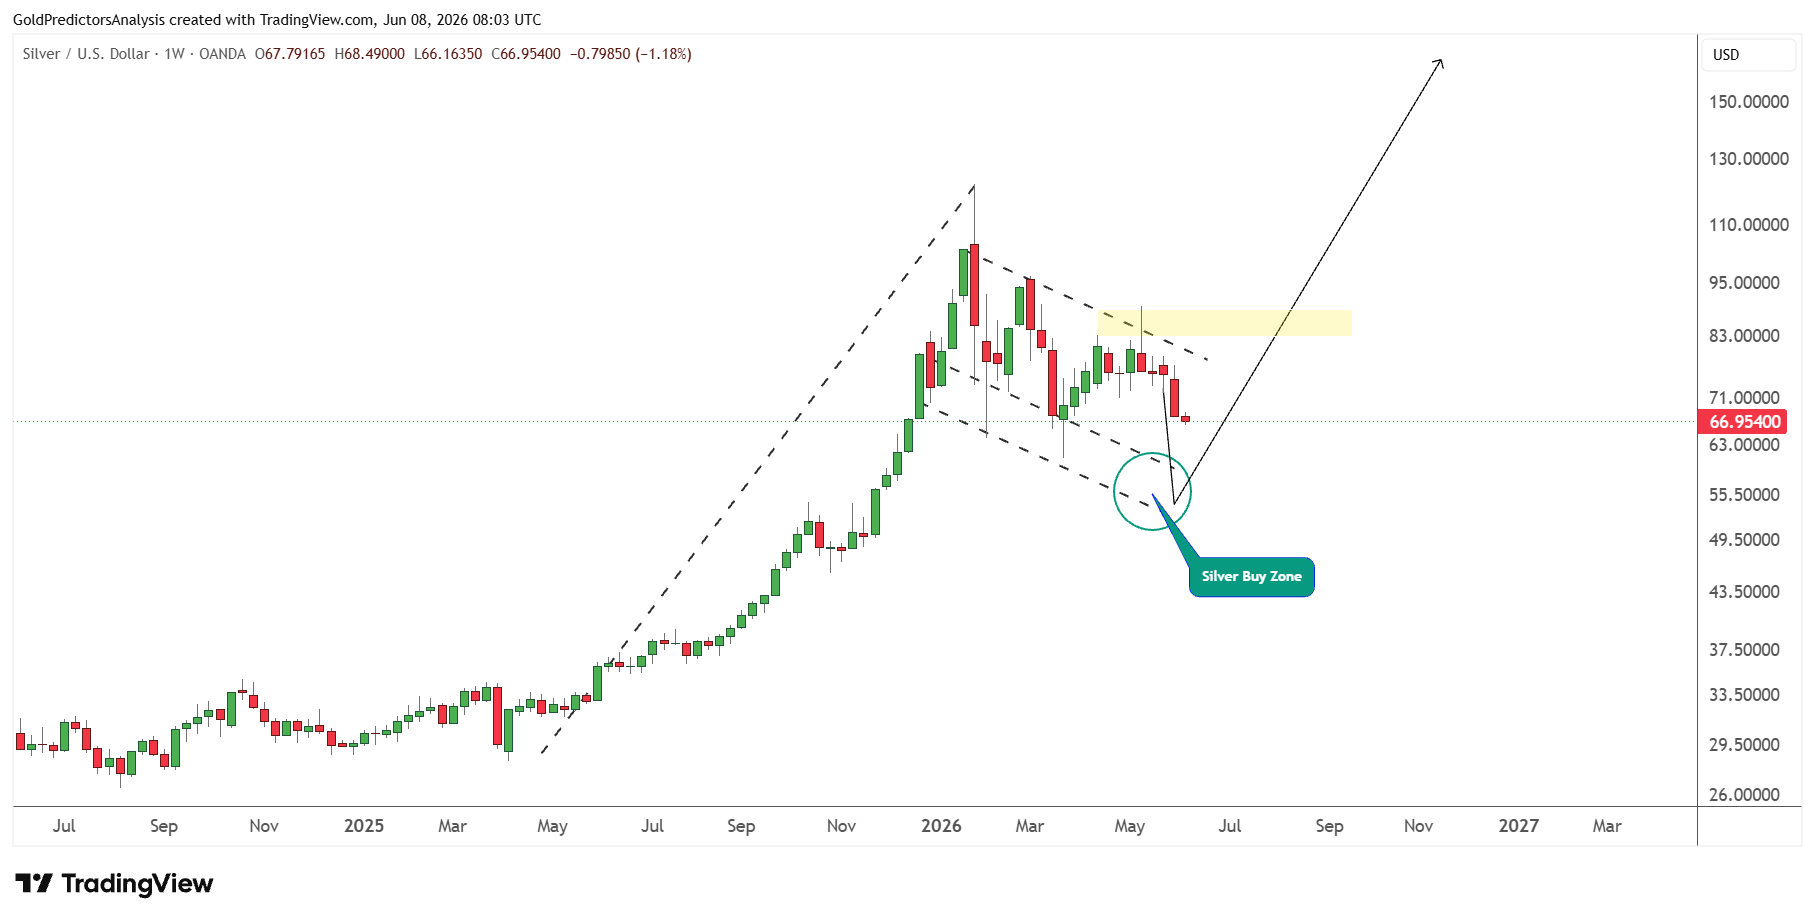
The short term price structure remains in correction mode, as discussed in the previous analysis. The previous analysis observed that the formation of a bearish hammer candle in May 2026 below the $100 region opened the door for a strong drop in silver prices towards the buy zone, which is the $50 to $60 zone.
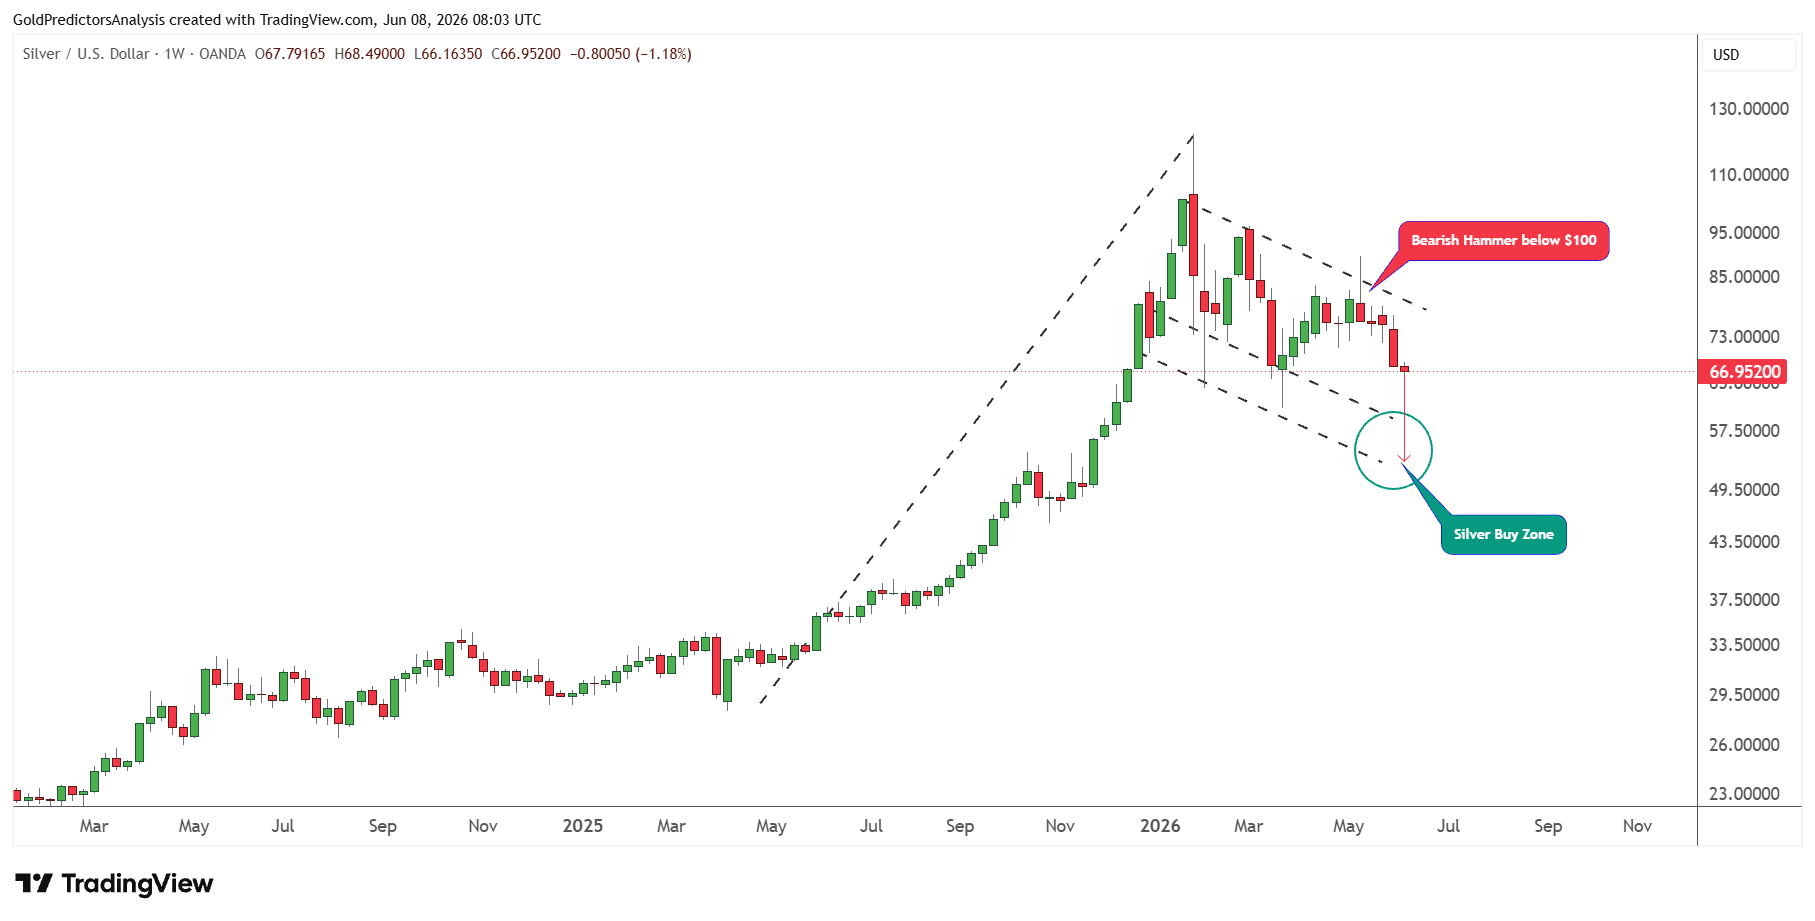
The bull flag pattern further highlights this support zone. This suggests a drop in silver prices in June.
If the silver price holds the $50 to $60 support zone and continues to show strength around this region, it will likely form a bottom to move towards the $100 area in the short term.
A more valid case for silver is that this drop is setting up the next buy signal to move towards $100 in the short term and likely break the record high at $120 to move towards the $250-$300 area.
Silver Price Risks: Fed Policy and $50 Support Remain Key
The main risk with silver is the deeper break below the key support level of $50. If silver is unable to defend this level, the correction could push up towards the $30-$31 area. This would pull down the short-term bullish scenario and push back the next bull market rally.
Moreover, the yearly close below $30 would be more serious as it would invalidate the long-term breakout structure. The macro risks for silver in the near term remain the higher U.S. Treasury yields, a stronger U.S. dollar and renewed worries about Fed rate-hikes.
Another risk is that the industrial demand might not be sufficient to beat the monetary pressure. ISM manufacturing activity improves, but inflation risks remain tied to escalating Middle East tensions. The Fed could maintain a tight policy for a longer duration if inflation remains high.
That would continue to put downward pressure on precious metals despite silver’s supply deficits and the supportive renewable energy demand. Thus, silver needs to hold the $50-$60 support level to establish a bottom rather than another major breakdown.
What Is Next for Silver?
Silver shows bearish pressure in the short term but the constructive setup in the long term. The price is moving to $50-$60 after the breakout from $70. A rebound from $50-$60 and rally towards $100 would construct a strong bottom pattern, which may push silver prices to $120 and then $250-$300. But a break below $50 will open the door for a deeper drop to $30-$31. As long as $30 holds in silver, the long-term price structure remains constructive.
Read more: Gold and Silver Breakdown Signals More Pain Ahead