


Silver (XAG) prices face short-term pressure due to the strength in the US dollar and Treasury yields. But the long-term picture remains strongly bullish. In my view, any price correction to the $50-$60 range will signal the next big bottom before the price heads to break record levels. This article discusses the macro drivers, long-term price structure, key support areas and correlation of silver with gold, stocks and bitcoin to understand the next move in the silver market.
Macro Drivers: Supply Deficit and Industrial Demand Support Silver
U.S. Dollar and Treasury Yields Create Short-Term Pressure
The macro picture for silver remains strongly bullish, but short-term market attention has shifted to the U.S. dollar and Treasury yields. Precious metals continue to see pressure in May due to price increases and inflation concerns.
Higher inflation is causing the Silver (XAG) to hold interest rates higher for longer. This is important for silver, as higher rates push the U.S. dollar higher and keep silver prices under pressure. But this only produces short-term fluctuations in the silver market and does not change the long-term bullish outlook.
Supply Deficit and Industrial Demand Keep Silver Bullish
The major long-term catalyst for silver is coming from supply. The global silver market is forecast to continue to be in deficit in 2026. This deficit can increase to 46.3 million ounces from 40.3 million ounces in 2025. This is important for silver, as inventories have already dropped during the last several years. When inventories drop, even a slight uptick in demand can shift silver prices quickly. Therefore, if silver sees strong demand, prices may surge higher again.
Another catalyst for the silver price is industrial demand. Silver is very important for solar applications. But the high price of silver has spurred manufacturers to conserve the precious metal per panel. The PV industry makes up around 17% of all silver demand. This indicates that silver remains strongly tied to renewable energy, which is a strong industrial application at the moment. On the other hand, electrification, electronics, grid upgrades, energy storage and AI infrastructure keep silver engaged in the broader energy and tech cycle.
Silver Price Forecast
Every new Silver analysis as it publishes, today's technical signal and key levels, live price — on one page.
See all Silver forecastsChina is another key structural catalyst for silver prices. Beijing has already approved 44 companies for the export of silver in 2026 and 2027. This indicates that silver exports are following a more controlled path. It also indicates that there is a decrease in the flexibility of physical flows when local demand increases. This can raise premiums and price variability in a tight market.
Despite this strong demand, the silver price still depends on U.S. dollar and U.S. Treasury yields. Any correction in the U.S. dollar and Treasury yields will likely mark the next bottom in prices.
Silver Price Breakout Points Toward $300
The silver price action is very constructive and points to higher levels during the next few years. This constructive price action is evident using the cup and handle formation on the yearly chart. It is observed that the silver price has been below the $30 area since the 1980s. The price spiked to $50 each time but failed to break above the $30 area and settled back lower.
The strong surge in 1980 and 2011 failed to push the silver price above this level. This failure produced a cup and handle formation below this level. But the price successfully broke the $30 level by closing at $71.64 in 2025. This breakout has opened the door to continued upside momentum in the next few years in the silver market.
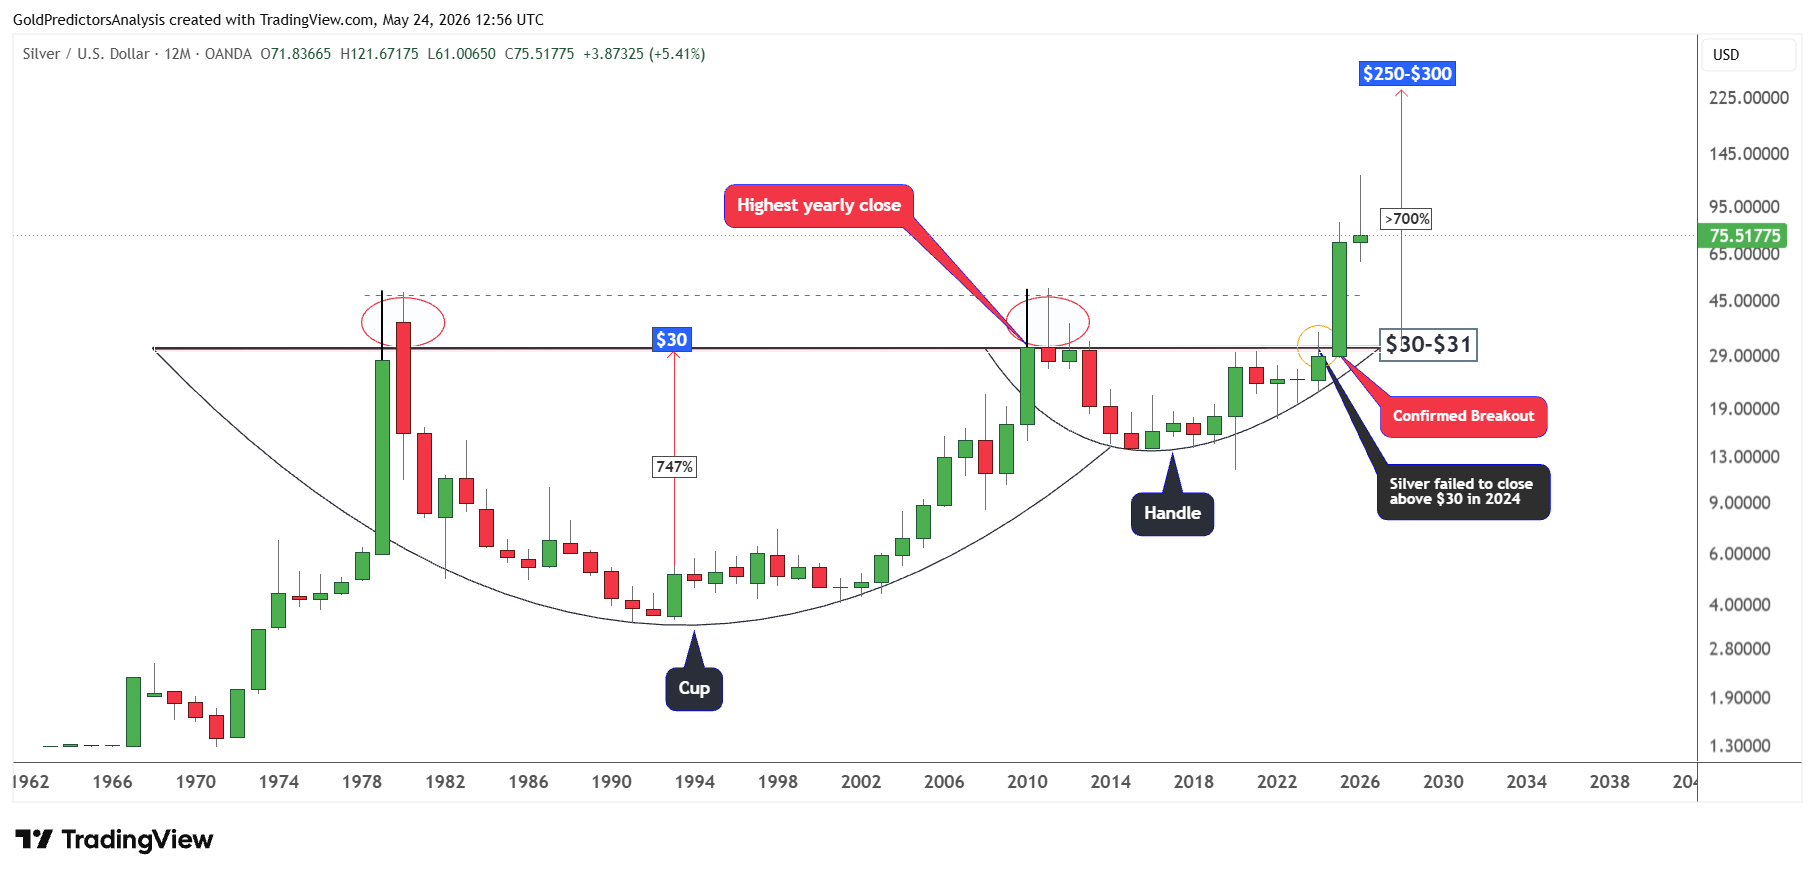
The chart shows that the price surged by 747% from 1993 to 2011. If 700% is measured from the breakout of the $30 area then the price targets the $250 to $300 region. But the ongoing demand for renewable energy and AI infrastructure development suggests that silver prices may remain volatile. This volatility suggests that prices may face strong fluctuations before moving higher toward $300.
Silver Pullback May Come Before the Next Surge
Since the long-term price structure for silver suggests a strong bull move, prices cannot rise in a straight line. A correction in metals is a healthy sign. If prices continue to rise in a straight line, it will likely signal a top formation.
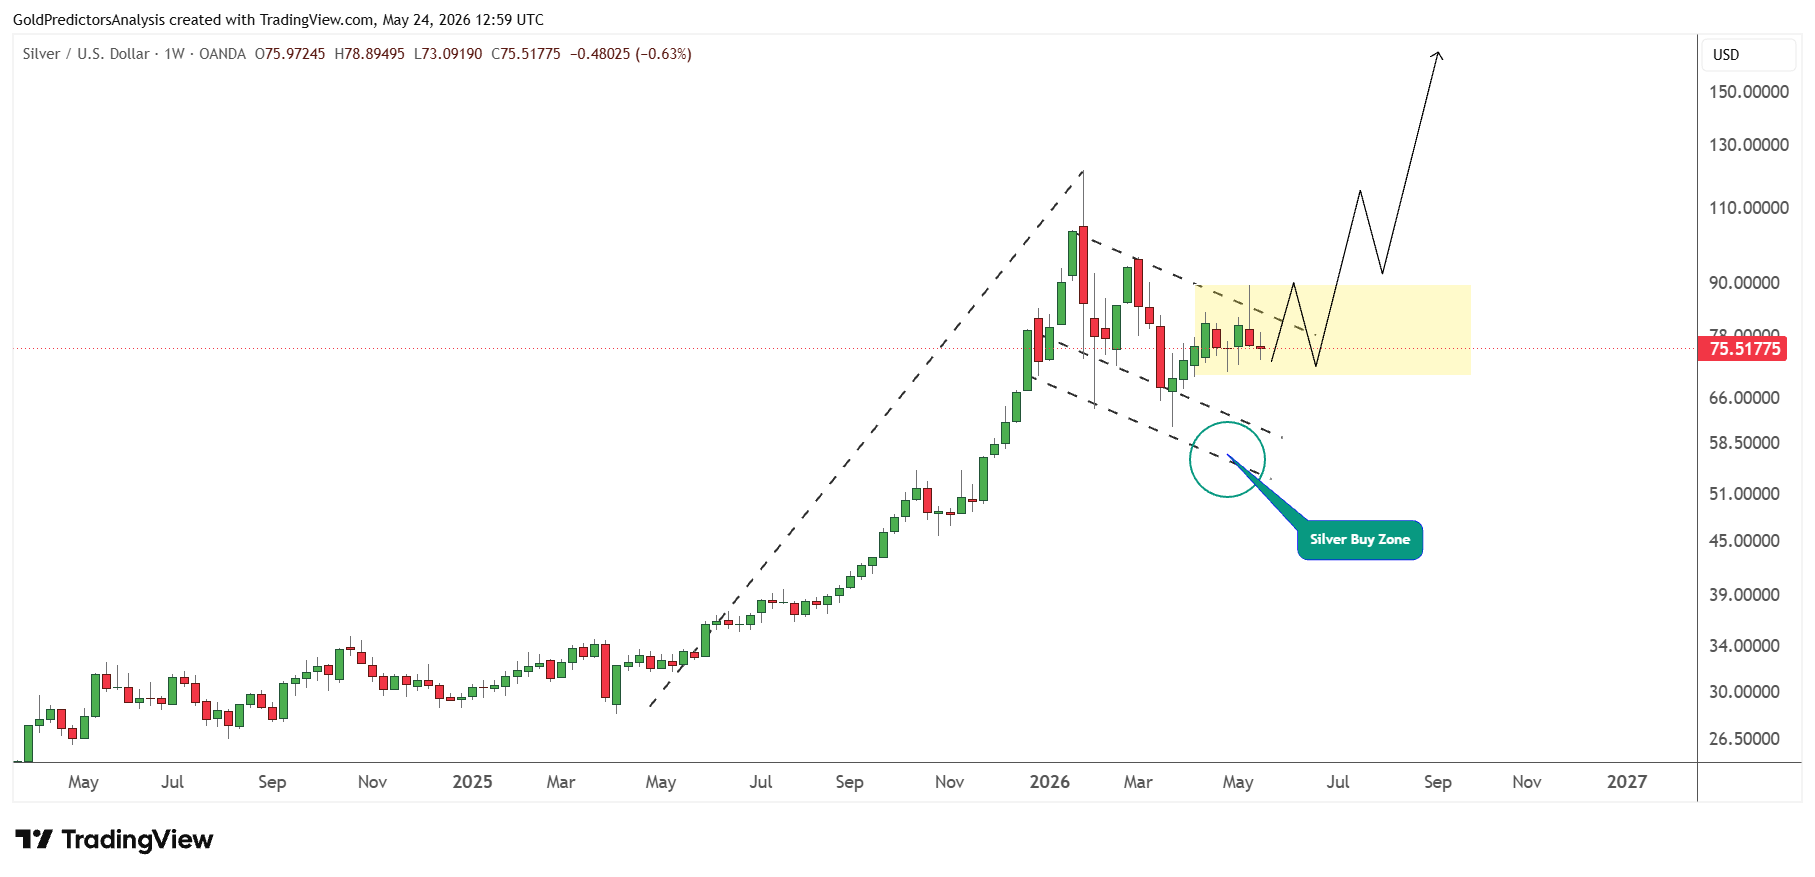
The peak in silver prices in January 2026 at the $120 area marked a short-term top and resulted in a short-term consolidation. These consolidation patterns have formed a bull flag that is stretched from the lows of 2025 to the highs of January 2026. This bull flag pattern suggests that prices may continue to consolidate and even trend lower toward the buy area of the blue flag pattern. This correction will likely initiate the next surge.
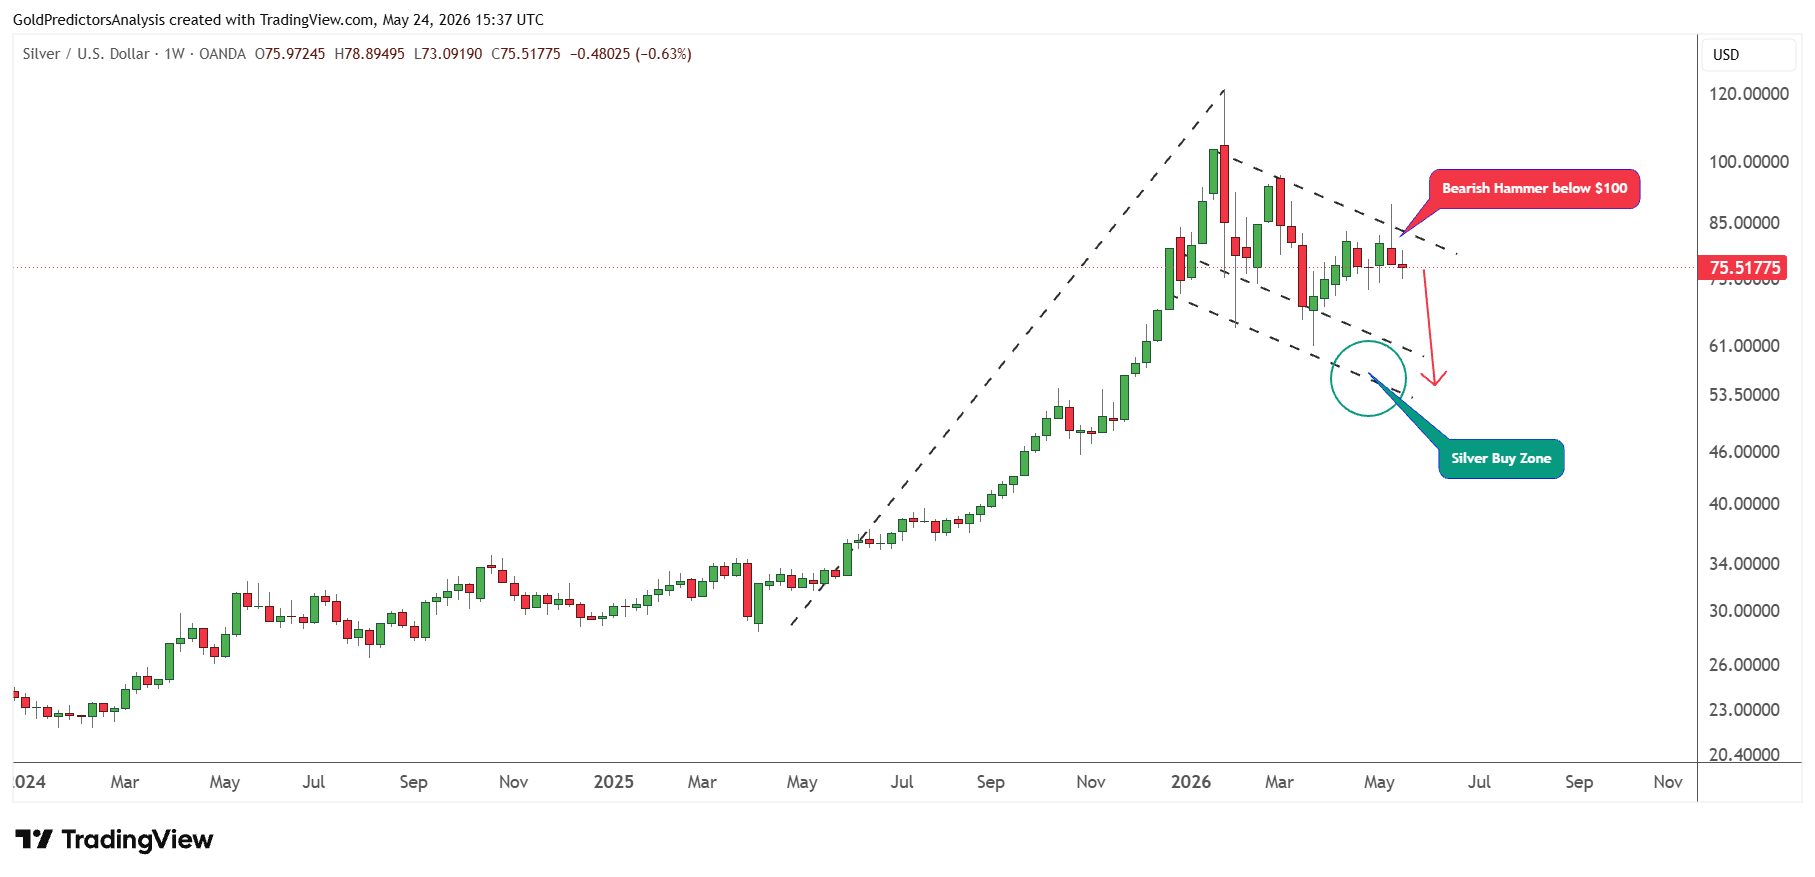
The formation of a bearish hammer candle last week indicates that silver prices are exerting pressure in the short term to push down. If silver prices continue to drop and break below the $60 area, then they will likely enter the buy zone, which lies between $50 and $60. Once prices drop back toward this zone, they will likely generate a strong buy signal, which will take prices to much higher levels.
The Key Levels in Silver Decide the Next Move
The main question is whether silver prices will drop back toward the $50 to $60 zone first or break higher above the $90 region to initiate the next leg higher.
From the chart perspective, it is observed that the silver price formed a bearish hammer exactly at the yellow region, which lies between $80 and $90. Therefore, the bearish hammer candle indicates that prices have the potential to drop further. However, prices failed to break below $70 to $72 last week, which increases the possibility of further consolidation or failure to break lower.
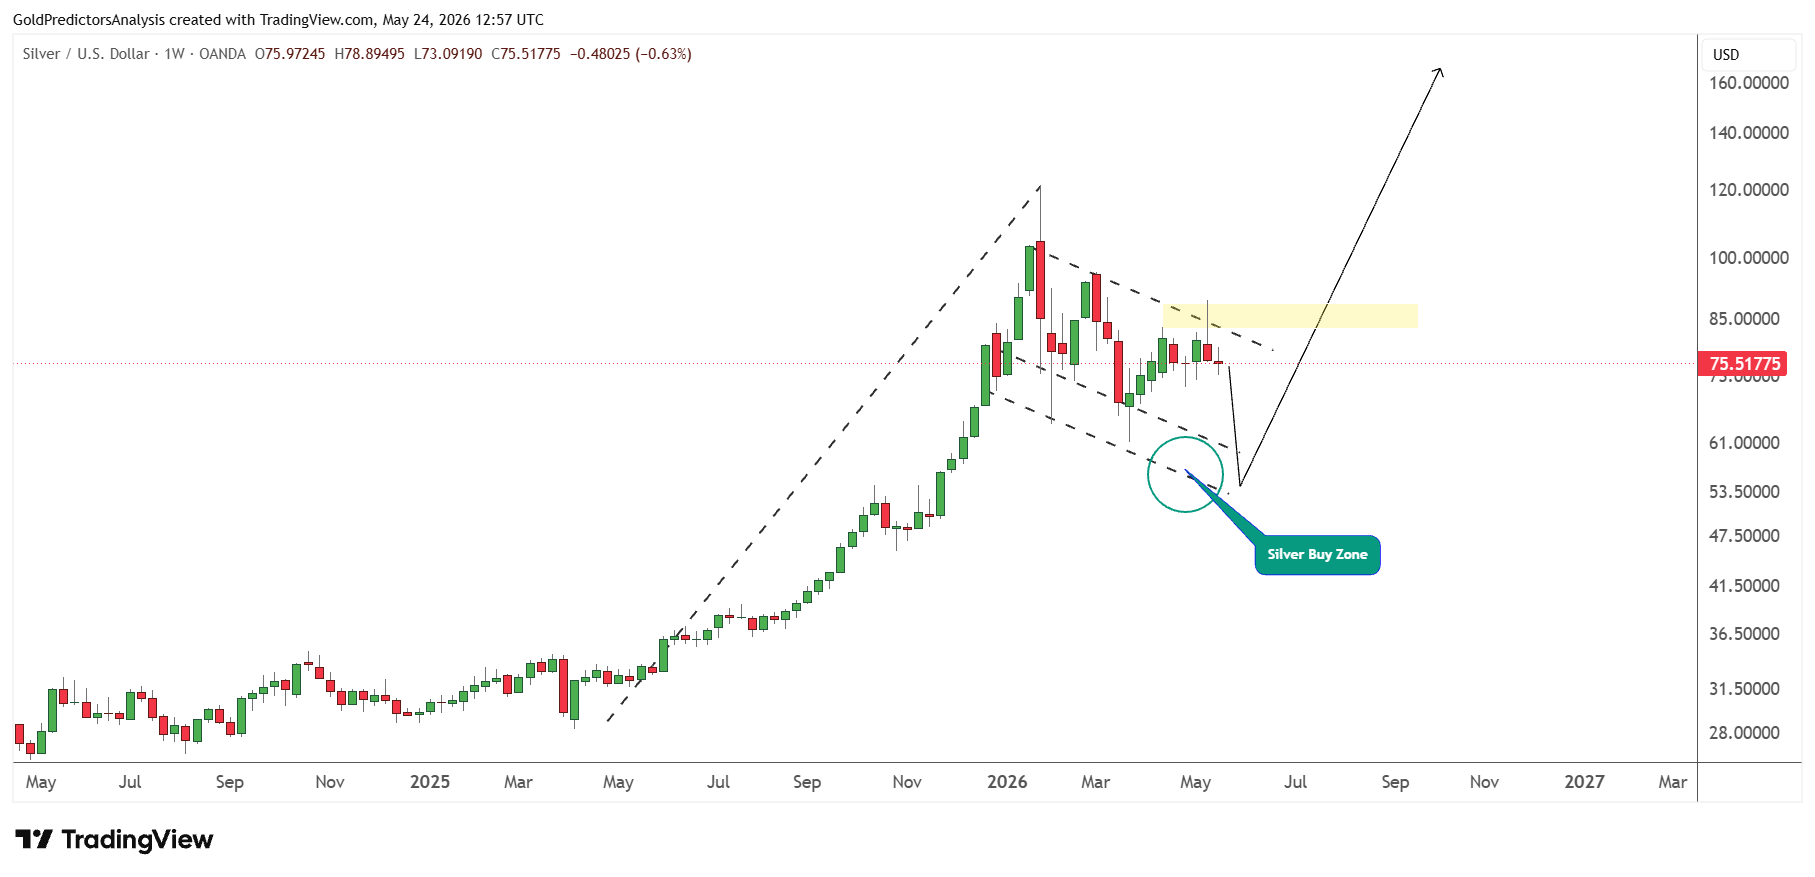
If prices continue to drop lower, then they will likely form a strong bottom at the $50 to $60 region and continue to trend toward the $150 area as the next surge in silver prices.
This drop will likely be triggered by strong inflationary pressure, which is pushing U.S. Treasury yields and the U.S. Dollar Index higher. But these inflationary pressures will likely support industrial metals during the next cycle.
Since demand is very strong and silver remains in a strong long-term bullish cycle, if silver prices fail to break below the $70 region, then silver will likely remain consolidated in the yellow zone and then break above the $90 area. A break of $90 will likely take prices toward $120. A break above $120 will likely initiate the next surge in silver prices.
Related Markets: Ratios Confirm Silver’s Long-Term Strength
Silver-to-Gold Ratio Signals Silver Outperformance
The strong bullish pressure in silver prices is also observed from the silver-to-gold ratio. The ratio has broken from the long-term bottom formation in November 2025 at the 0.0127 area. The formation of the rounding bottom pattern, the V-shaped recovery from the March 2020 lows and then the breakout above the 0.0127 and 0.0154 levels indicate that the long-term trend for the silver-to-gold ratio has shifted to the upside.
This upside shift in the ratio indicates that silver prices will likely outperform gold (XAU) in the next cycle. However, the formation of wicks at 0.02302 in January 2026 and 0.01886 in May 2026 indicates that there is short-term pressure in the ratio. This pressure may take the ratio back toward the 0.0127 area, which was the breakout region.
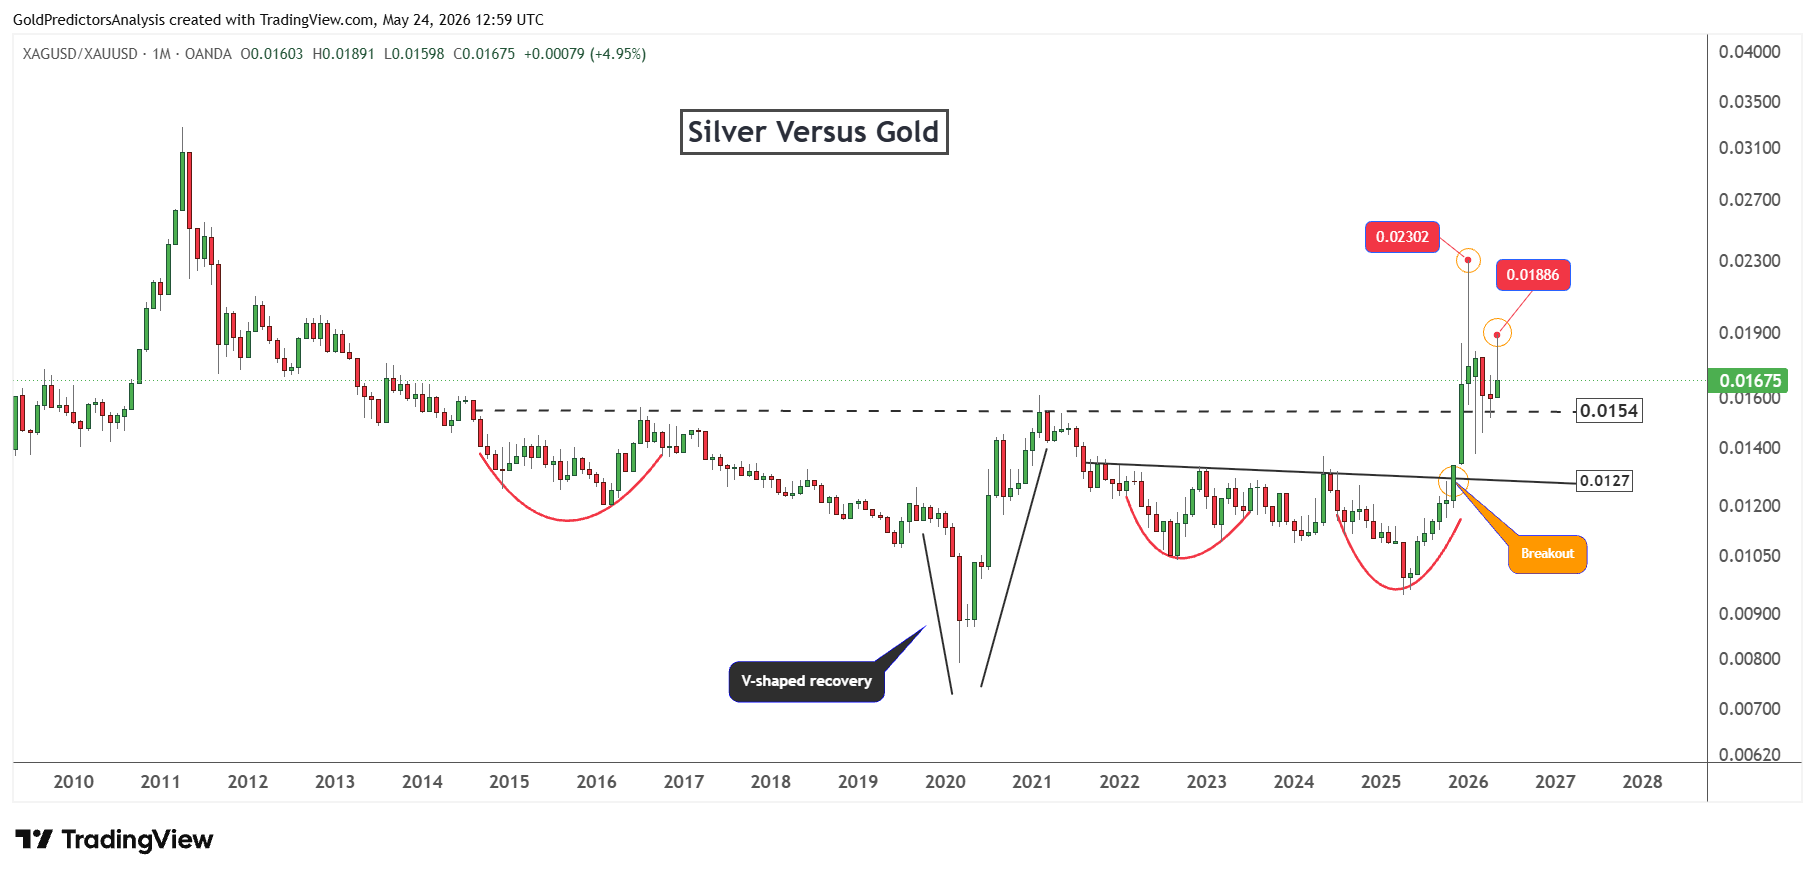
However, the ratio is still holding 0.0154 at the black dotted trend line. This indicates that despite the consolidation, there is bullish pressure in the ratio. As long as the ratio closes above 0.0154, the short-term direction for silver will likely remain higher. But any correction back toward 0.0127 will likely push silver prices lower toward the buy zone area of $50 to $60.
Silver-to-S&P 500 Ratio Supports the Bullish Setup
The same price pattern is also observed in the silver to S&P 500 ratio. The chart shows that the ratio forms a rounding bottom pattern and breaks the 0.08 level in a manner similar to 2006. This breakout is very important and it pushed the ratio back toward the 0.015 level. The level of 0.015 was strong resistance. However, the ratio is now consolidating between the 0.0095 and 0.015 levels before the next move higher.
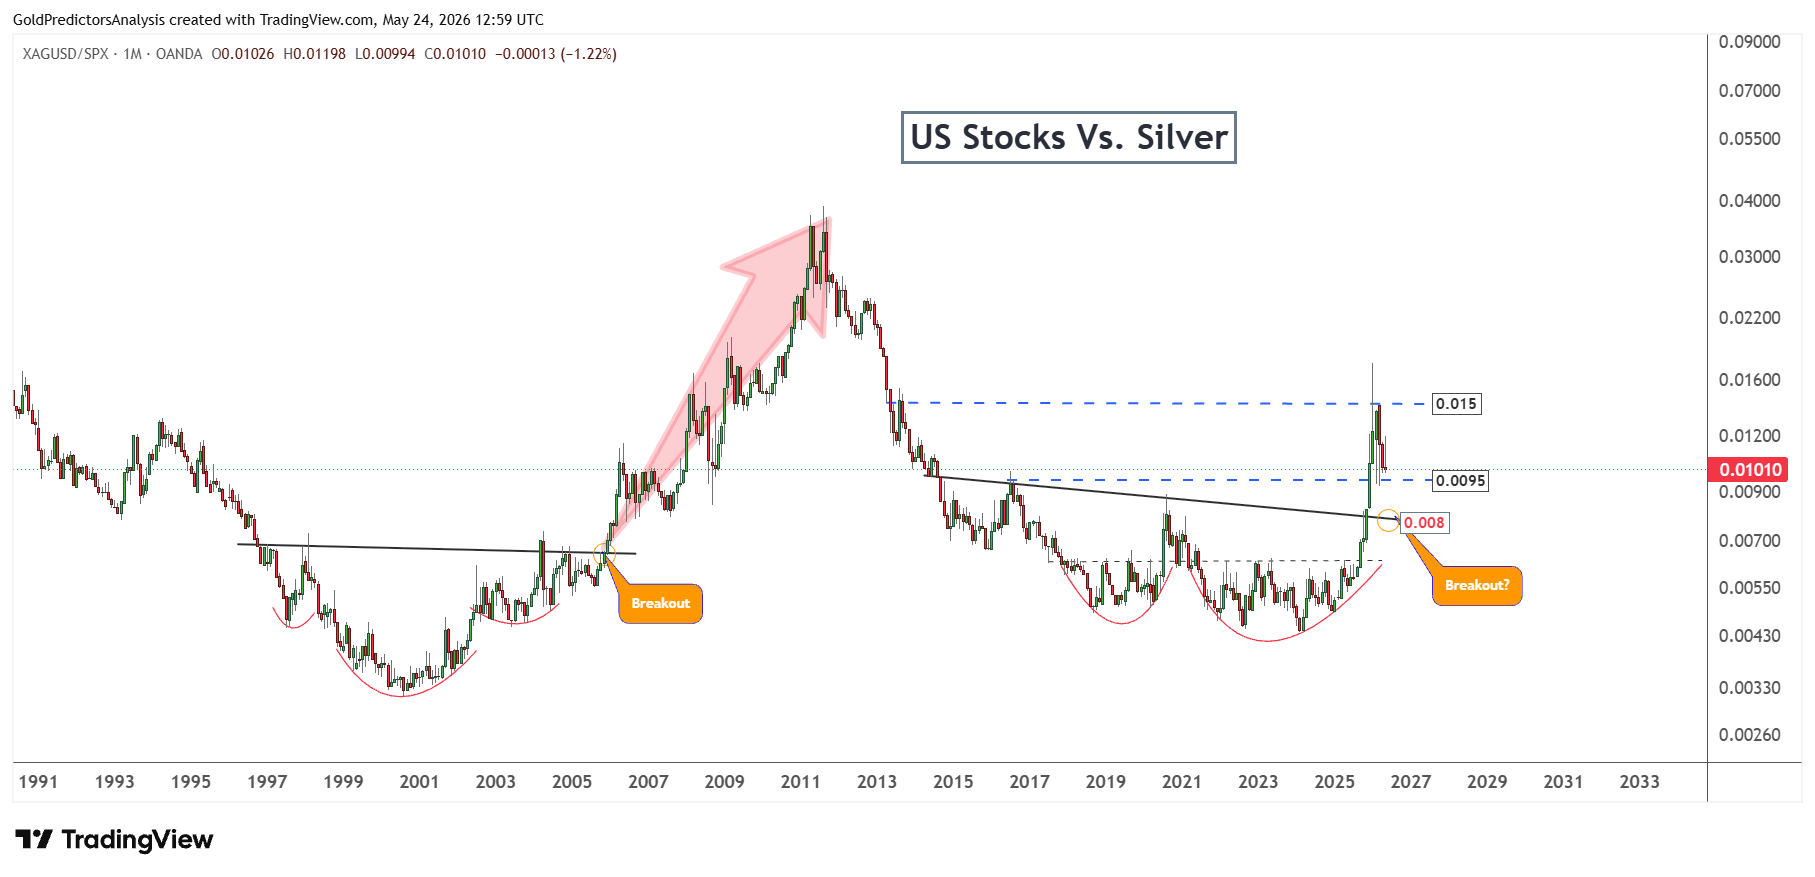
Any correction back toward 0.08 will likely offer a strong buying opportunity in silver prices. The correction in this ratio suggests a silver correction in the short term, which will likely lead to a buy signal at a later stage.
Silver-to-Bitcoin Ratio Points to Renewed Silver Strength
It is interesting to observe that silver has also broken against Bitcoin (BTC), as seen in the silver-to-Bitcoin ratio below. The breakout from the triangle pattern and then the breakout from 0.00054 indicate that the long-term trend has shifted to the upside.
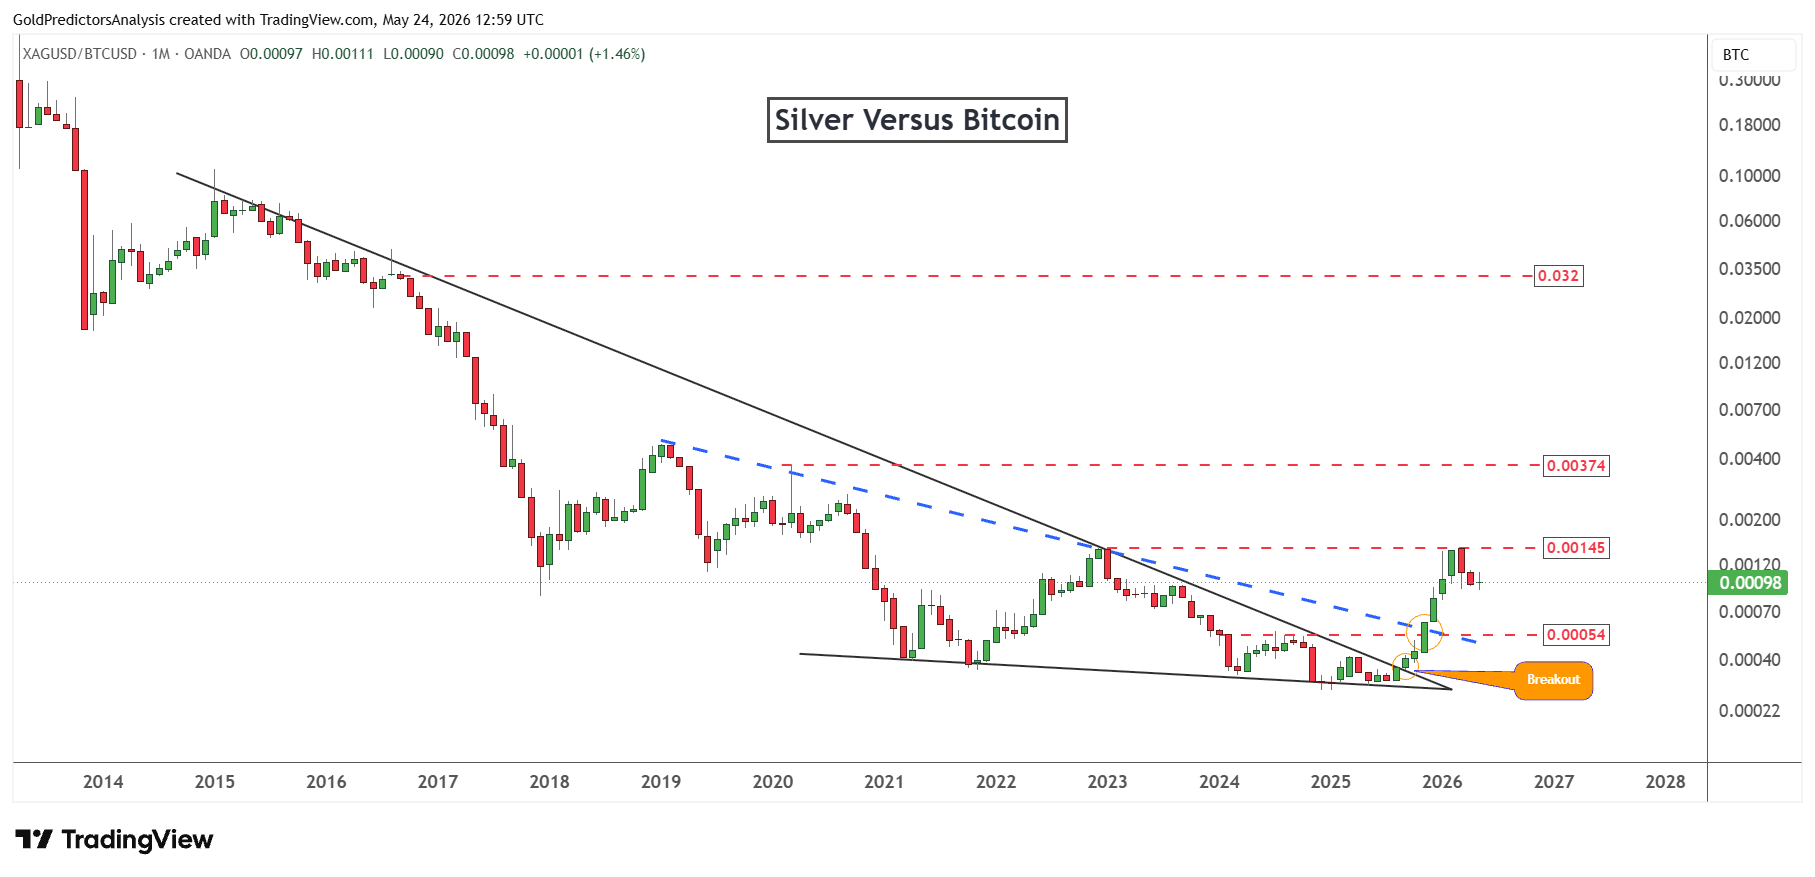
However, the ratio has hit resistance at 0.00145, which is the level where the silver price reached the $120 area. The correction from this resistance in the ratio indicates that silver is also correcting. Once this correction is over, the ratio will likely escalate toward 0.00375. This escalation in the ratio will indicate further upside in silver prices and the likelihood of a breakout above the $120 area.
Final Words
The market is expected to remain bullish for Silver over the long term due to ongoing supply shortages, industrial demand and the expansion of renewable energy and the AI infrastructure. The long term picture for silver still suggests more price surges in the next few years as the price broke the long-term $30 level. Silver might not necessarily move in a straight line. The recent strength in US Treasury yields and the US dollar will likely push silver prices lower in the short term before the next major rally.
The key buy zone is $50-$60. A correction to the area could provide the next powerful buying opportunity. A move above $90 will help to turn momentum toward the $120 area on the upside. If the price breaks above $120, this will confirm the next big move and help validate the long-term trend to the $250-$300 level. A break below $50 will signal further downside to $30, which is the key pivotal level in spot silver.
Read more: Rising Oil Prices and Inflation Risks Could Push Silver Toward $300