



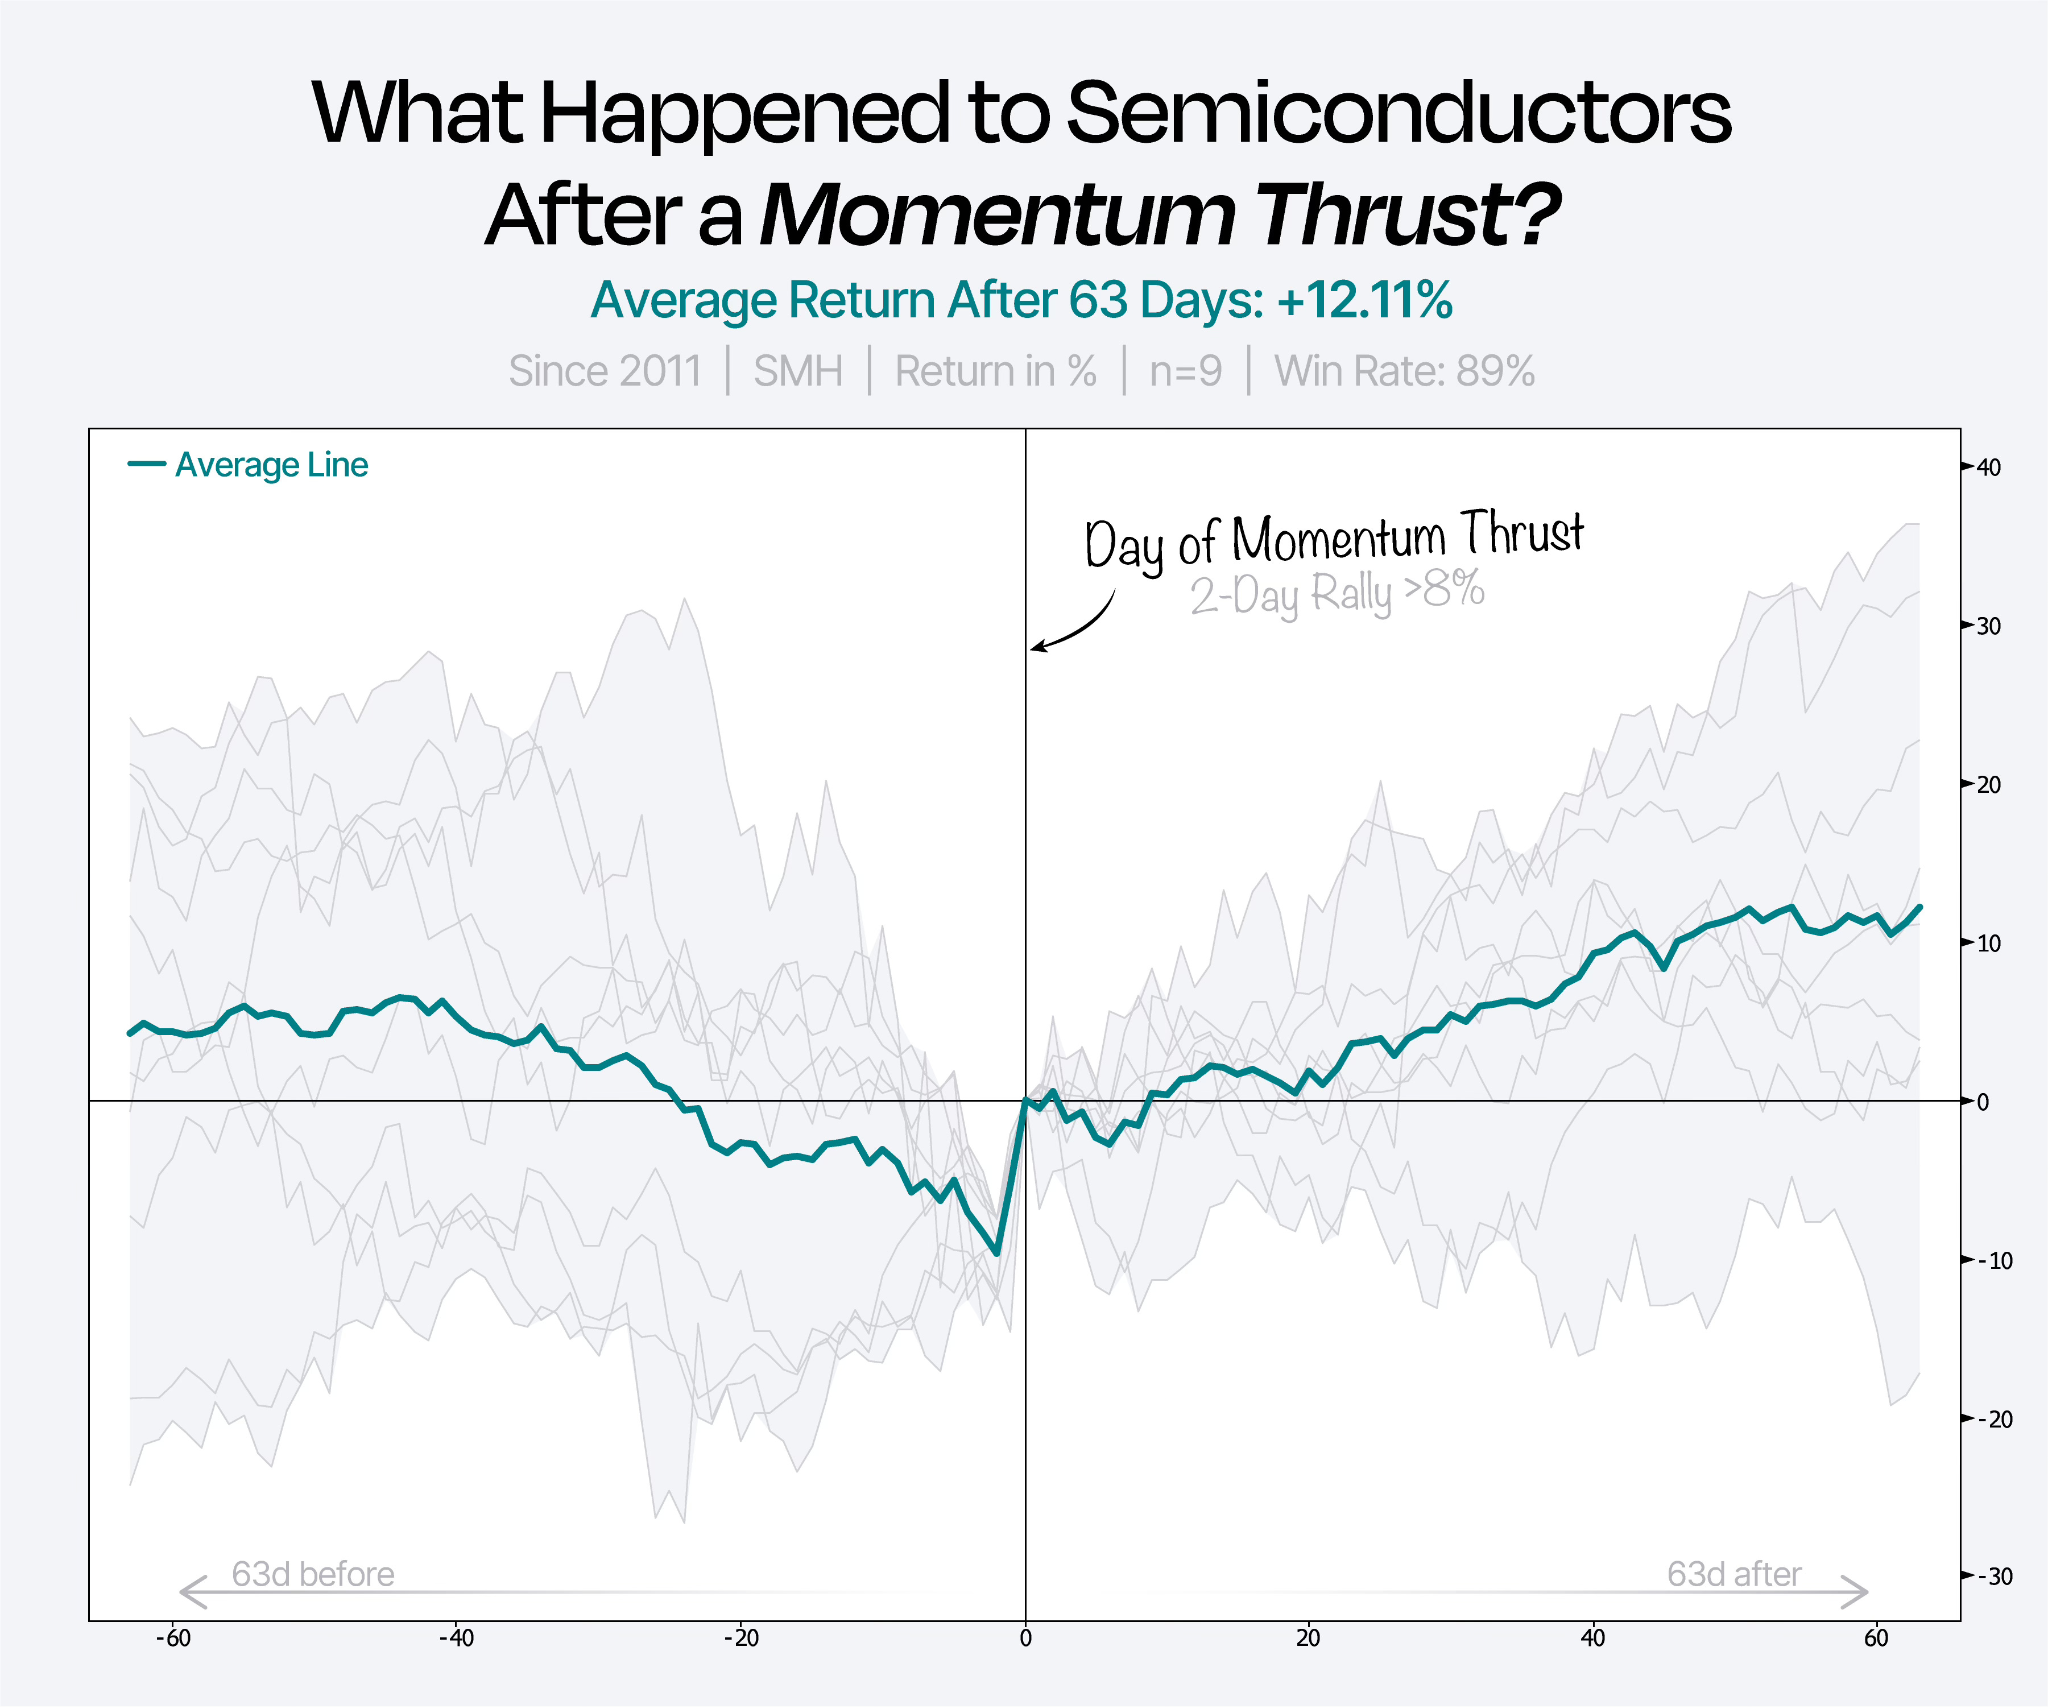
Semiconductors have had a complicated 2026. The continuing AI capex supercycle juiced demand across the supply chain, but rate uncertainty, inventory digestion, and export control whiplash kept a lid on the broader sector before war brought everything down. Now, things are starting to change in the chart, and we just got a new bullish signal. The Philadelphia Semiconductor Index just registered a momentum thrust, which historically marks the early innings of a sustained move up. This signal is rare, but when it hits, it has an 89% win rate.
Hardware Has Been Outperforming YTD
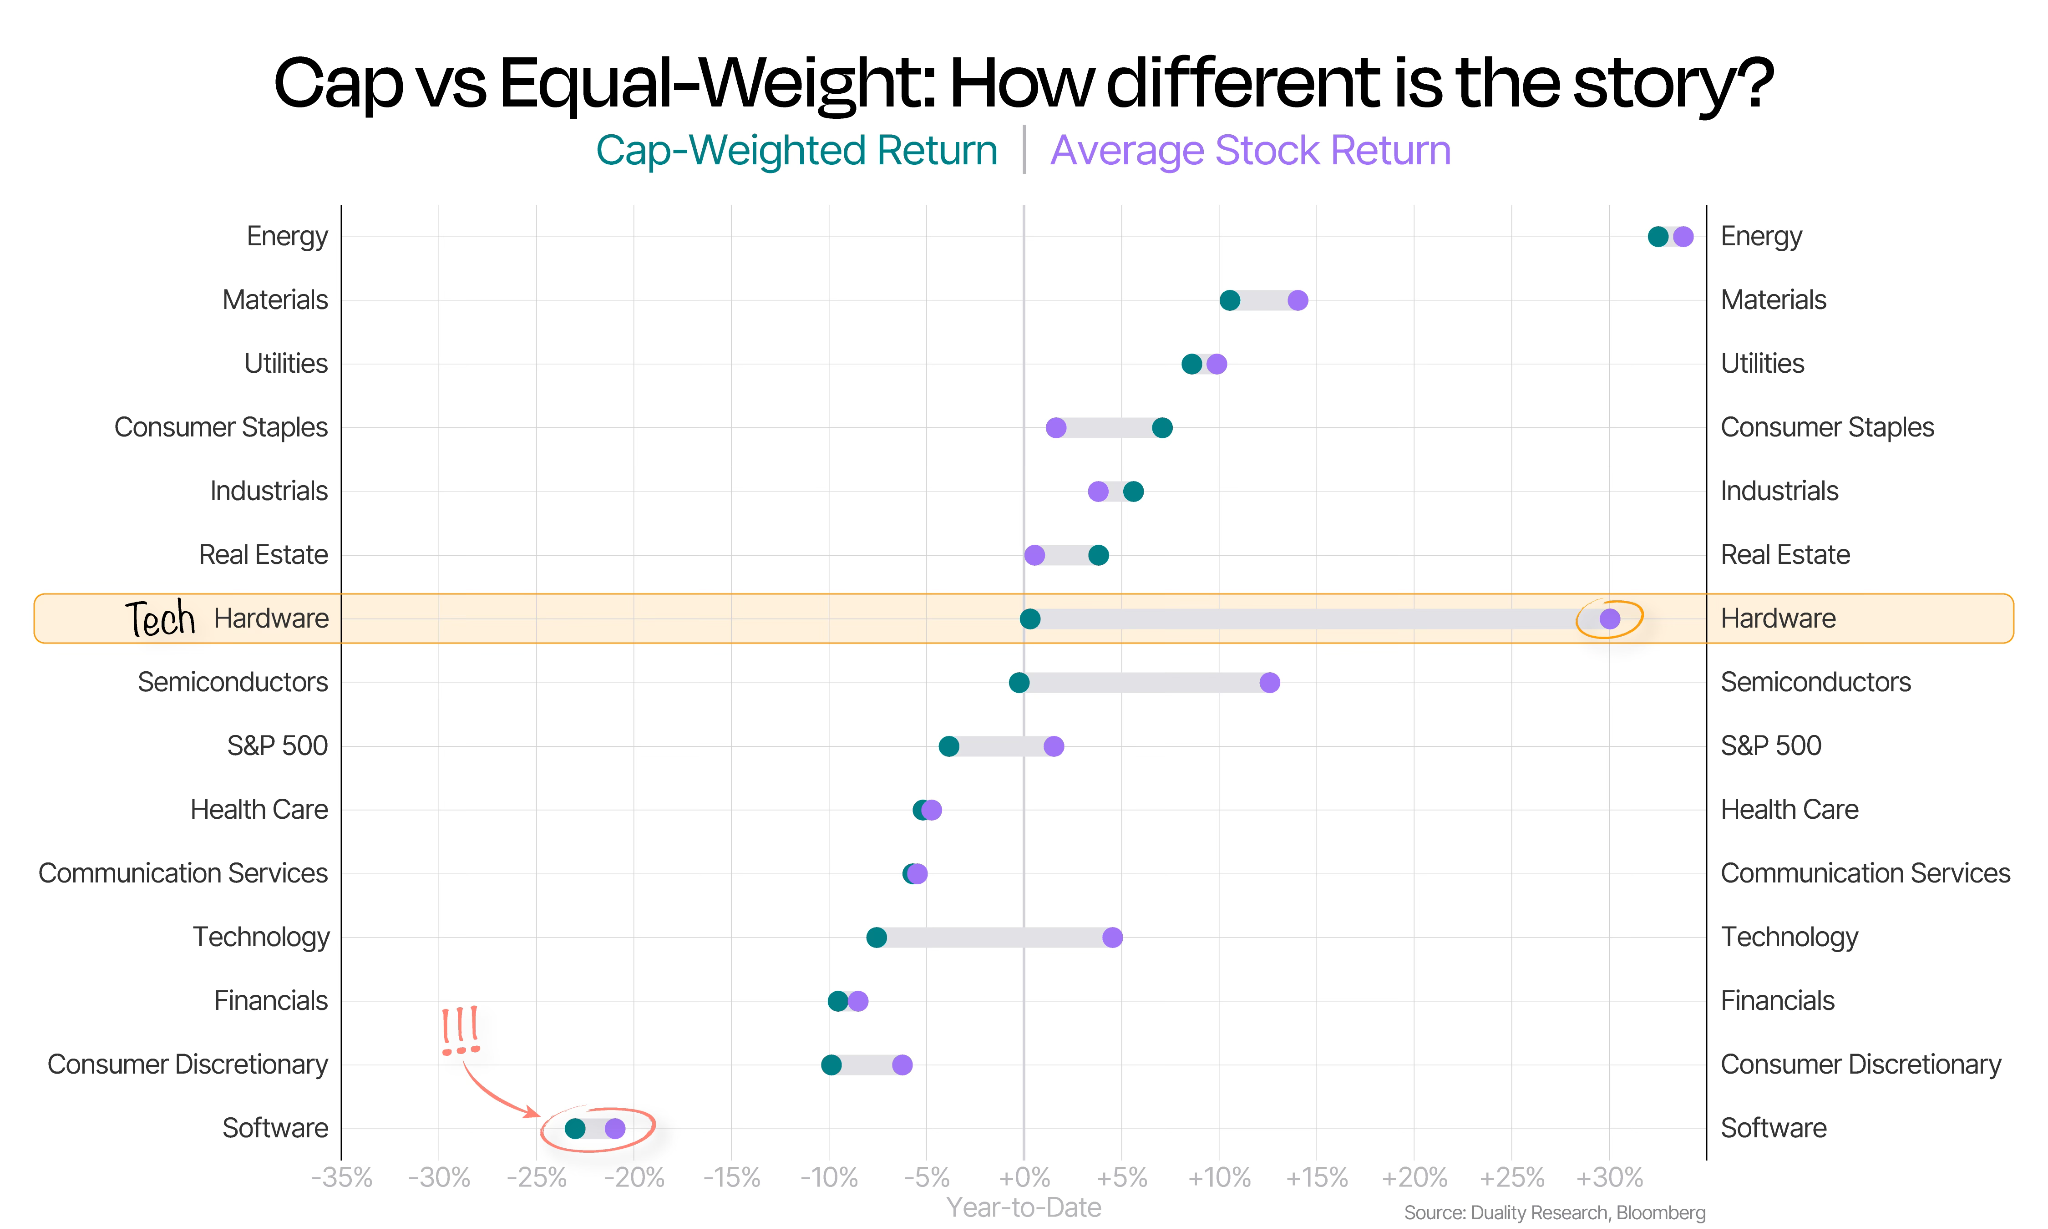
There has been a divergence between both large and small tech stocks, as well as hardware and software firms, in 2026. We can see this clearly in the YTD returns of various sectors in their cap-weighted and average stock returns. Hardware’s average stock returns are at ~30% YTD, while its cap-weighted return is at ~0%, because it’s mostly tied to Nvidia’s (NVDA) performance. The same goes for semiconductors, which aren’t outperforming as much as the broader hardware sector, but are also experiencing the same phenomenon.
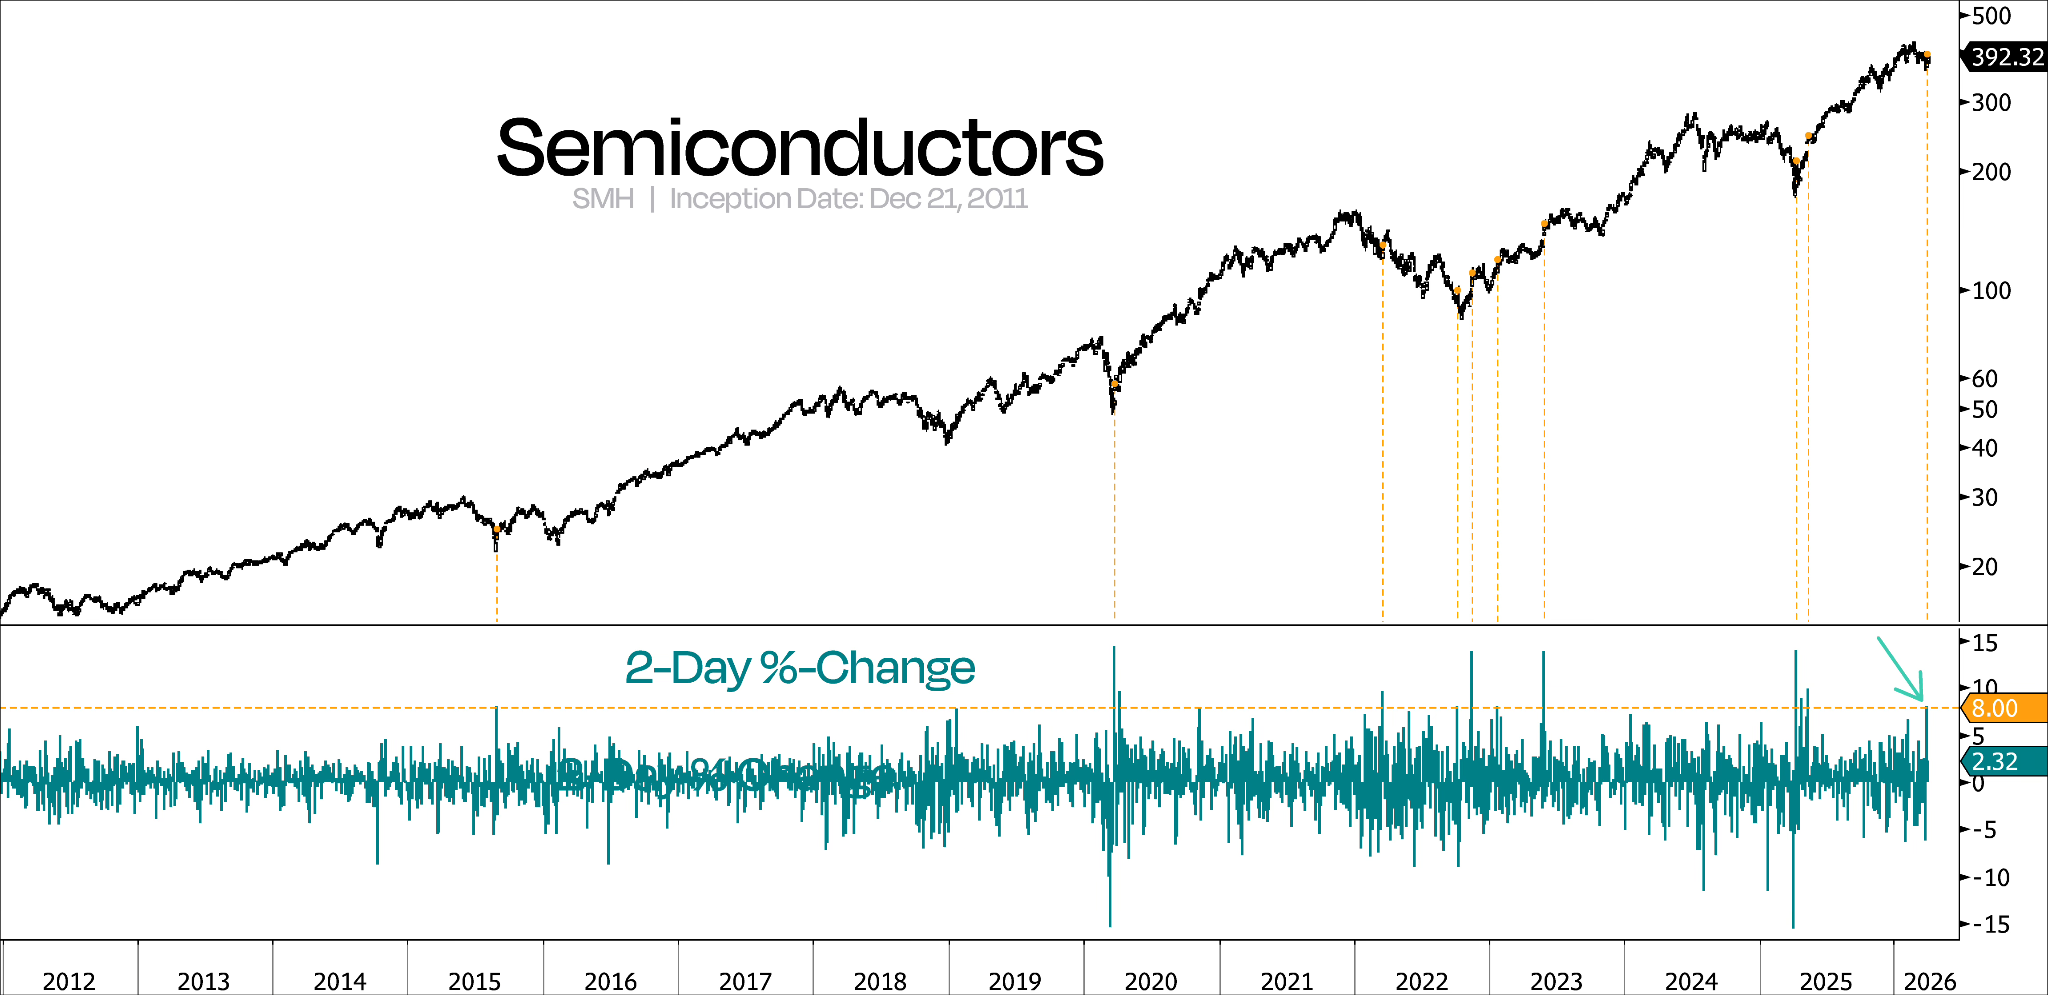
When this recent rally hit over the last few days, I saw something interesting, a signal we haven’t seen since April 2025 and 2023 before that: a momentum thrust. Watching the 2-day %-change in the VanEck Semiconductor ETF (SMH), which tracks the Philadelphia Semiconductor Index, we can see that moves of this magnitude often lead to further upside.
Three months on after this signal (when it comes by itself and not within three months of another signal), SMH was higher. For some context, this most recent move off the low, the thrust, is in the 100th percentile rank going back to the fund’s launch in 2011.
This signal is very rare and isn’t surefire. Its win rate is very high, however, looking ahead two months. Buying in after this signal rendered an average two-month return of 12% and shows an 89% win rate historically. This is one of those moments where the evidence overwhelmingly prints bullish, although no signal operates in a vacuum.
The tariff-driven selloff that hammered the sector earlier this year created exactly the kind of forced-seller dislocation that precedes these events. When institutional money gets shaken out of positions indiscriminately because risk managers hit limits, you get the compression that makes a thrust possible. Fundamentally, the AI capex cycle hasn’t paused either. Sovereign AI buildouts, rising compute demand, and the relentless inference rollout are all semiconductor stories at the substrate level. Good news about a ceasefire and re-opening of the Strait of Hormuz was enough of a catalyst to reignite the existing fuel.
SMH Technical Outlook
This brings us to the technical picture, because walking into this as the thrust takes off and we get a gap up means traders should immediately be cautious about their entry points and directionality. While the signal seen has a bullish bias, it’s not foolproof, and traders should be prepared for both outcomes.
After all, this signal was hit just before the gap-up, and now may be a worse time to enter. This could be a gift to the bears depending on volume strength in the coming days.
Here’s the 1-year daily chart for SMH with the VWAP anchored to September 2022:
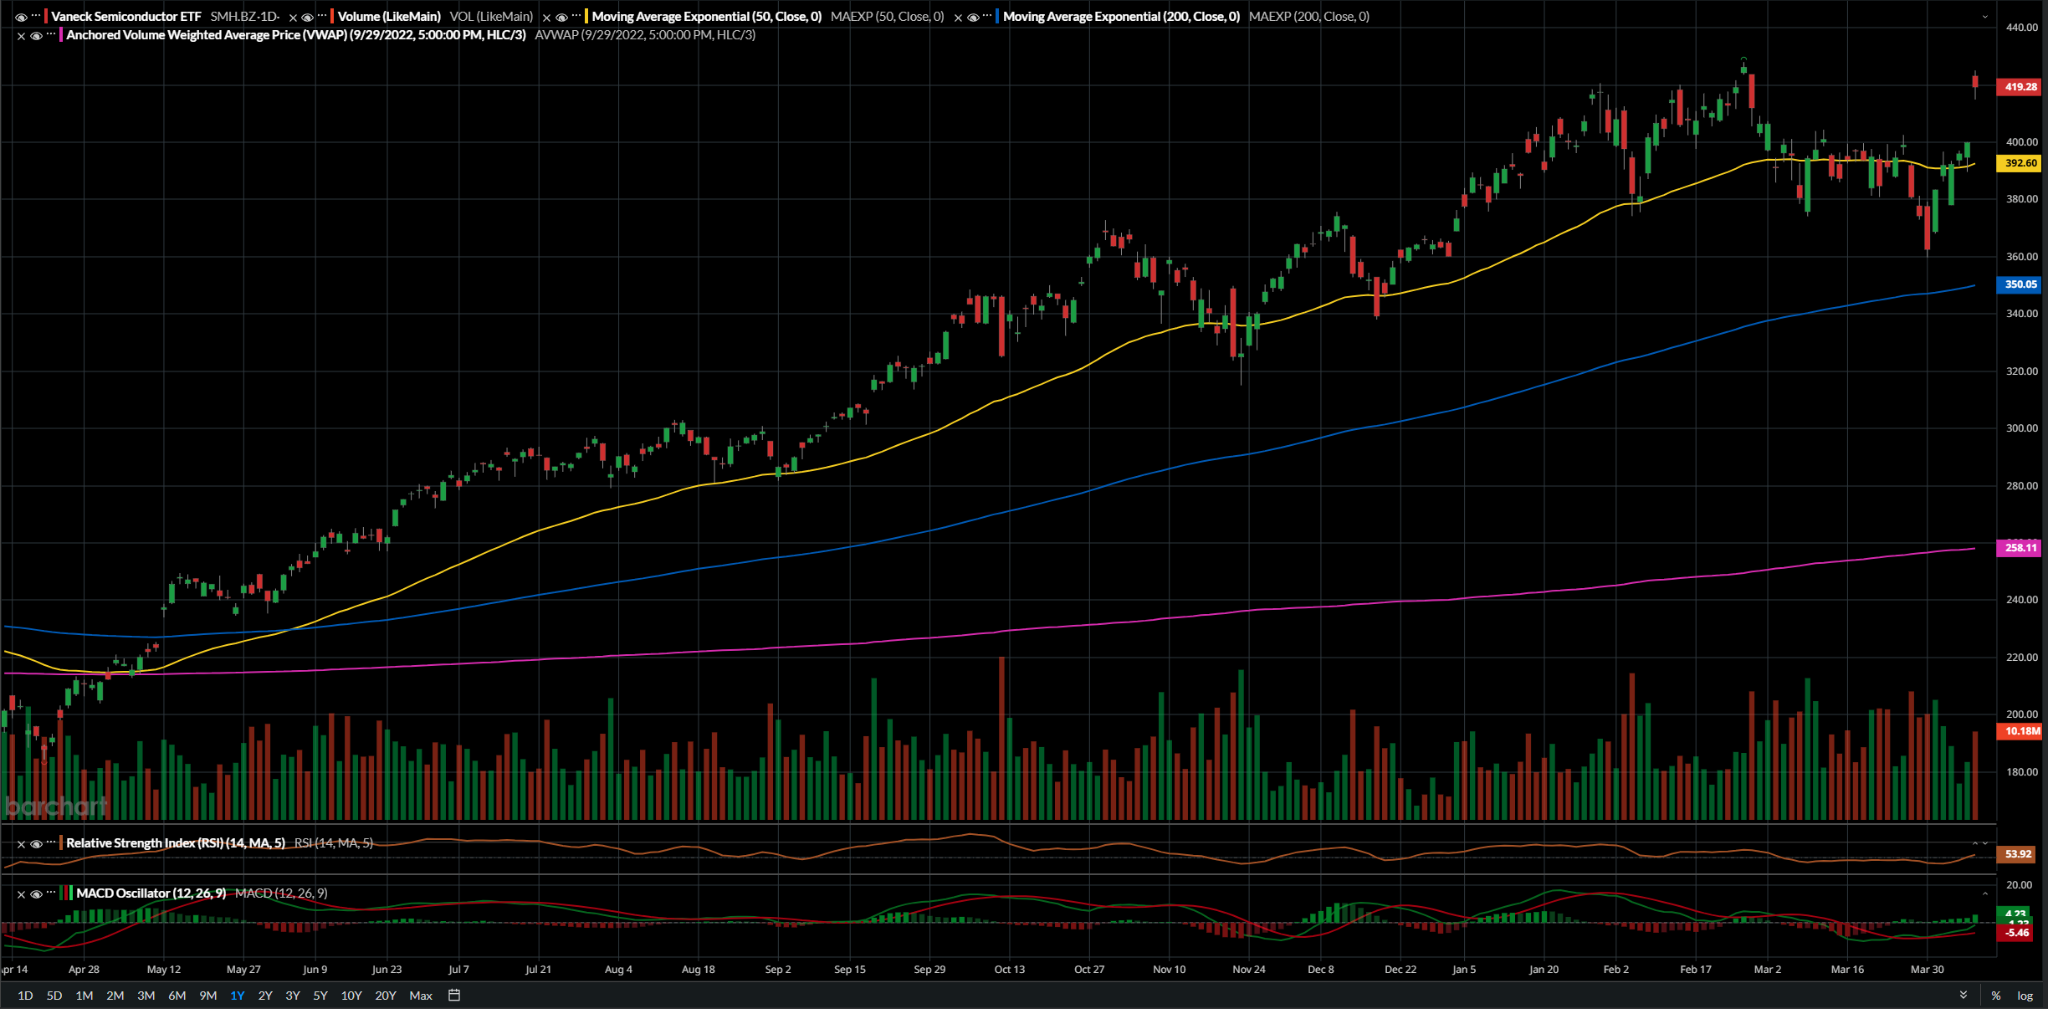
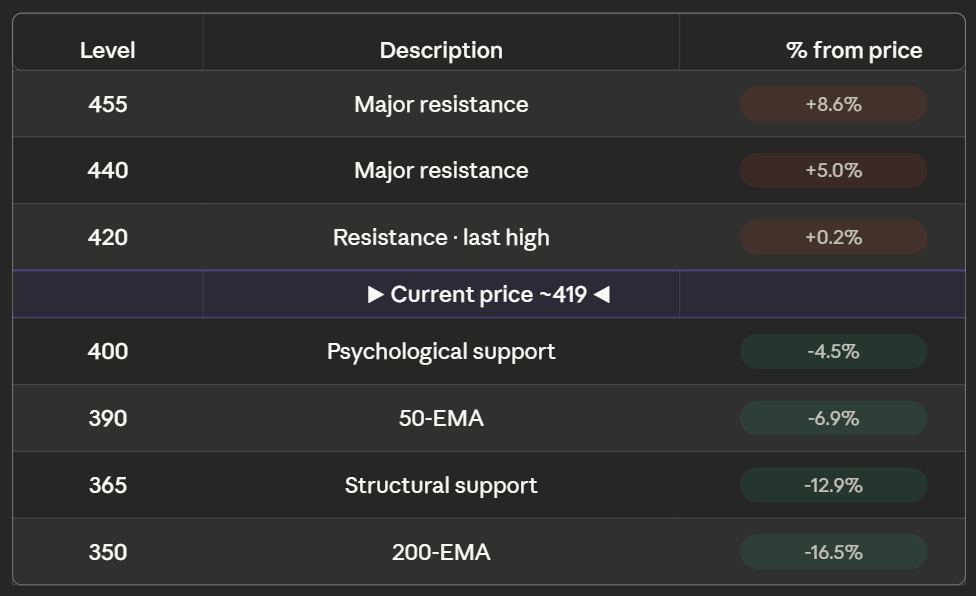
After hitting the momentum thrust and reclaiming the 50-EMA at ~392, SMH exploded upward over 5%, hitting resistance at ~420. Should it meaningfully break ~420, the next resistance level is ~440, but that is uncharted territory.
A rebound on bad news about the ceasefire or a sour day in the market as traders take profit could send SMH lower, especially if it is coupled with low volume. There is no support until the 400 level and the 50-EMA, which has now flipped to support, just below at ~392. If SMH breaks below that level, the bears are back in control, and the next structural support level is at ~365. I would expect bearish traders to take profits around there, as the 200-EMA isn’t far behind at ~350 and will act as institutional-grade support.
Momentum-wise, the MACD is looking strong and continuing to get stronger as SMH pushes up. RSI is similarly strong at ~54 and has now fully lifted from its sell-off lows of ~42. This is still a healthy level and is depressed from its trailing twelve-month average during a bull run.
Here are the major levels to watch for SMH:
Conclusion
The momentum thrust in SMH is one of the rarest and most historically reliable signals that I know of. A 100th-percentile 2-day move, an 89% win rate, and a macro backdrop that’s been supportive but suppressed by fear and forced institutional selling have all converged, which led to a quick gap up on the 9th.
That gap-up changes the calculus for new entries. The signal fired before the move; chasing it now means accepting a worse risk/reward. The levels laid out should help traders position: ~420 is the line in the sand on the upside, and ~392 is where the bulls need to hold, and anything below that hands the tape back to the bears, with the potential to go as low as ~350 before institutional bulls meaningfully step back in.
For patient traders, a pullback to ~400 or a retest of the 50-EMA would be the cleaner entry. For those already long, the MACD and RSI suggest the momentum isn’t exhausted, but position sizing matters here. Don’t get caught overweight after the move if you can’t withstand a drawdown back to the ~365 mark.
The big picture hasn’t changed for AI and therefore semiconductors; if anything, the cycle is accelerating. The sector got cheap for the wrong reasons. If the ceasefire holds, this thrust may be the first chapter of a breakout to new highs, up toward ~440. I am setting my take profits around the ~455 mark, expecting heavy resistance there, although it may take some time and further meaningful movement on a peace deal to get there.