



The South Korean stock market is one of the cleanest ways to trade the global memory and semiconductor cycle without buying U.S.-listed semiconductor names that are now at all-time highs. Samsung Electronics (SSNLF) and SK Hynix (HXSCL) are the world’s two largest memory makers, and together they make up roughly 45% of the iShares MSCI South Korea ETF (EWY), my preferred vehicle to trade the South Korean market. They are the direct beneficiaries of the memory shortage I wrote about a few weeks ago, where the AI CapEx cycle has run headlong into an undersupply of the high-bandwidth memory (“HBM”) that AI chips require—the kind that Samsung and SK Hynix make. Pricing for memory chips has roughly doubled in projected forecasts over the last few months, and the two firms with the manufacturing scale to actually meet that demand are Korean and not listed in New York, even as ADRs. EWY has been responding accordingly, but the chart has set up something more interesting than just a momentum trade. It’s been carving out a familiar technical pattern over the last few months—the inverse head and shoulders—and it just printed the second shoulder.
The Memory Shortage Remains a Catalyst
The memory shortage is a fact in the AI world, and the pricing is showing it. Samsung’s most recent quarterly results showed the Memory Business setting an all-time high for quarterly revenue and operating profit, with HBM leading the way and the broader memory unit up over 60% YoY.
SK Hynix’s quarter was even better—the company is the de facto sole supplier of the HBM3E chips that Nvidia (NVDA) needs for its Blackwell platform, and that dependency translates directly into pricing power. SK Hynix’s operating margins on its DRAM business cleared 50% in the most recent quarter, which is the kind of margin profile usually associated with software businesses. End-user pricing is soaring, and while the biggest moves look behind us, the prices appear to be structurally higher, which means margins are likely sticky for these two memory giants.
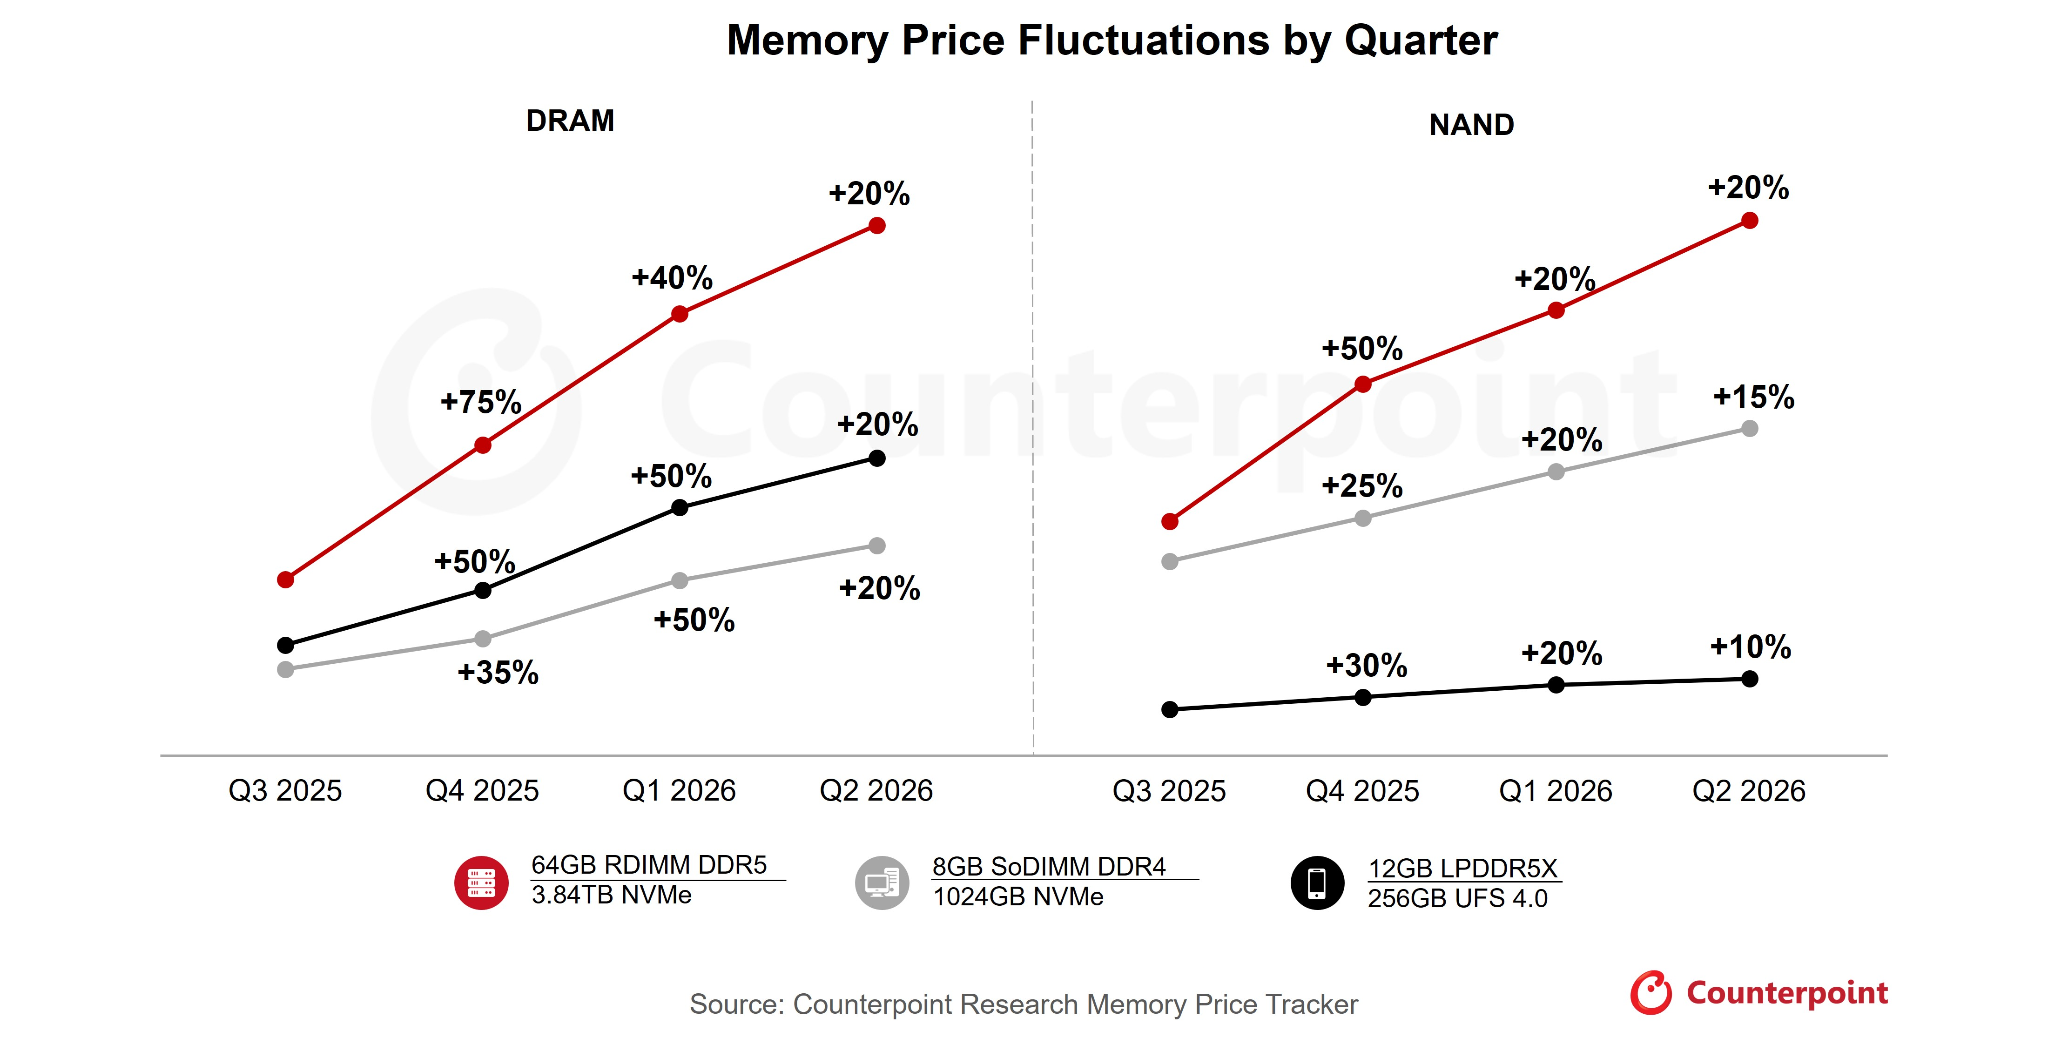
What makes the Korean trade different from buying U.S. semiconductor names is the valuation. The VanEck Semiconductor ETF (SMH) trades at ~45x. EWY, by contrast, trades at ~18x forward earnings on a blended basis. You are paying a bit over a third of the multiple for direct exposure to the memory cycle that is arguably the tightest sub-segment of the entire AI hardware stack—HBM is the linchpin that the Taiwanese chip makers don’t have. There’s a reason that these two companies make up nearly half of EWY, but also why they’ve been rated this way.
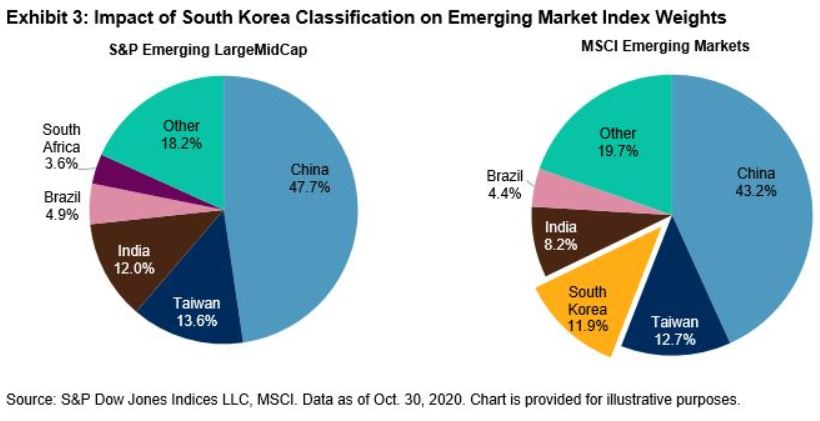
The Korean discount is partially structural; the chaebol come with governance concerns, the won is volatile, and the broader Korean market is still being reclassified by some index providers out of the emerging market camp, meaning it is out of favor with fund managers whose investment mandate only includes developed countries (and those investors whose international exposure stops at EAFE). But the global competitive position is better than the market gives it credit for, and the key risk that has stopped Korea’s reclassification with MSCI, the won, is changing.
Note here that if you believe you have embedded exposure to South Korean stocks through a foreign markets fund, make sure to check the details. The index that the fund follows will determine South Korea’s inclusion. MSCI-based indexes classify Korea as an emerging market, while Dow Jones-based indexes classify Korea as a developed market.
The Won Is The Hidden Tailwind
One of the most underappreciated parts of the EWY trade is the currency layer; it is not just a long bet on Korean stocks but also an implied long bet on the won. This cuts both ways, but right now, there are reasons to be bullish on won exposure.
The Korean won has been weak against the dollar for most of the last two years, sitting near multi-decade lows. That weakness has been a tailwind for Korean exporters, which is essentially what Samsung and SK Hynix are. Memory chips are sold globally in dollars, but cost structures are largely won-denominated. A weak won inflates dollar-denominated revenue when it converts back to KRW, juicing reported margins. This is good for the largest firms in EWY, but usually bad for EWY investors as they eat the difference in the returns they get—since it comes back in dollars. The won has only gotten weaker since peaking against the dollar in 2021.
Here’s a long-term look, going back to 2010, with weekly candles:
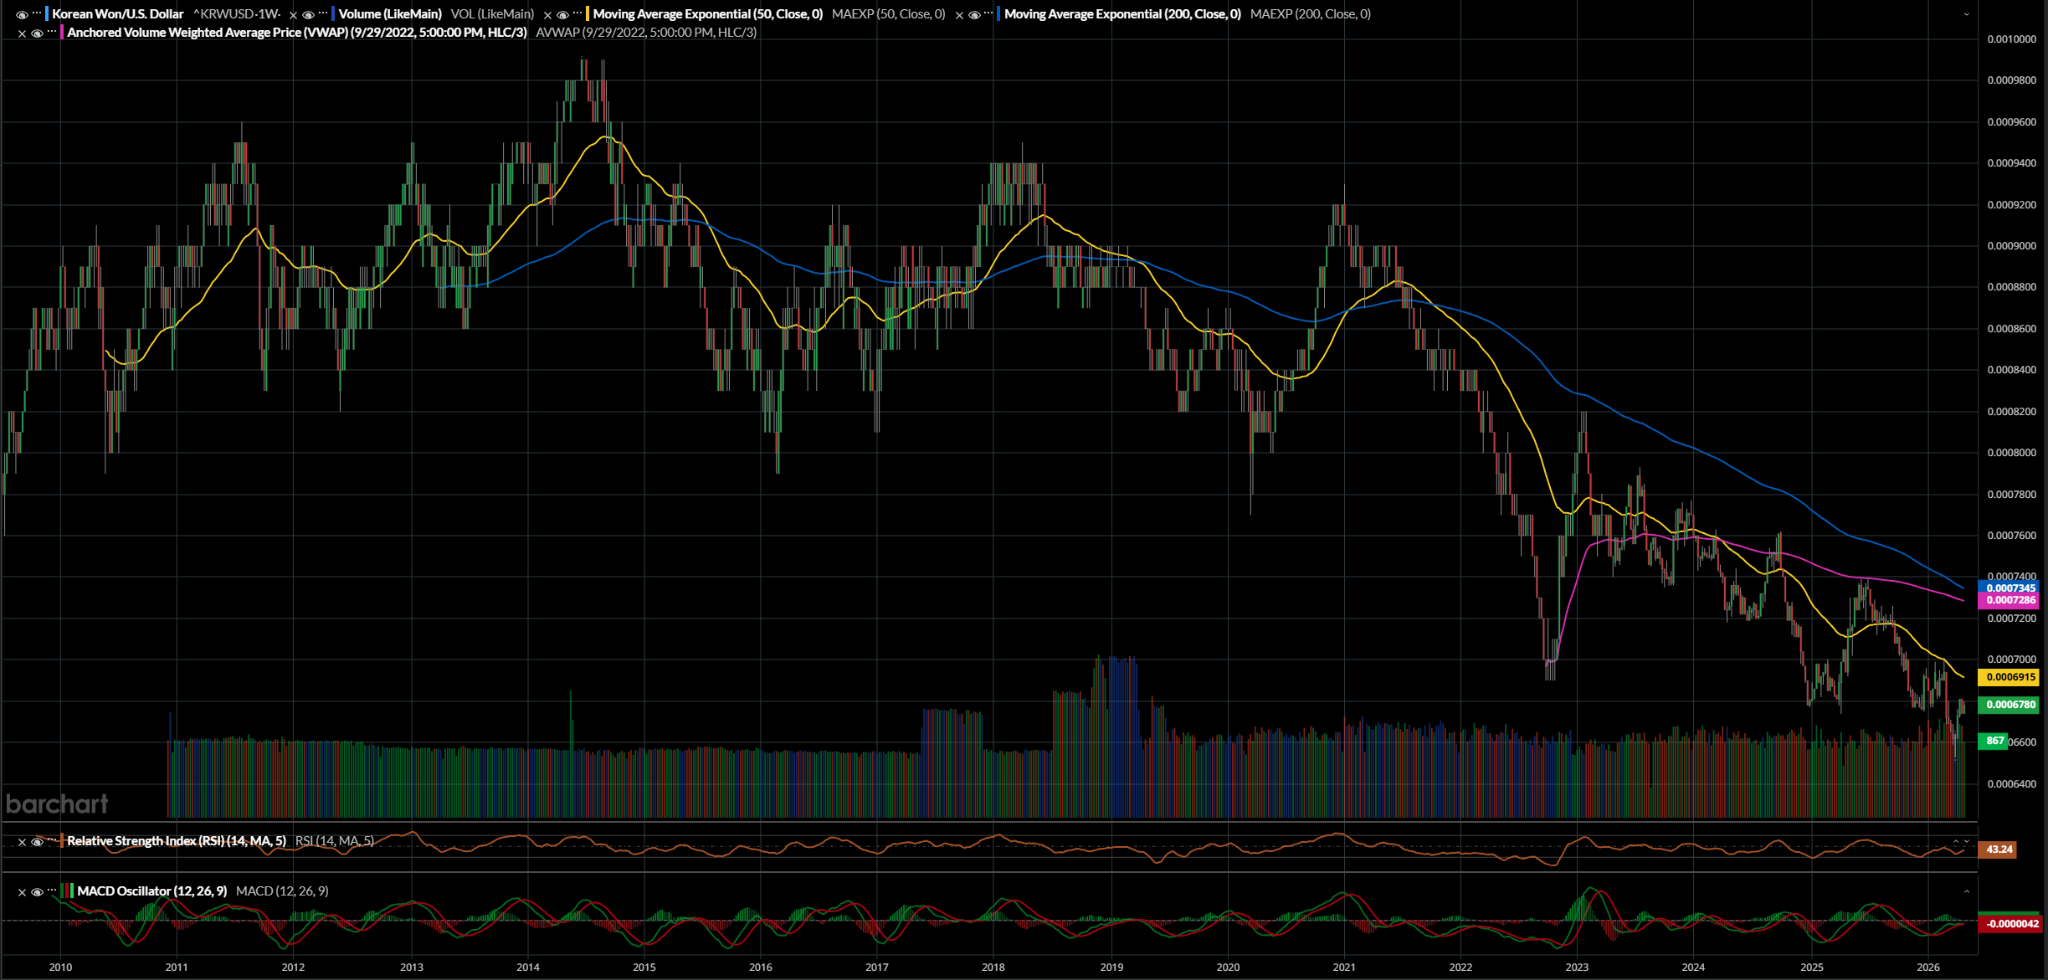
The setup gets more interesting when you consider that the won has started to firm up over the last few months as the Fed’s higher-for-longer posture has run into a softening labor picture and the Bank of Korea has held its rate at 2.5% and sits 100 bp lower than U.S. rates. There is a mismatch in policy expectations, with traders pricing in Korea softening before the Fed does, exacerbating this phenomenon.
A strengthening won would normally be a headwind for Korean exporters, but for a U.S.-based investor in EWY, won strength translates directly into ETF performance. EWY is unhedged, which means a 5% move in KRW/USD is a 5% accelerant on top of whatever the underlying equities do, up or down.
Currently, both legs are pointing in the same direction: Korean equities are catching a bid on AI memory exposure, and the won is firming against the dollar. That’s the kind of double whammy tailwind that doesn’t show up often. The technicals will show us what the move could look like.
EWY Technical Outlook
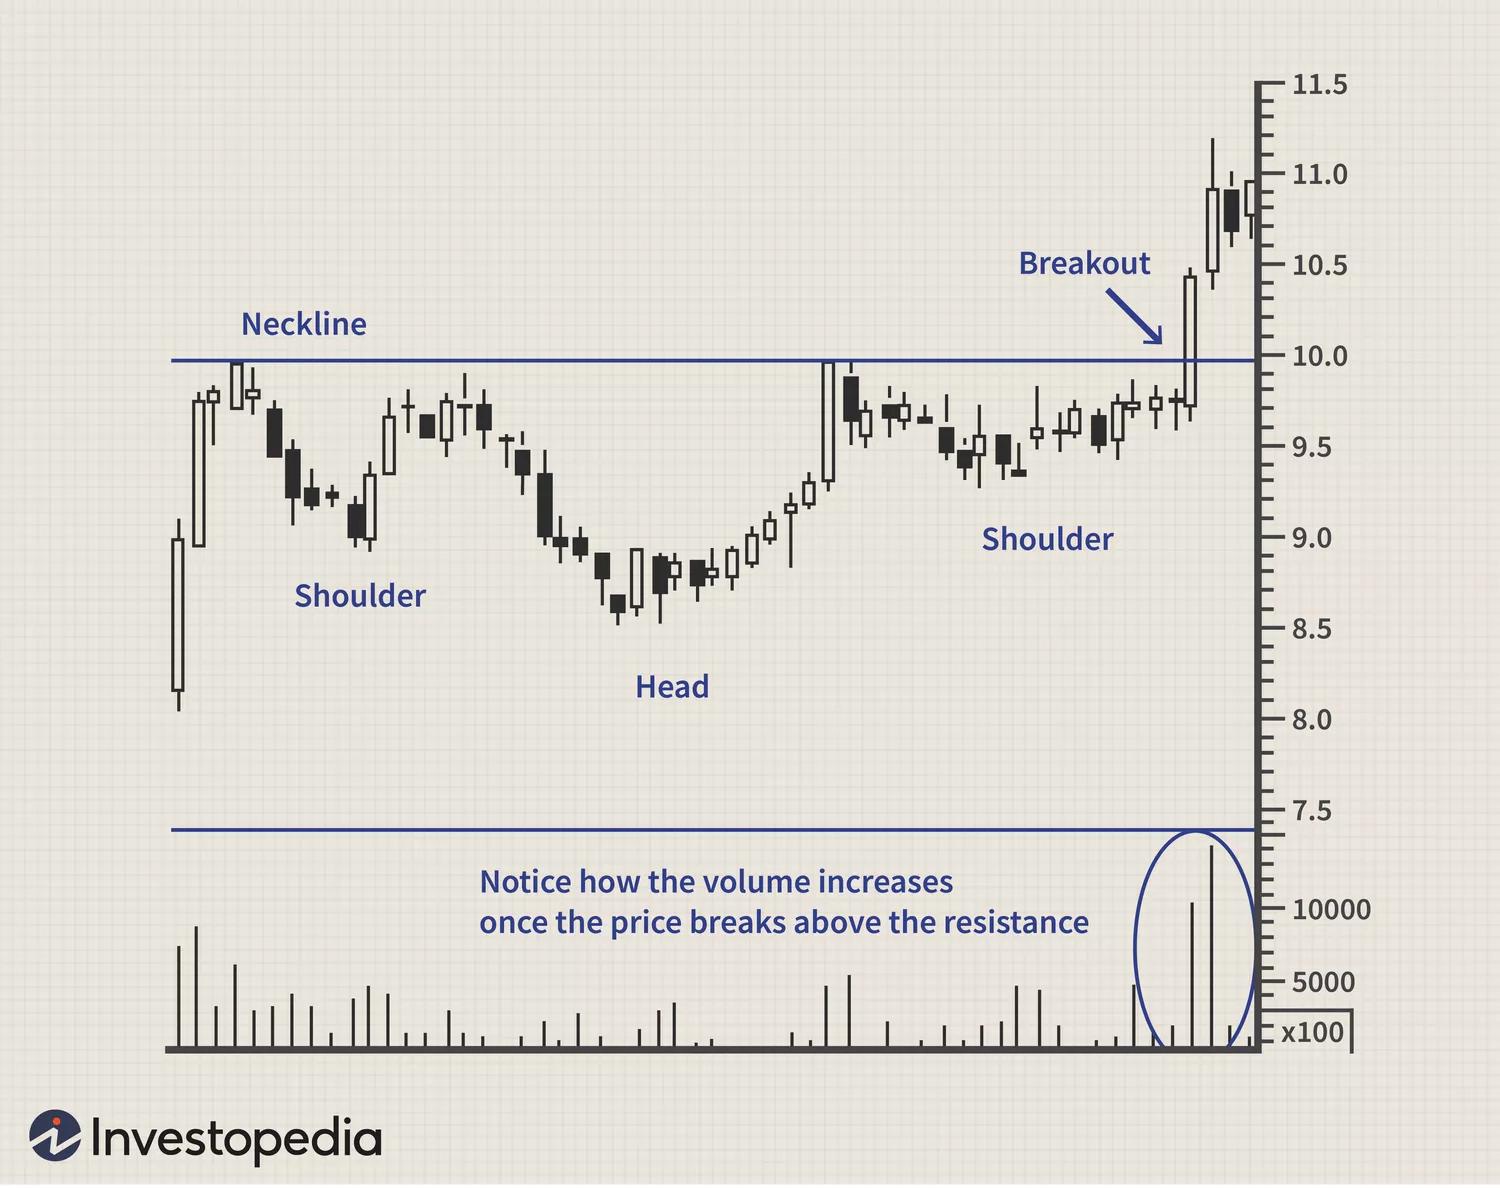
I had to do a double-take when I first saw this chart because I immediately recognized a pattern, although it’s not perfect. To me, it looks like an inverse head and shoulders pattern, a bullish read.
Here’s the pattern:
And here’s the EWY 6-month daily chart:
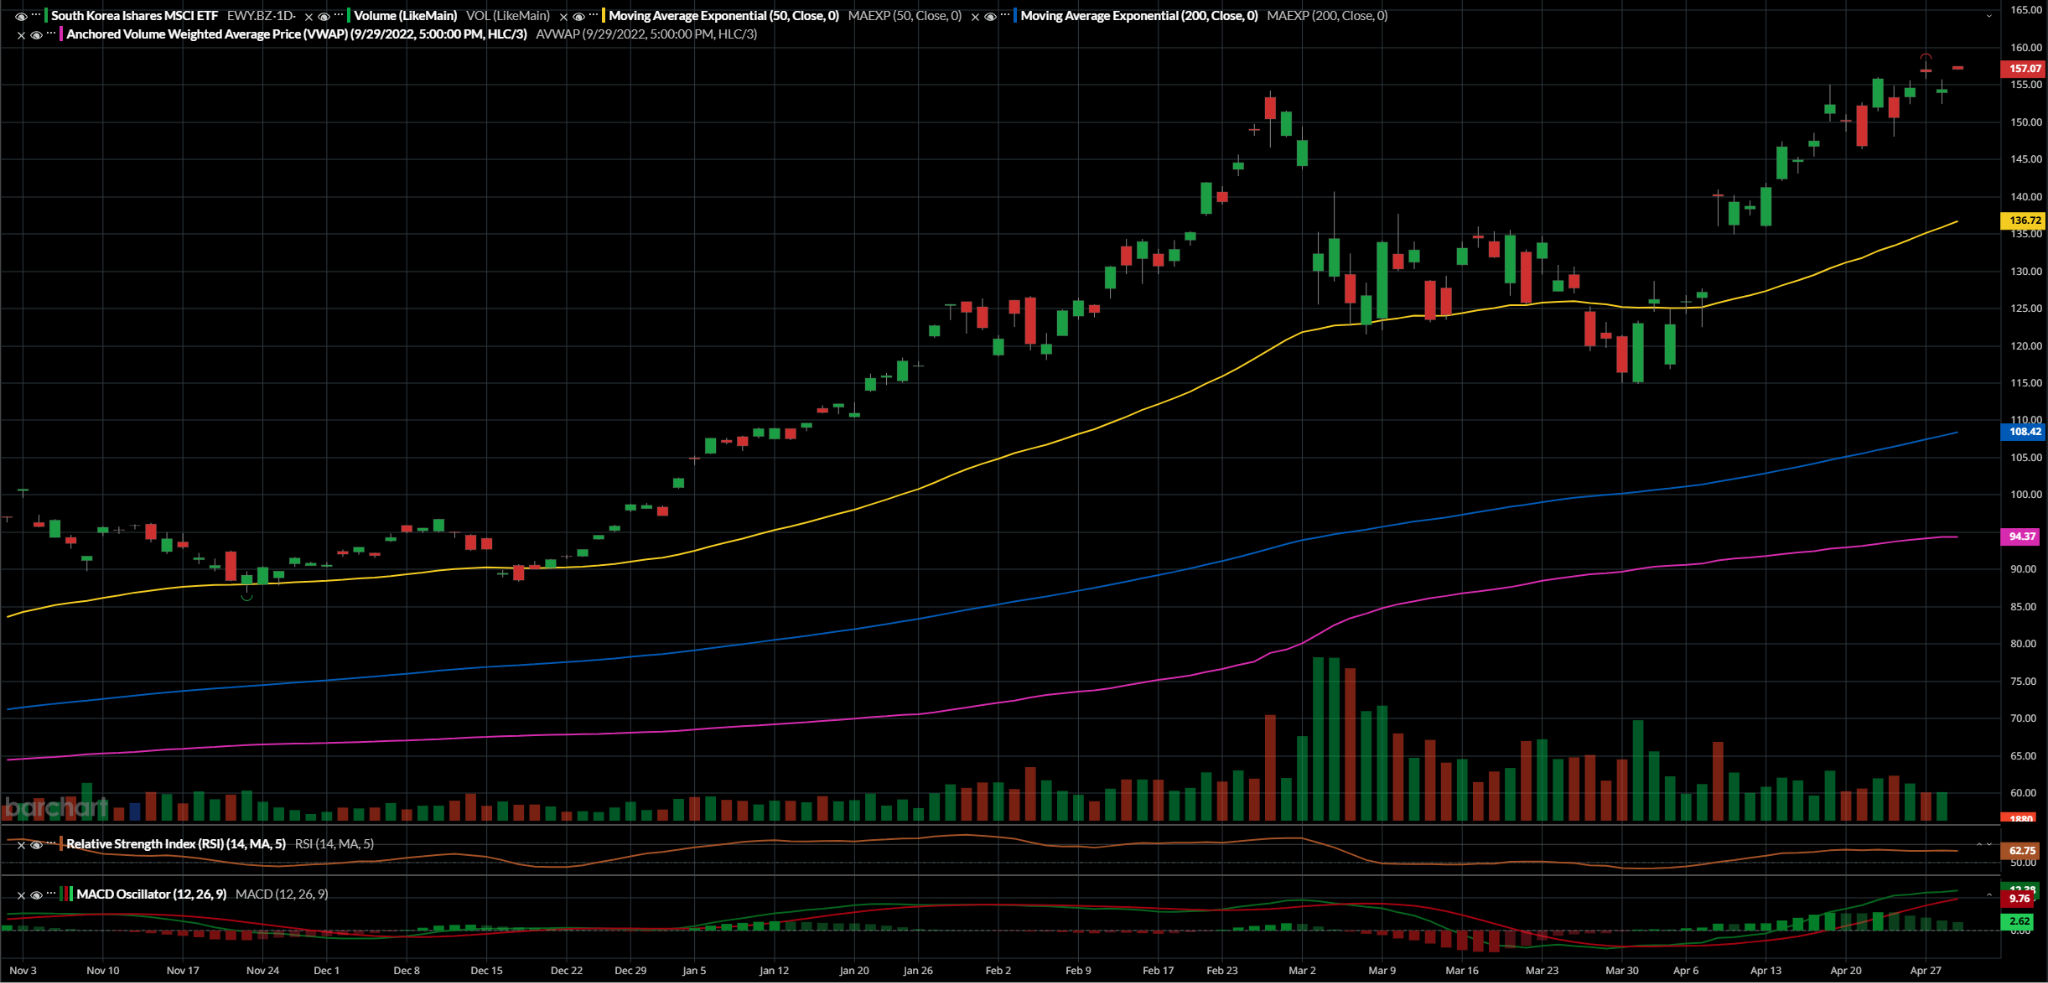
Like I said, it’s not perfect, but it’s close—and technical analysis is often one of those things like horseshoes and hand grenades. The missing piece of the pattern is the volume requirement, where the volume has fallen from its elevated state and now sits around average despite running up to new highs. But should the pattern extend, and the macro and fundamentals look rosy and favorable to me, the suggestion is that another breakout is ahead of us.
Should volume show up to the trade, this could really take off as it’s primed for a further run. There is a lot of air above EWY, and the structure shows that above here, EWY could run significantly before hitting resistance, the next structural level at ~165 and then ~180 beyond that. Momentum is rolling over in moving averages, but relative strength is firm, so it’s mixed—additional volume would likely solve for this. The pattern is largely played out already, as we’ve hit a new high already, but the last bullish move could still be ahead.
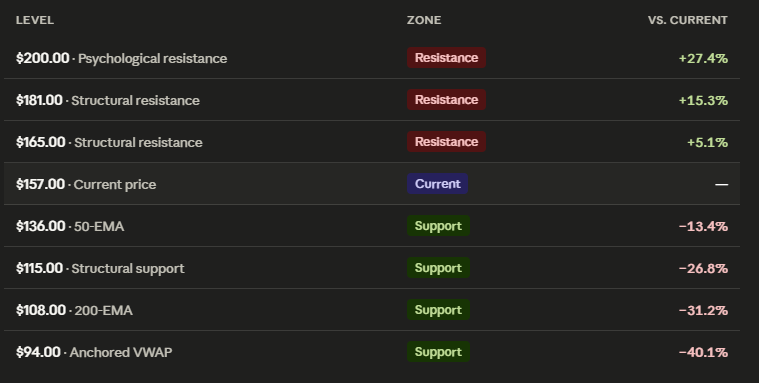
Here are the key levels to watch moving forward:
Conclusion
EWY shows the rare setup for foreign markets where the fundamental case, the currency case, and the technical case are all pointing in the same direction at the same time. The memory cycle is delivering record results for Samsung and SK Hynix, which make up over half of the South Korean index; the won has started to firm up against the dollar as policy expectations shift, and that currency layer compounds whatever the underlying equities deliver; the chart has carved out a near-textbook inverse head and shoulders, just printed the second shoulder, and is sitting at new highs with significant air above it. These three independent setups are converging, which is what makes this trade interesting rather than just a momentum chase.
The catch is that the bullish technical pattern I see requires more volume to be confirmed, and it hasn’t shown up yet. The pattern is technically intact, but the confirmation that usually accompanies the breakout phase isn’t there yet. That’s the one piece traders should watch most closely in the coming sessions. If volume shows up, the $165 and $181 structural resistance levels come into play quickly, and there isn’t much standing between the current price and the psychological $200 mark beyond that, although it may take some time to reach those key levels. Without volume, this could resolve to trading in a channel or grinding back lower toward its trailing moving averages.
For traders willing to take the position now, the levels are well-defined. EWY is sitting near $157, with the 50-EMA at $136 as the first major support and the 200-EMA at $108 well below that. A break of the 50-EMA would invalidate the bullish setup and turn the trade neutral; a break of $115 structural support would flip it outright bearish before an expected fight for the 200-EMA. But the next leg, if it comes, could run another 15-25% before serious resistance, and the macro catalyst (continued memory pricing strength + won firming) supports that move.
For investors who don’t want to time the breakout, EWY at current levels still offers something U.S. semiconductor names don’t: direct exposure to the tightest sub-segment of the AI hardware stack without the US semiconductor multiple markup. Paying ~18x for an index that is almost half exposed to the two largest memory manufacturers in the world when the SMH ETF trades at ~45x is the kind of valuation gap that resolves over time even if the technicals don’t deliver an immediate breakout. The Korean discount has structural reasons behind it, but those reasons are slowly being addressed through the potential MSCI reclassification and a firming currency that signals capital is starting to take the country more seriously.
Of course, there is much room to fall here as well, and prudent traders may do well to wait and see—if no volume comes, a retest of the 50-EMA would be a great buying opportunity, but that’s far from current prices and may test the patience of many investors in the meantime.