


The relationship between oil prices and long-term interest rates is one of the most overlooked signals in global macro markets. While traders often focus on supply disruptions, geopolitical risk, and OPEC policy when analysing crude oil, another market may be sending a much more revealing message. That market is the U.S. Treasury market.
Since the Global Financial Crisis of 2008, WTI crude oil and the U.S. 30-year Treasury yield have displayed a notable relationship, with the two moving together with a correlation of 46%. It is not a perfect relationship, and short-term deviations are common, but the broader message is clear: both markets are heavily influenced by the same underlying force – expectations for nominal economic growth.
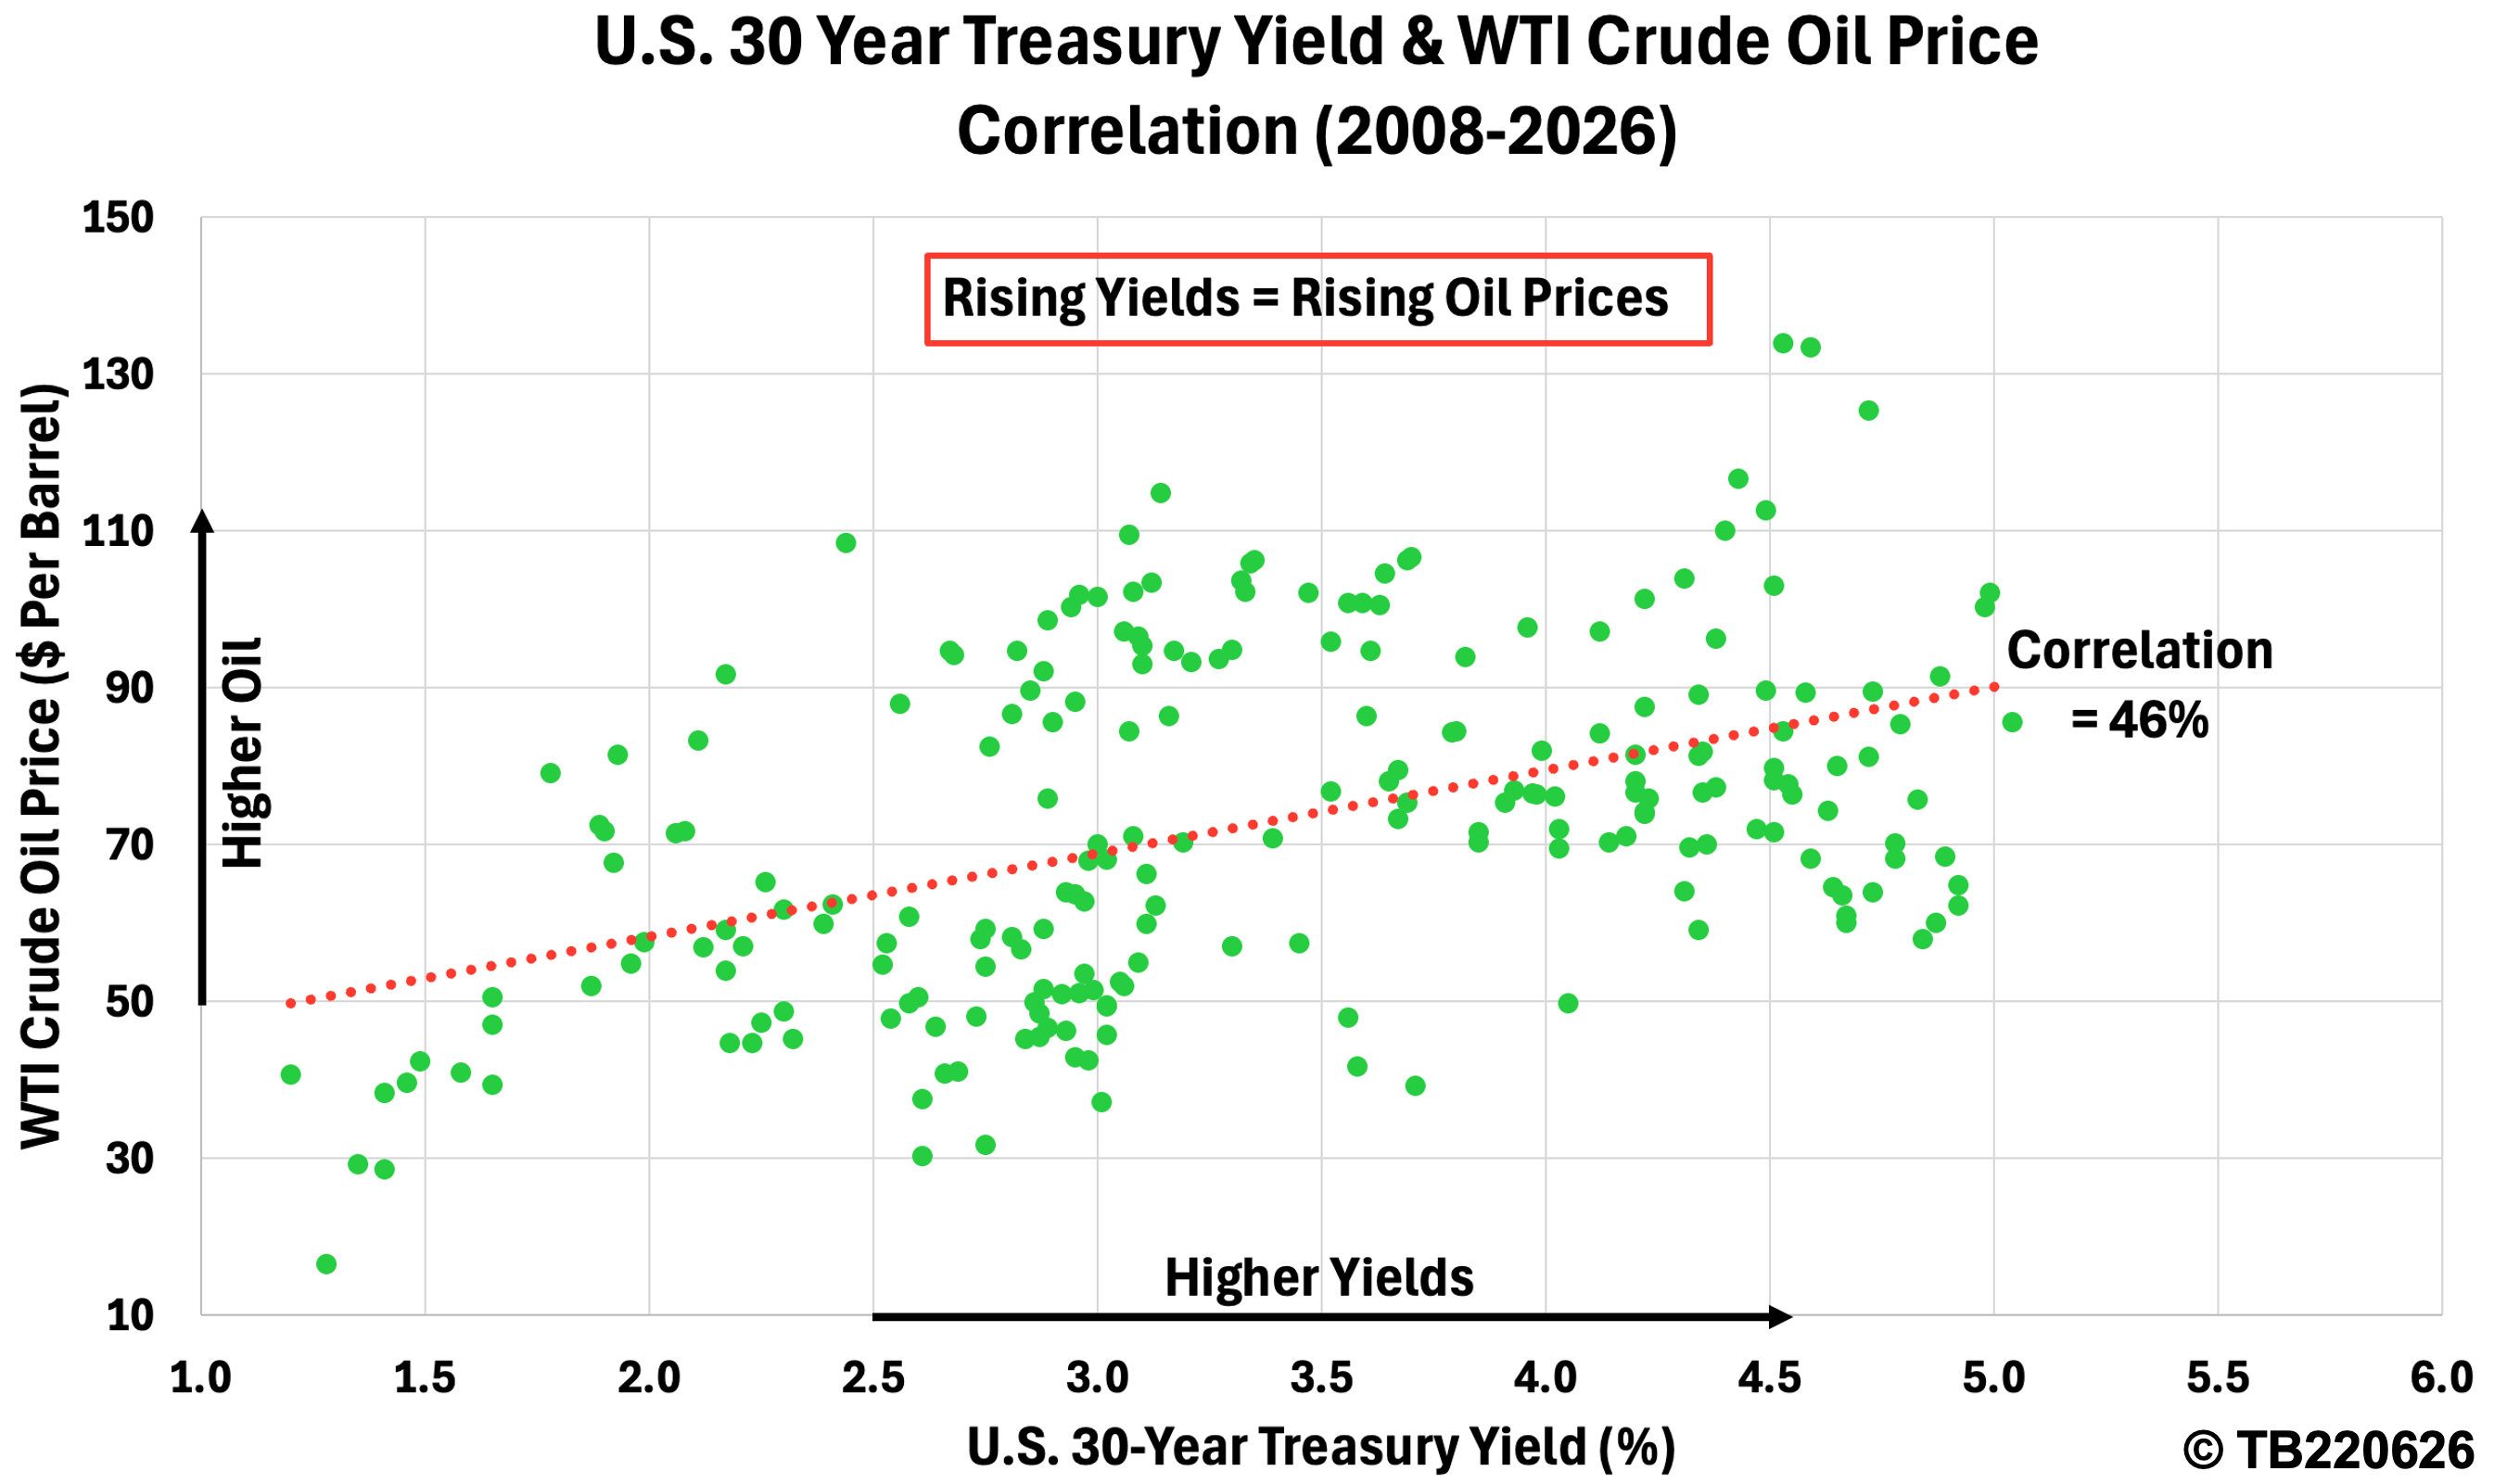
Put simply, oil and long-duration bonds are both reacting to the market’s view of where the economy, inflation, and liquidity conditions are heading. And right now, that relationship may be flashing a warning.
One Macro Force, Two Markets
At their core, both oil prices and long-term Treasury yields reflect expectations about future economic conditions. When investors expect stronger growth and persistent inflation, the market typically responds in two ways:
- Oil demand expectations rise, supporting higher crude prices.
- Bond investors demand greater compensation for inflation risk, pushing long-term yields higher.
The opposite occurs during periods of economic weakness or falling inflation expectations.
- A slowdown reduces expectations for energy demand, putting pressure on crude prices.
- At the same time, investors often seek safety in government bonds, pushing yields lower.
This is why oil and 30-year Treasury yields have historically tended to move in the same direction. The bond market is effectively pricing the future path of the economy – and oil often follows that signal.
The Current Market Disconnect
Today, however, the relationship appears stretched. U.S. 30-year Treasury yields are around the 4.9% level, while WTI crude oil is trading near $75 per barrel. Based on the historical relationship between yields and oil, crude appears significantly undervalued relative to what long-term rates are implying.
WTI Crude Oil Price Forecast
Every new WTI Crude Oil analysis as it publishes, today's technical signal and key levels, live price — on one page.
See all WTI Crude Oil forecasts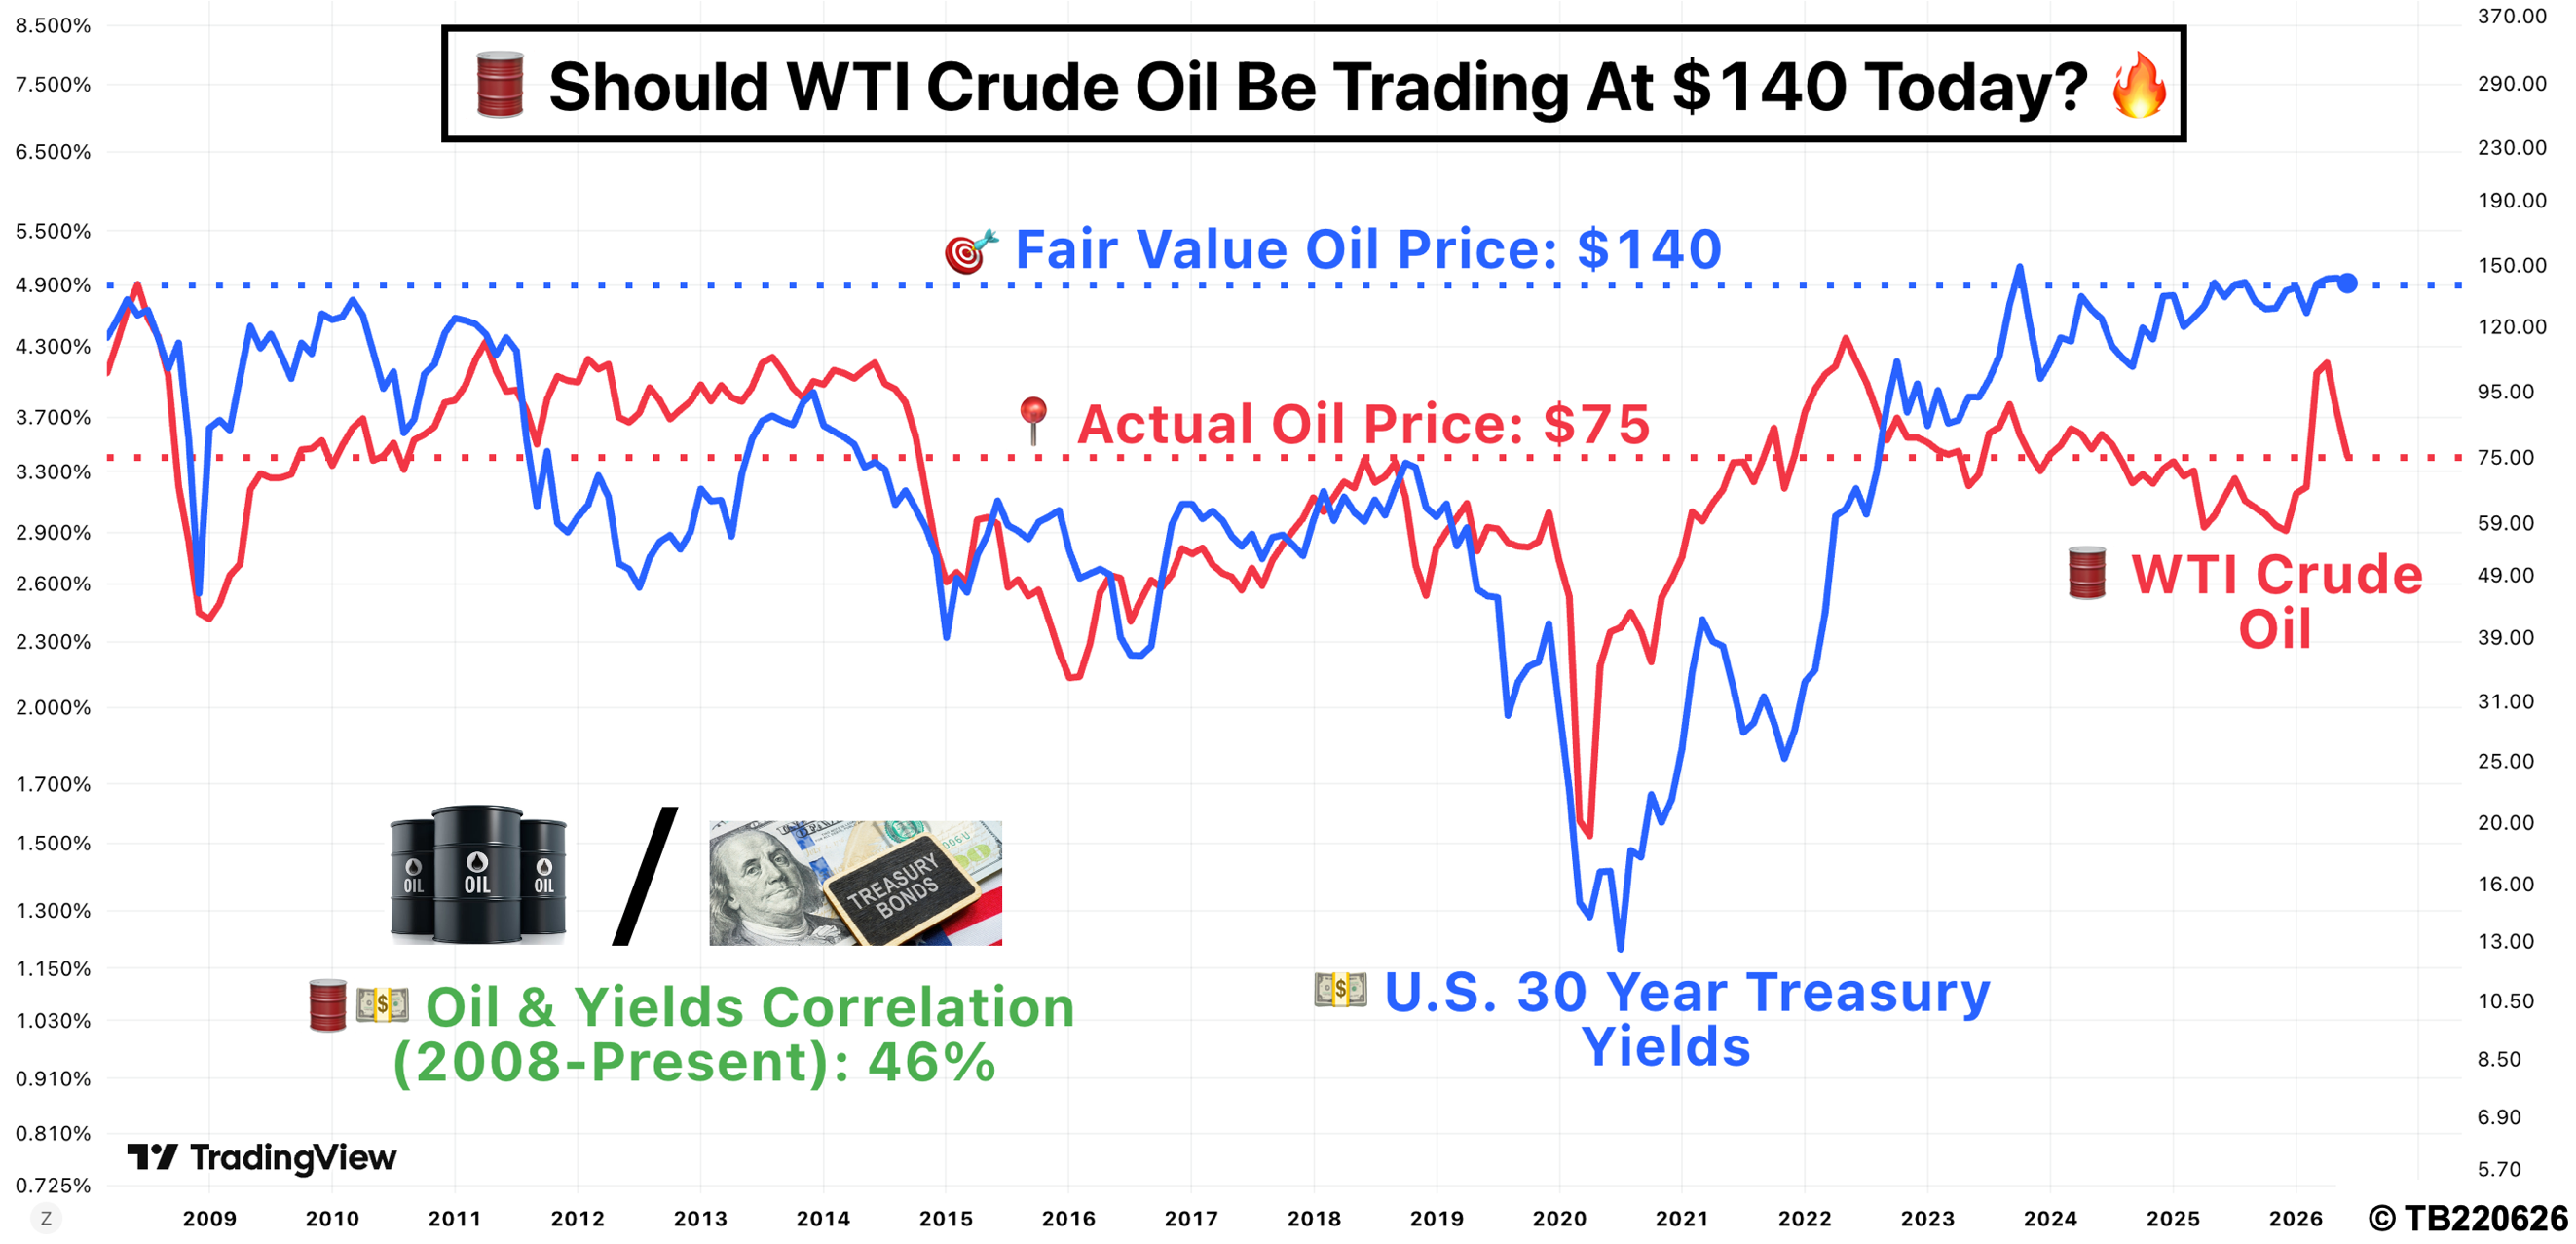
The market-based “fair value” suggested by the bond signal points closer to $140 oil.
That represents a potential $65 gap. The key question for investors is whether this is a temporary divergence – or whether oil is simply lagging behind the message already being delivered by the Treasury market. History suggests these gaps rarely persist indefinitely.
A Pattern That Has Repeated
Over the last 18 years, oil has repeatedly moved back toward the level implied by long-term yields. When crude traded significantly below its yield-implied value, prices eventually surged higher.
- In 2009, WTI traded around $40 per barrel while the implied fair value was closer to $80. Over the following years, oil climbed sharply, eventually reaching close to $120.
- A similar setup appeared in 2016. Crude traded near $30 while the yield relationship suggested a fair value closer to $50. Oil later recovered toward $75.
The reverse has also occurred. When oil moved significantly above what long-term yields justified, the market corrected aggressively.
- In 2014, crude traded around $100 while the implied value was closer to $70. Oil subsequently collapsed toward $30.
- In 2018, oil reached roughly $75 while the yield signal suggested closer to $60. The next major move saw crude fall dramatically, with prices briefly approaching $20 during the pandemic-driven collapse.
- In 2022, oil surged near $120 after the Russia-Ukraine shock, while the bond signal again suggested closer to $60. Prices eventually retreated toward the $50-$60 range.
The takeaway is not that oil mechanically follows yields every time. Rather, the bond market often provides a powerful macro anchor for where energy prices may eventually settle.
The 2026 Oil Question
Geopolitical risk has clearly played a role in oil’s recent strength. Supply concerns, regional conflicts, and fears around energy security can create sharp moves in crude. But focusing only on geopolitics risks missing the bigger picture. Oil did not rise solely because of conflict. It also rose because it was starting from a position where it appeared deeply discounted relative to broader macro conditions.
At the beginning of 2026, crude was trading near $55 per barrel while the yield relationship suggested a much higher level – around $140. That gap created the foundation for a potential repricing. The geopolitical backdrop may have accelerated the move, but the underlying macro imbalance existed beforehand.
The $140 Oil Scenario
If crude oil eventually converges toward the level implied by long-term Treasury yields, the consequences would extend far beyond energy markets. A move from $75 to $140 oil would represent another major inflationary shock. Consumers would immediately feel the impact through higher fuel costs, leaving less disposable income for other spending. The chain reaction could spread across the economy:
Higher gasoline prices → weaker household purchasing power → reduced discretionary spending → slower consumer demand
At the same time, businesses would face rising input costs. Transportation, manufacturing, agriculture, and industrial sectors all rely heavily on energy. Higher oil prices would squeeze profit margins and potentially force companies to reduce investment or cut costs. That creates a dangerous combination: Higher inflation at the same time as weaker growth. The scenario economists fear most is a renewed period of stagflation.
Expressing The View: A Defined-Risk Oil Opportunity
For investors who share the view that the bond market may be signalling a potential move toward higher oil prices, the key question becomes how to express that view while managing downside risk.
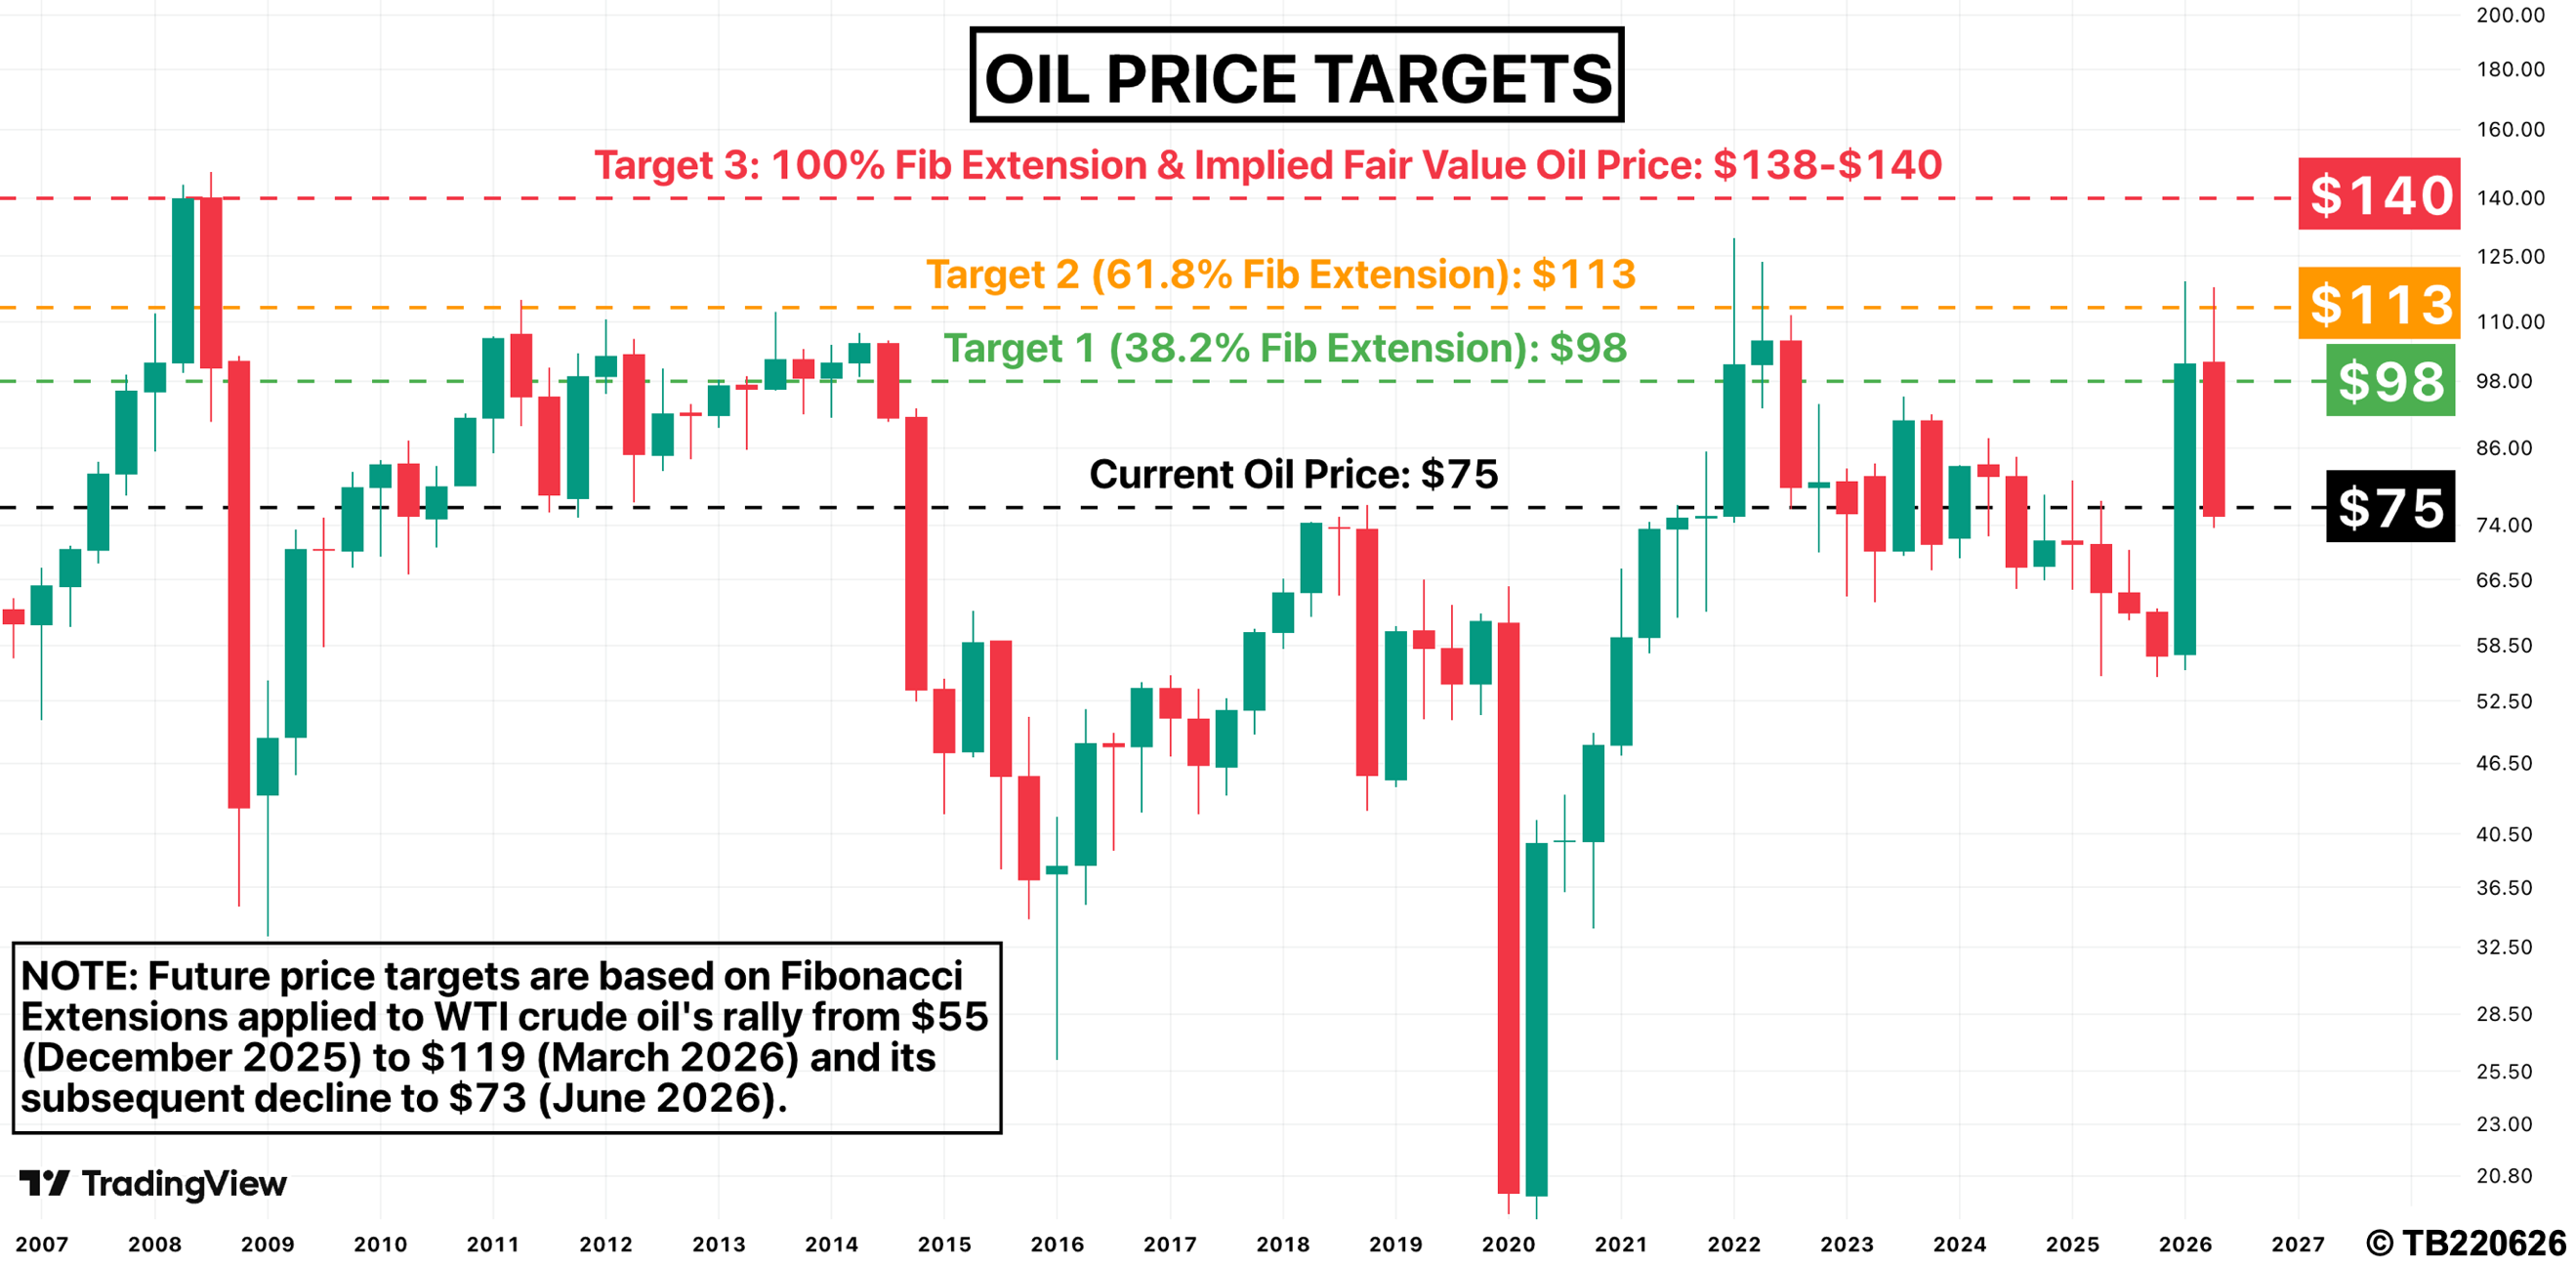
From my perspective, I would treat the current oil price near $75 as a potential opportunity to express this macro view while keeping the downside clearly defined. I would focus on a risk level below the recent low around $70, as a break below that point would suggest that the market is challenging the bullish thesis and that the original risk/reward setup may no longer be attractive.
On the upside, I would prefer to manage the position progressively rather than rely on a single target. If crude advances toward the first major resistance level near $98, I would consider reducing my exposure by roughly one-third to reflect that part of the expected move may already be priced in. If momentum continues toward the next target around $113, I would consider taking a further 50% of the remaining position off the table, as the probability of additional upside becomes more uncertain.
Any final move toward the long-term bond-implied target near $140 would represent a point where I would reassess whether the original thesis remains valid and whether maintaining the remaining exposure still makes sense.
This staged approach would allow me to participate in a potential macro repricing while acknowledging that markets rarely move in a straight line. The bond market may be pointing toward a higher oil environment, but risk management remains essential because supply responses, demand shifts, and policy decisions can quickly change the energy landscape.
The Market Signal Investors Should Watch
The bond market is often considered one of the most sophisticated and liquid markets in the world. Trillions of dollars flow through Treasury markets, with participants ranging from central banks and pension funds to global institutions.
When long-term yields remain elevated, they are sending a message about future inflation, growth, and government financing conditions.
If crude remains below the level implied by yields, the risk is that oil continues climbing until the gap closes. That does not guarantee $140 oil. Markets are influenced by technology, demand changes, supply responses, and policy decisions. Energy markets are particularly vulnerable to sudden shifts. But history shows that large disconnects between oil and long-term yields tend to resolve eventually.
Final Thought
The most important macro signals are often hidden in relationships that investors do not watch closely. Oil prices grab headlines. Bond yields often move quietly in the background. Yet together, they may be telling the same story.
The bond market is suggesting that the current oil price may not fully reflect the economic environment ahead. And if crude does move toward the $140 level, the consequences could be significant – not only for energy markets, but for inflation, consumers, corporate earnings, and recession risk. Oil may not be the only problem. The real warning may already be sitting in the bond market.