


The Fed held rates steady at their March 18th meeting, and most investors walked away hearing a familiar message: wait, watch, and stay data-dependent. But there was more that the Fed said that was not in Powell’s press conference. It was buried in the release that came out alongside it, the dot plot, where officials quietly put in a single chart that told us what their new intentions are for interest rates: higher for longer.
The Federal Reserve’s Open Market Committee (“FOMC”) regularly releases the Summary of Economic Projections, which they call the “SEP” (said “S-E-P”). It comes once a quarter and contains the forecasts of all 20 participants in the committee. Effectively, it’s a look into the models of the people who decide interest rates. We get their ideas about growth, inflation, unemployment, and rate policy. This document is both overanalyzed and underappreciated by investors.
Follow The Dot Plot
The Fed often adjusts its operating model, like what they did in March 2022 when they began to hike interest rates in response to the inflation crisis. Suddenly, what the Fed expected inflation to be (at the time, “transitory” was the popular term) and thus real growth, unemployment, and their rate path were upended. Those who just listened to the press conferences heard the Fed’s thoughts on what they already did, but those who watched the dot plots had insight into what the Fed will do next.
This time is no different. The Fed is currently shifting its mental model of inflation, increasingly coming around to the conclusion that the global bond market has been pricing in over the last year: inflation in Western nations will be higher for longer.
That means rates will be higher for longer too, to keep liquidity tight—or, as Powell called it at his presser, to keep economic conditions “moderately restrictive”—for the long run. “Long run” in this case is beyond 2028, or essentially to make it standard operating practice for the Fed.
Changes in the “long run” assumptions are closer to changes in philosophy or world model than reactions to the current macroeconomic climate. Even in 2022, long-run assumptions rarely changed. These assumptions show what the participants believe is the most achievable within the Fed’s power, and they often disagree with each other. These long-run assumptions don’t move on simple disagreements or short-term shocks that the Fed can look past; they tend to have fundamental and structural reasons for the change.
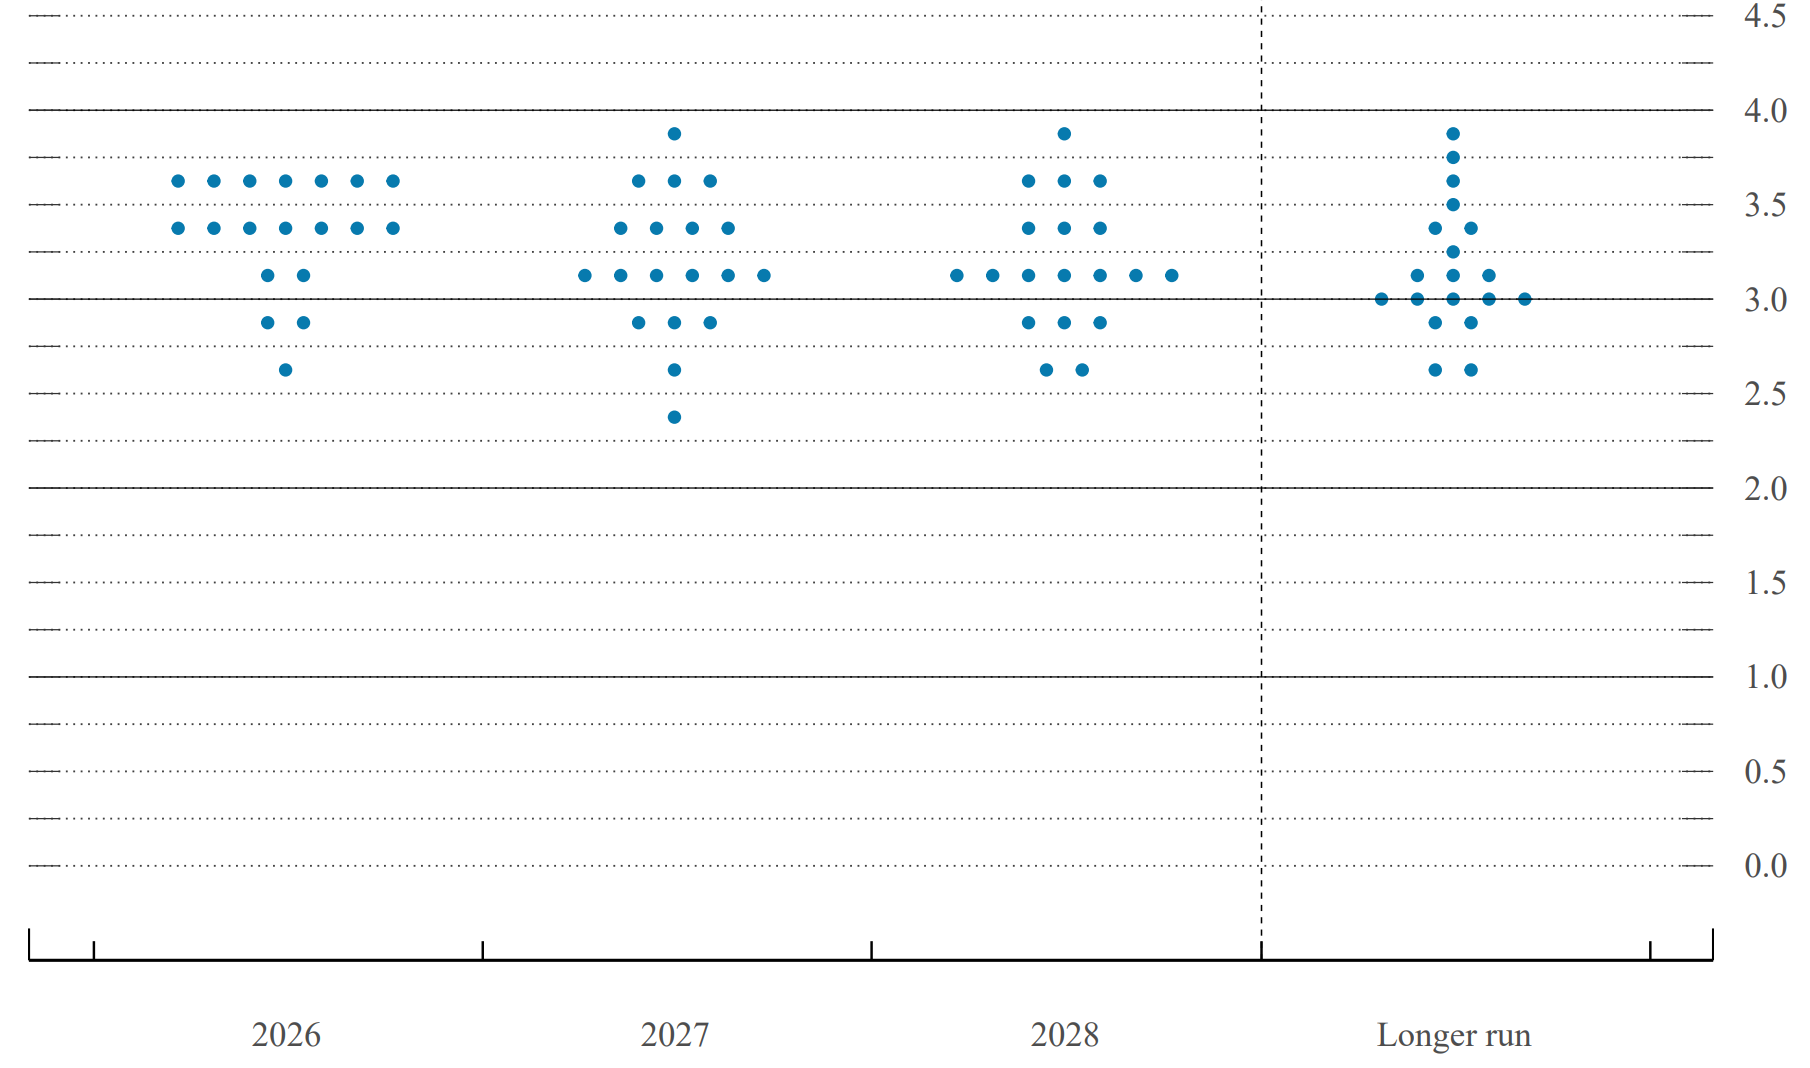
For context, here are the dots and why traders call it the “dot plot” in the first place. This is the headline of the release, which is the spread of votes by participants for their expectation of the Fed Funds Rate:
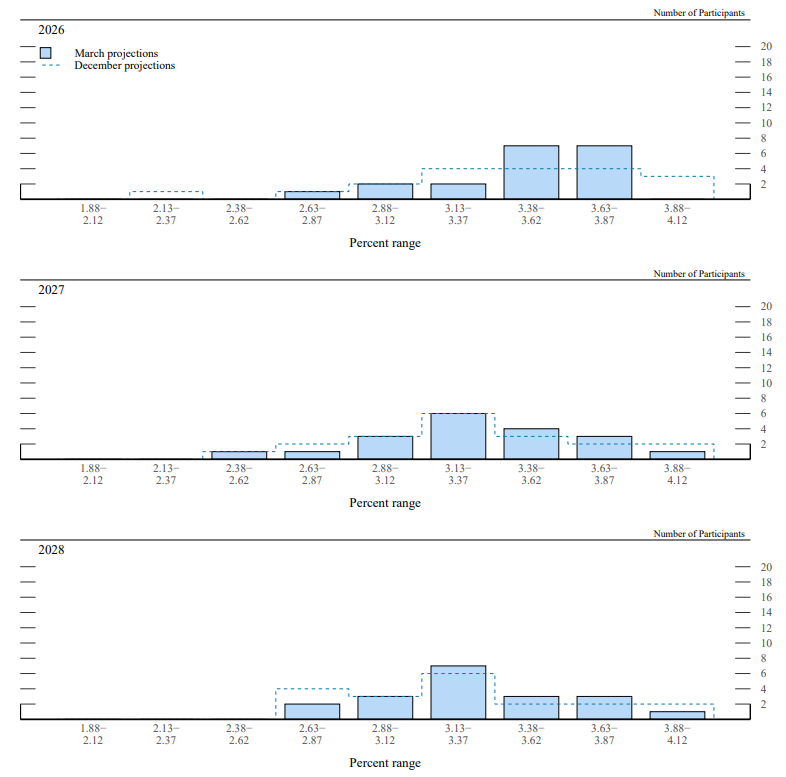
This brings us back to the chart from the bottom of page 9. The page covers the FOMC participants’ voting on their expectations for monetary policy. It starts with the end of this year, then 2027 and 2028. The dotted lines show the predictions participants made in December. In all of these instances, the Fed is looking more dovish. More participants are inclined to see lower rates.
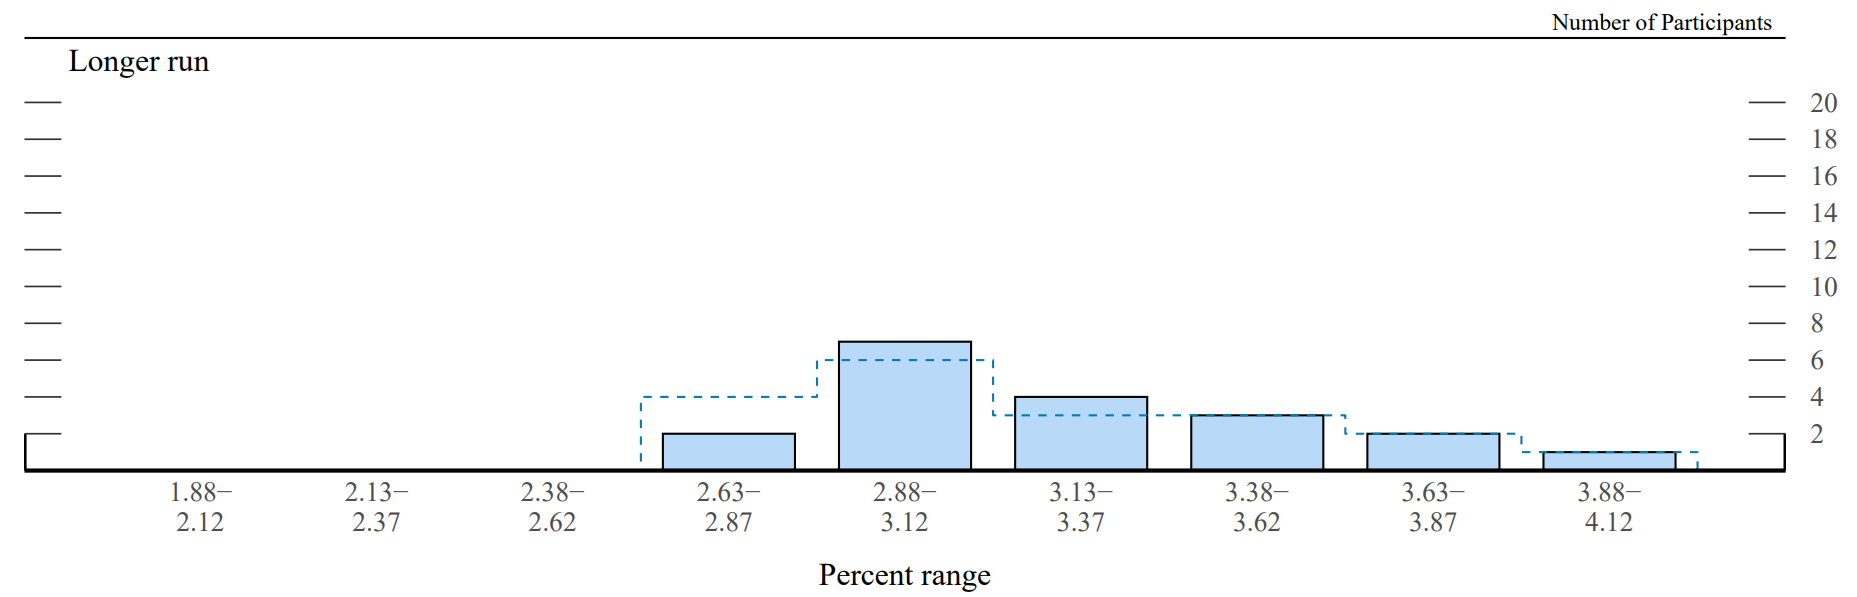
Below this is the long-run chart, which is the only one where the December to March change moves the other way, toward the high end. The Fed is saying that they think rates will be lower than previously expected in the upcoming years but end higher than previously expected at the end of the current cycle. Again, the dotted lines are for December’s votes.
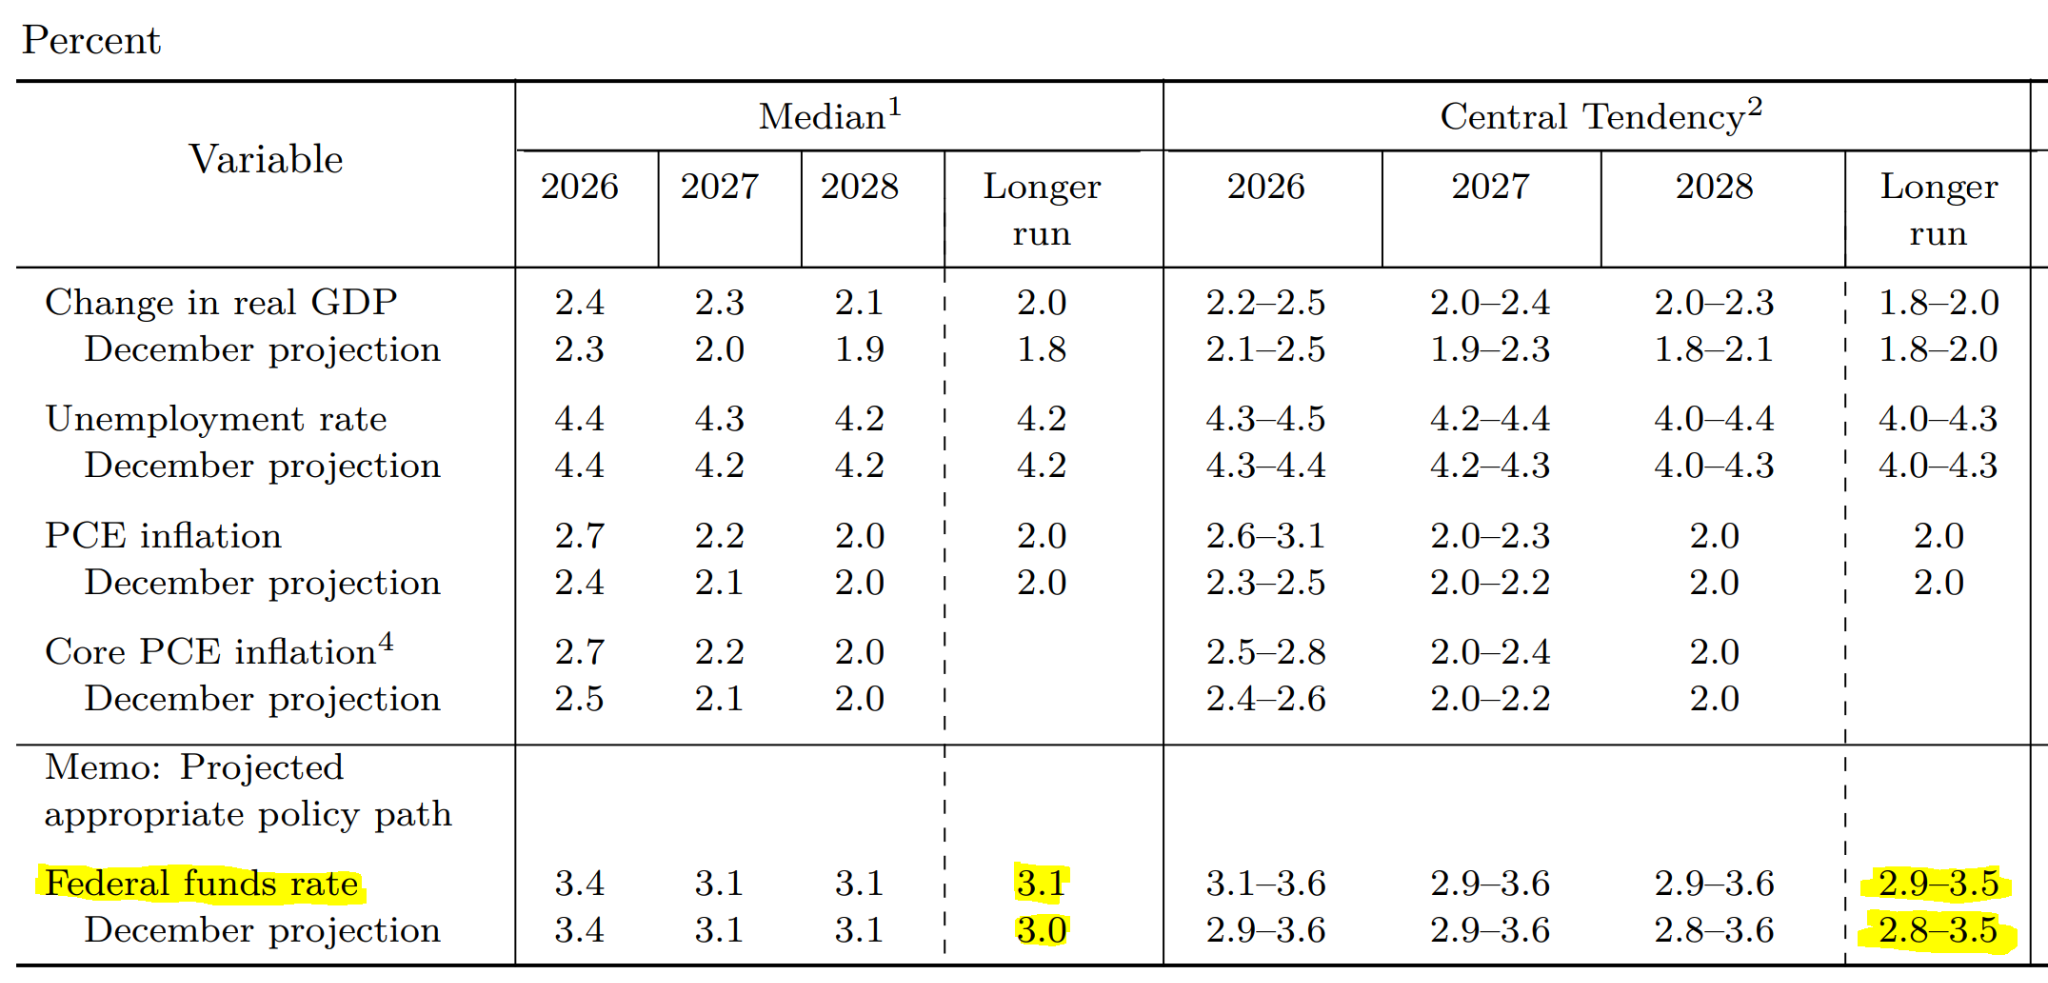
When looking at the data behind the voting, we can see that the committee didn’t change its opinion on the long-run trajectory of the central tendency for growth, unemployment, or inflation. All the while, they tightened their tendency and median projections for interest rates. This is as clear as the Fed can make it that they are expecting to keep monetary policy restrictive moving forward, more so than they did before. This is a small change now, but all changes in this long-run figure are meaningful. These figures are raised slowly when expectations change—I fear investors may not notice if they read these too quickly.
The rationale behind the decisions is not necessarily public, so it’s unclear what is driving the Fed to this end. What is clear is that we should expect tight conditions to continue, with rates staying elevated. Most of the FOMC’s dots for 2026 are around current rates, indicating that the majority believe that we have no or only one rate cut ahead of us for the rest of the year.
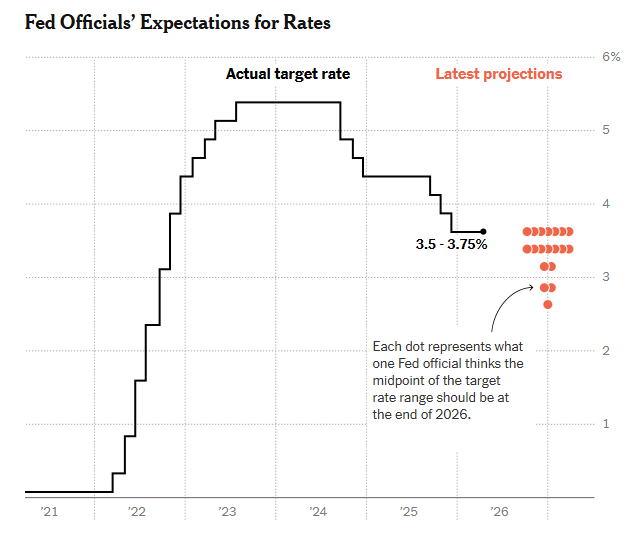
This shift is so notable because it means the most dovish individuals at the Fed are rethinking things. The market has been pricing in a dovish Fed and an increasingly dovish Fed that wants to lower interest rates.
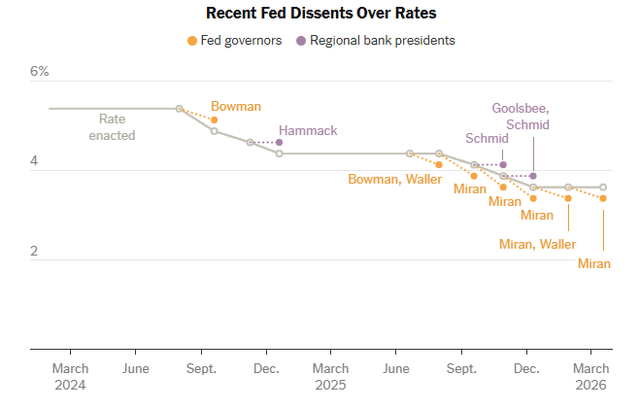
That may be changing, and this is the first sign of a shift in thinking from doves like Governor Miran, who has dissented at every Fed meeting he has been a part of.
He still dissented at this one, but he is one of the votes that shifted away from cuts. That is, as far as we can tell; he previously stood alone as the lowest dot on the chart (and still does in the one above for 2026, he’s the one at the bottom), so it was easy to figure out where he stood before. Now, he shares a view with other governors within the dots, indicating that the dovish elements are moving toward the hawkish side, not the hawks getting more hawkish.
Rate Cuts Are Off The Table
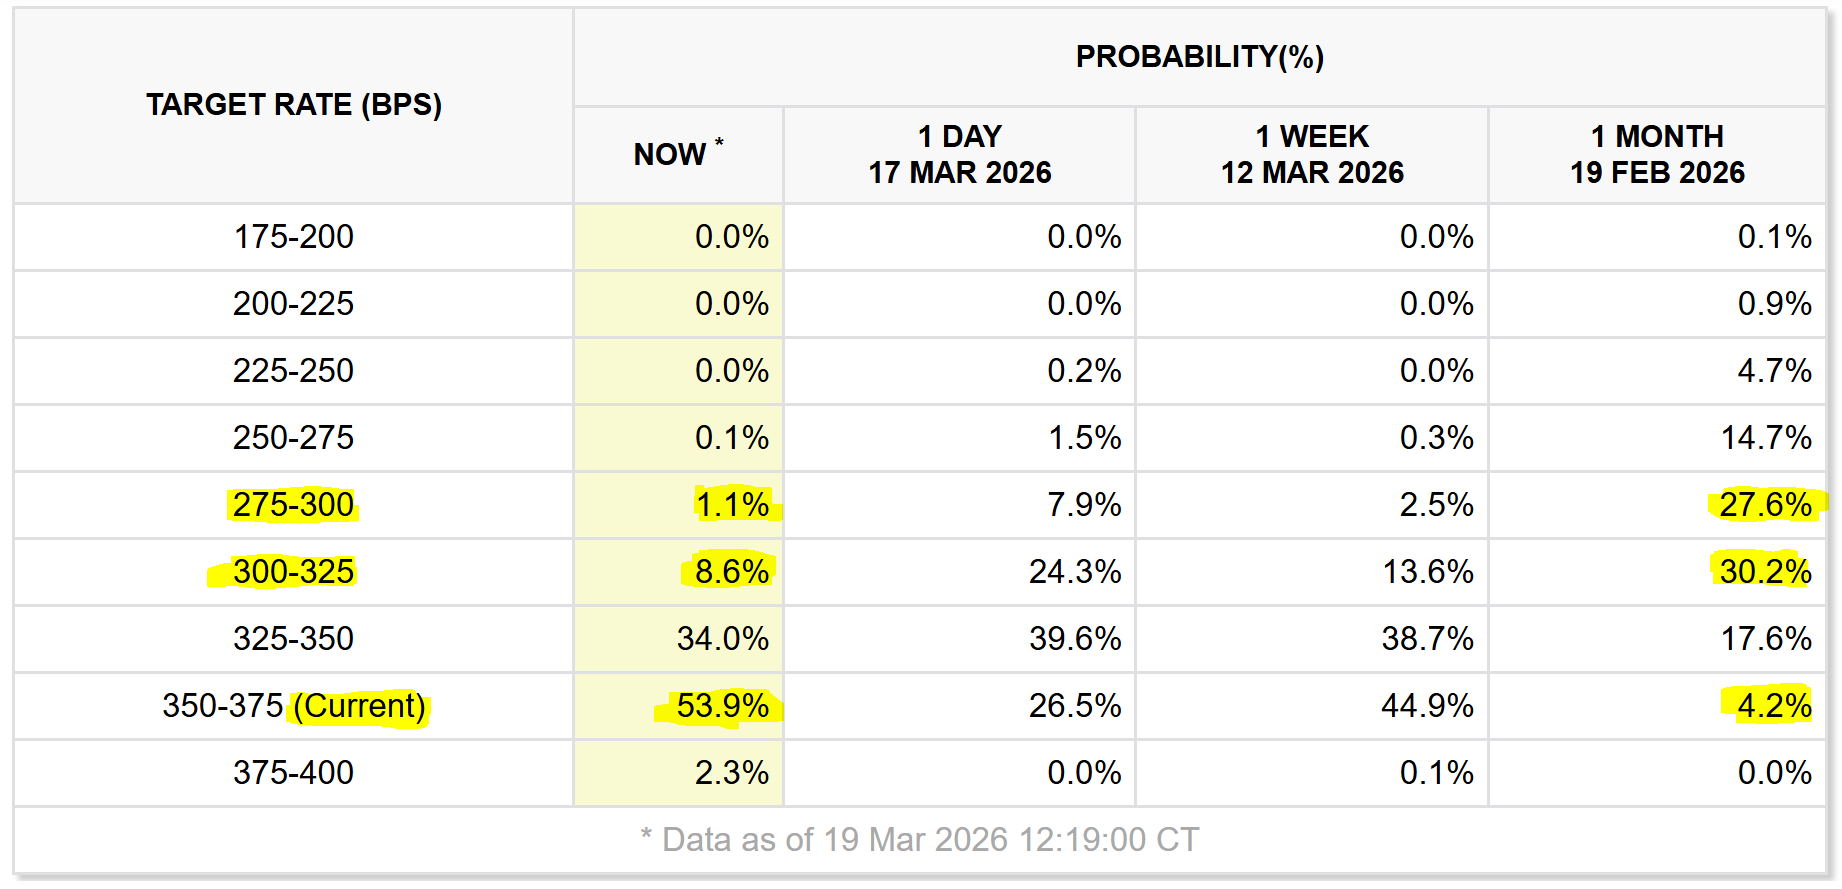
Investors following rate policy in the last year will know that we started with traders anticipating several rate cuts in 2026, with the core interest rate expected to fall as low as 2.5%. That’s all changed, and this move in expectations from the Fed sealed the deal.
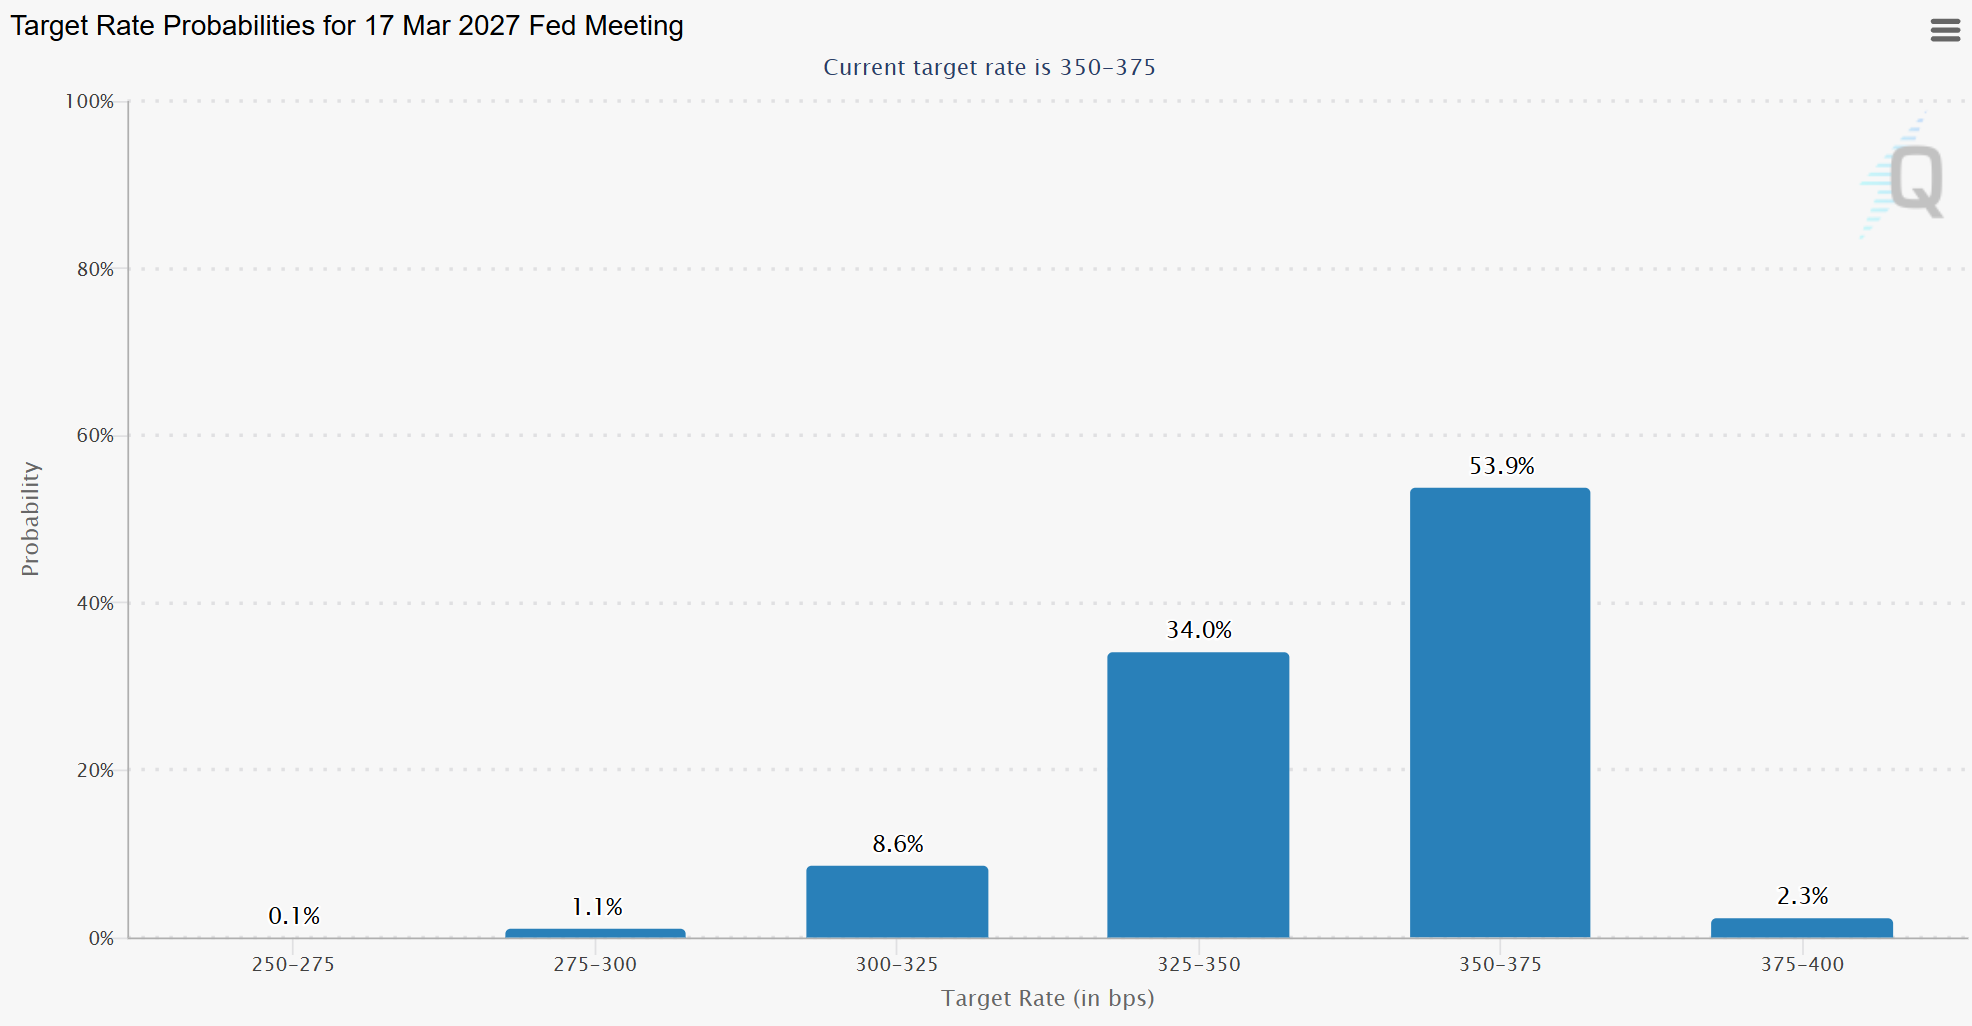
Following the release of the FOMC statement and the SEP, traders immediately began pricing in that the Fed will hold rates for the next year. The odds priced in by Fed Funds futures for March 2027 now show the consensus that the current rate will still be the prevailing rate. A month ago, before the beginning of the U.S.-Iran War and the potential energy shock, and before this statement, the odds were as low as 4%. The previous consensus was at a total 50-75 bp reduction by this time next year (2-3 normal cuts). Those are both now priced at sub-10%, with three cuts priced at 1%.
Bonds Will Be the Police in 2026
The major takeaway for investors, beyond interest rates effectively being frozen for the remainder of the year, is coming from the bond market. Below is the yield curve from before and after the meeting, effectively plotting the yields of the various maturities of U.S. Treasuries. We can see how the market priced in the Fed’s announcement. The entire curve is lifting, and significantly for the Treasury bonds at the 2-5 year maturities compared to the rest of the curve, as it prices in the higher expected rates through 2028.
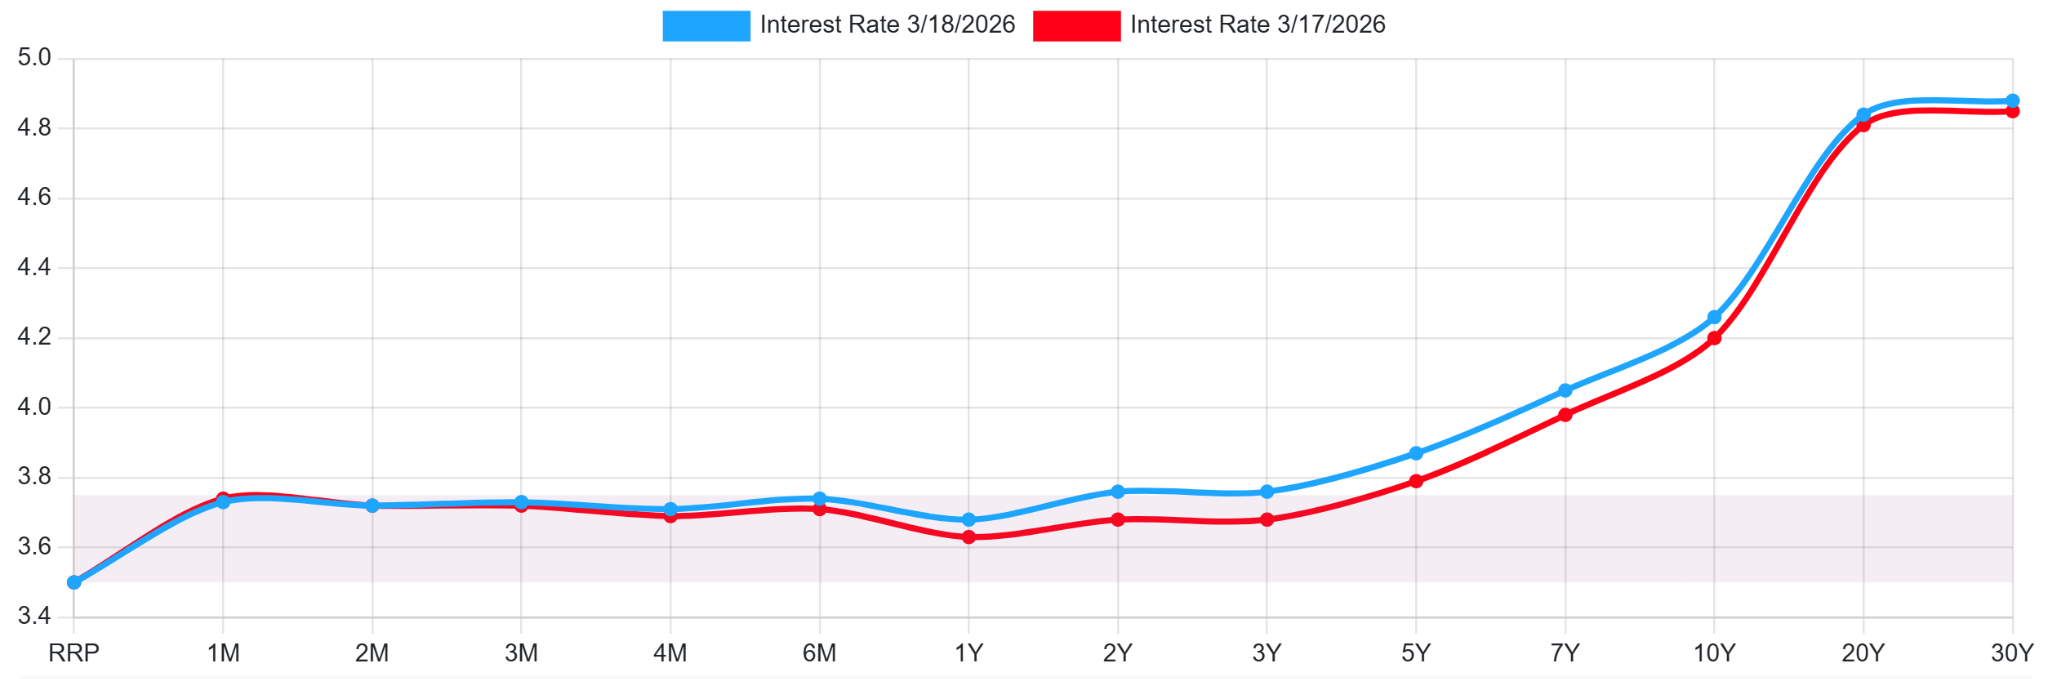
Bond yields are likely to remain elevated if the central rate does, and so the bond traders are pricing this news in. I expect treasuries to continue this path and for yields to go higher in the medium term on this change in direction from the Fed. Those with high duration exposure (20-30 year bonds) may be rightfully fearful that this trend gets worse and their bonds lose as yields rise further.
It’s not just the U.S. Treasury having these issues. Sovereign bonds across the First World are following similar patterns over the last year; the bond traders are the policemen, and they were asserting that higher for longer was coming before the Fed. Even as central bank rates fall across major developed economies, yields continue to rise through 2025, defying 175 bp in cuts at this point from the U.S. and more in the EU.
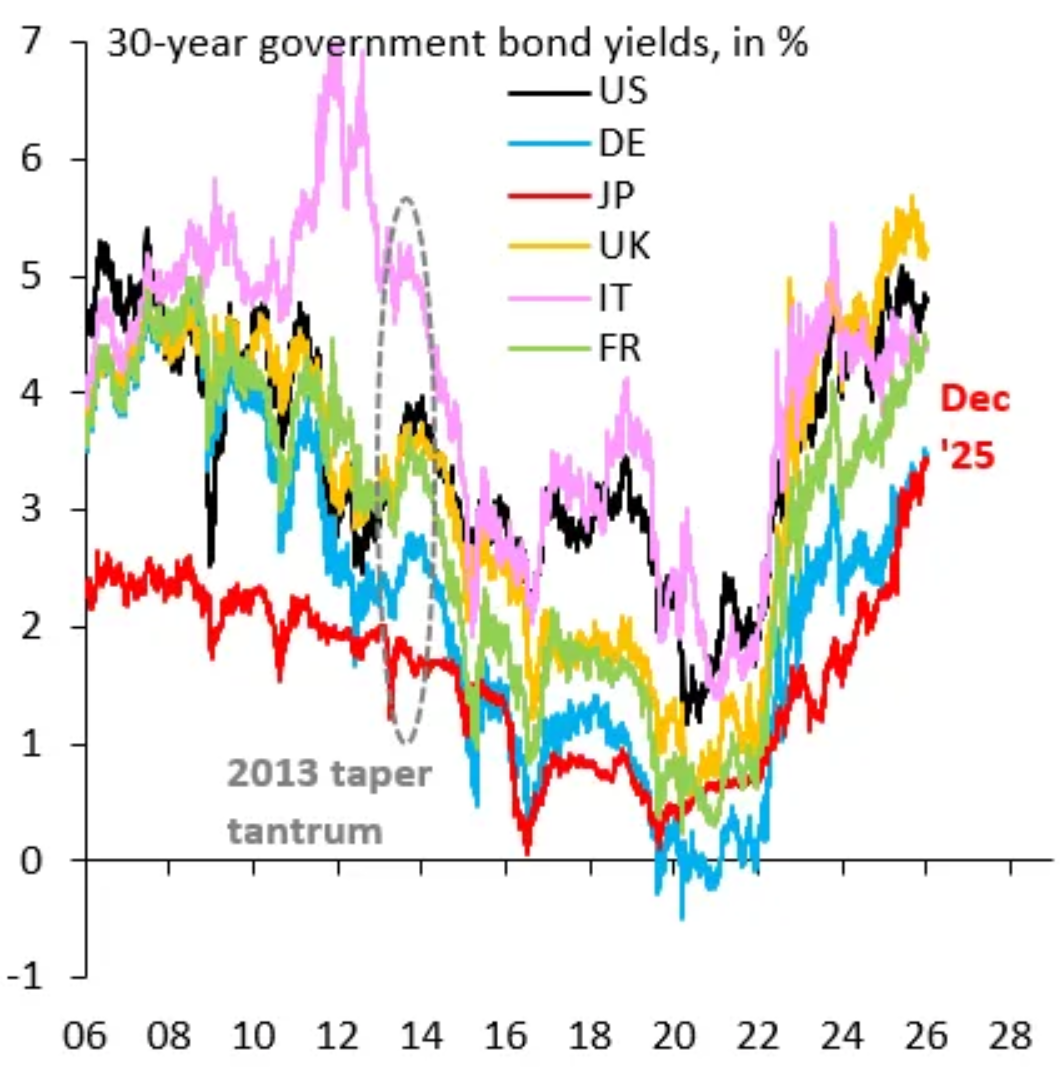
Higher yields drain liquidity and harm the economic conditions that drive risk assets. I expect bond traders to be keen on demanding higher yields if the Fed is quietly raising its consensus around how high rates will need to be as a standard.
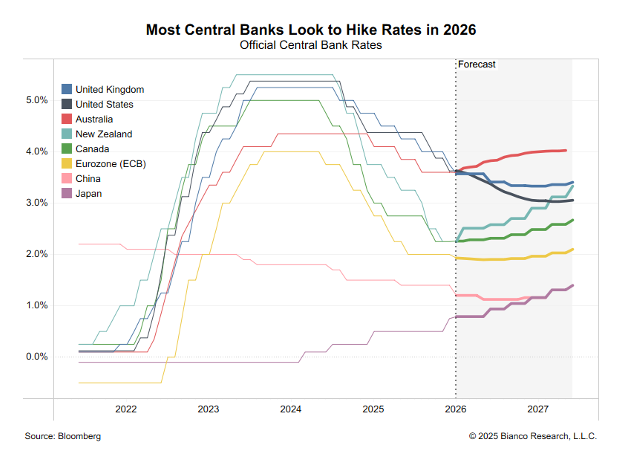
The Fed may not be alone. While they still anticipate rate cuts of some form in the upcoming years, even if it’s 25-50 bp at a max. Other central banks, like those of Australia, New Zealand, Canada, Japan, and even the Eurozone, are all forecasting hikes from their current rates over the next two years. This shift is moving quickly, and this chart is even outdated for the shift in U.S. posture that occurred the same day of writing this article.
Conclusion
The market, and bond traders in particular, spent the last year looking for the Fed pivot, but the newest projections show a Fed that is capitulating on its dovish ambitions. Ambitions are changing, and higher for longer is coming. Rates are not going to drop as previously expected, and we may not be at the terminal rate.
That leaves the bond market in charge; if the Fed Funds Rate stays in place, then the tail can wag the dog. Bond traders have spent the last year driving up long rates of First World sovereign bonds, demanding higher rates. They anticipated this change in tone from the Fed.
If the Fed is inching its long-run assumptions upward, then Treasury yields do not need fresh inflation to keep pressing higher. They only require investors to accept that the old floor under rates has moved up. That is the real message here, and it is the one risk asset investors should not ignore. Higher yields are not just a headache for duration investors. They are a tightening mechanism, draining liquidity, raising the risk-free rate, and forcing every other asset class to reprice around a more expensive cost of capital. The dot plot may have looked dovish at first glance, but the fine print told a different story here. The Fed will keep rates higher for longer, and they’re starting to move like other central banks in the developed world already have: backtracking on a return to truly easy monetary policy.