


One of the cleanest trades to take is when a central bank draws lines. The Bank of Japan (“BOJ,” “Nichigin”) has one such line. It’s not official, but it’s been de facto in place for 30 years, and the yen is fast approaching it once again. The last time we approached here, in the summer of 2024, the intervention unwound a carry trade that sent shockwaves through global markets. With a history of recent enforcement and the line still in place, there’s a clear setup for trading the yen.
Government Bonds Put Pressure on the BOJ
The proximate cause of all the yen trouble is the Japanese government bond (“JGB”) market. The quick history is that after years of using negative interest rates to try to stimulate inflation in a sometimes deflationary Japanese economy, the BOJ is normalizing its yield curve. The supply shocks of 2022-2023 and the resulting global inflation crisis led to above-target inflation in Japan, which caused the BOJ to have to normalize its yield curve, and it did. Then the yen got weak, and in 2024, when the yen hit 160 to the dollar, the BOJ stepped in to defend, as promised.
The bond market has moved faster than the BOJ intended, and policy uncertainty around whether yield curve normalization continues or stalls has done the opposite. It’s weakened the yen as traders hedge against a reversal. The BOJ’s two levers are working against each other. Bond policy is pushing the yen down; FX intervention is the only tool left to pull it back up. At 159 and climbing, another round of intervention looks imminent. The Japanese foreign currency reserves are sitting at $1.18T in USD, so Nichigin has more than enough ammunition to take care of any intervention necessary. Their largest intervention in 2024 cost $38B (~5.9T yen) for comparison.
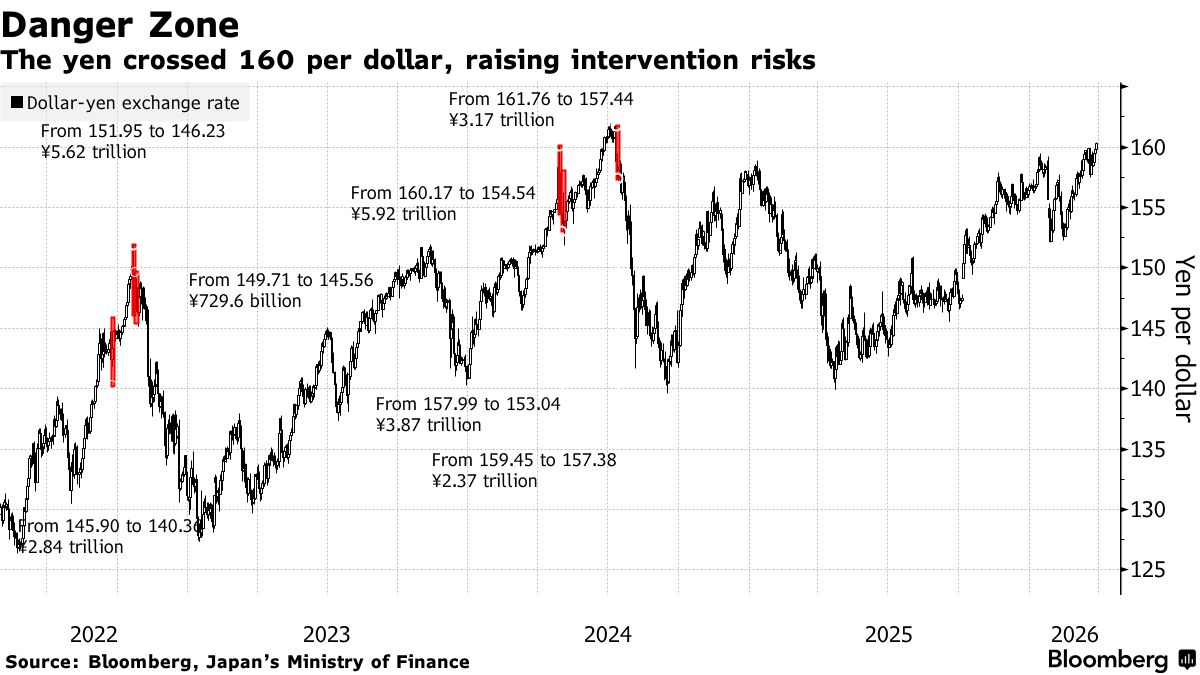
After the interventions, the yen traded around political news for a cycle as elections took place. At first, bonds took a breather, largely due to the pressure from traders grabbing higher yields. But then demand softened, and yields have been screaming higher since. The ascent has caused tremendous unrealized losses for carry traders and is reaching a critical point not seen in three decades.
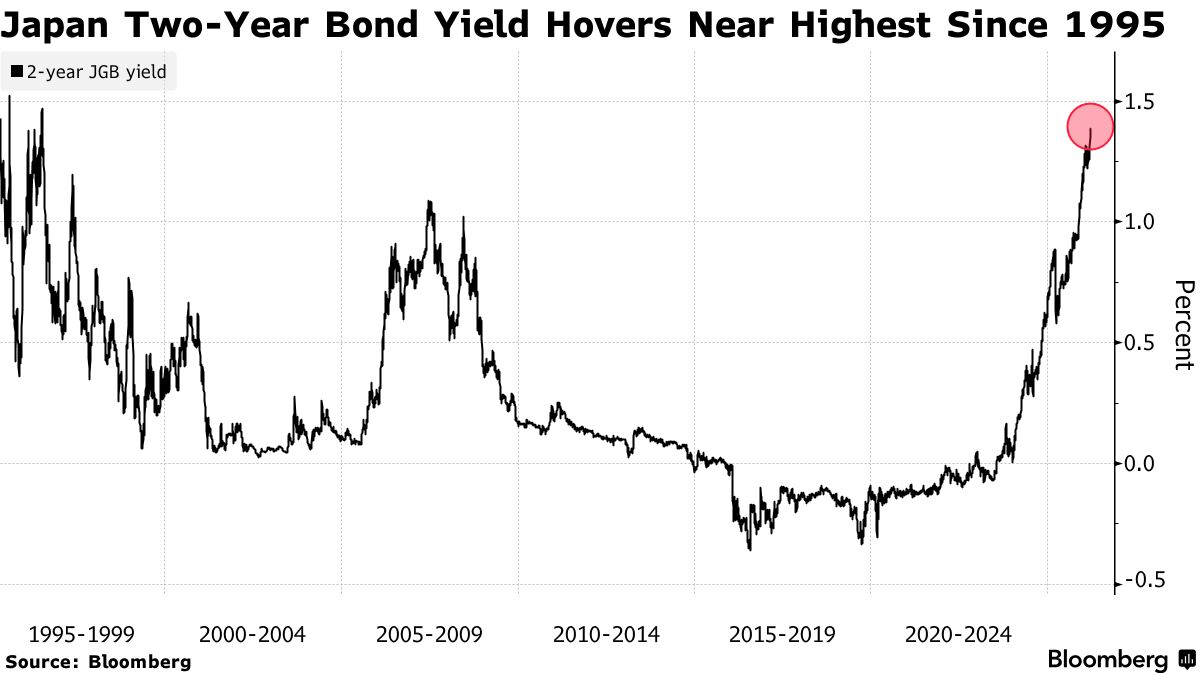
While the 2-year JGB yield is looking relatively high compared to its past, consider that the nominal yield is still under 1.5%, while an equivalent two-year US Treasury bond is yielding 3.82%. That gap is wide enough to keep the carry trade alive, as traders can borrow cheaply in yen and park the proceeds in dollars at nearly 250 basis points more; they will. Rising JGB yields are narrowing the spread, so the yen stays under pressure regardless of what the BOJ does on the bond side.
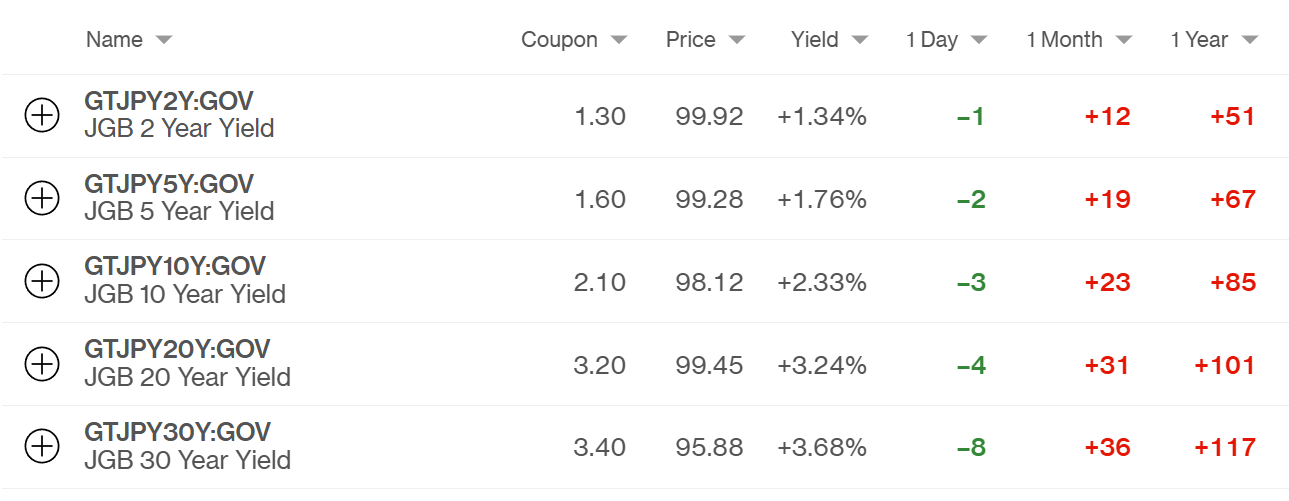
The two-year has moved considerably, but so has the whole curve. The 12-month moves on the longer-dated JGBs are even more extreme, with the 30-year bond up 117 basis points, now at 3.68%.
The current rate set by the BOJ is 0.5%, the highest since 2008. Their stance is currently mixed, with the looming energy crisis hurting Asian countries in particular, but they were hawkish before the outbreak of war and discussing the raising of interest rates.
Central bankers at Nichigin have mixed outlooks on rates, and the consensus on the long-term neutral rate is far from conclusive. The official estimate range is -0.9% to 1%, and the six models they use shoot between those but are mixed on whether the rate should be positive or negative.
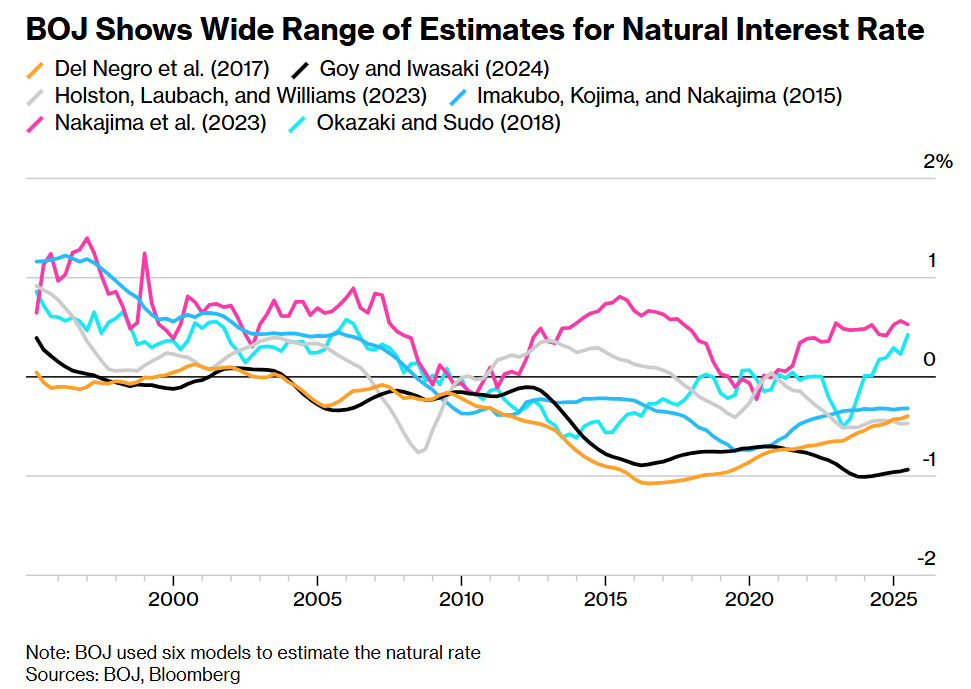
There should be a note for yen traders to watch this because higher rates invite higher bond rates and vice versa with lower rates, which affects the carry trade, and ultimately affects yen demand.
USD/JPY Price Forecast
Every new USD/JPY analysis as it publishes, today's technical signal and key levels, live price — on one page.
See all USD/JPY forecastsTechnicals vs. Policy is a Fight Policy Wins
The five-year weekly candle chart of USD/JPY tells this story for me. You can see the level we bounced off in July 2024, a high of 161.94, and how we’ve been respecting that level since. We are still in an overall downtrend for the yen, and all moving averages are trending up, as is the anchored VWAP.
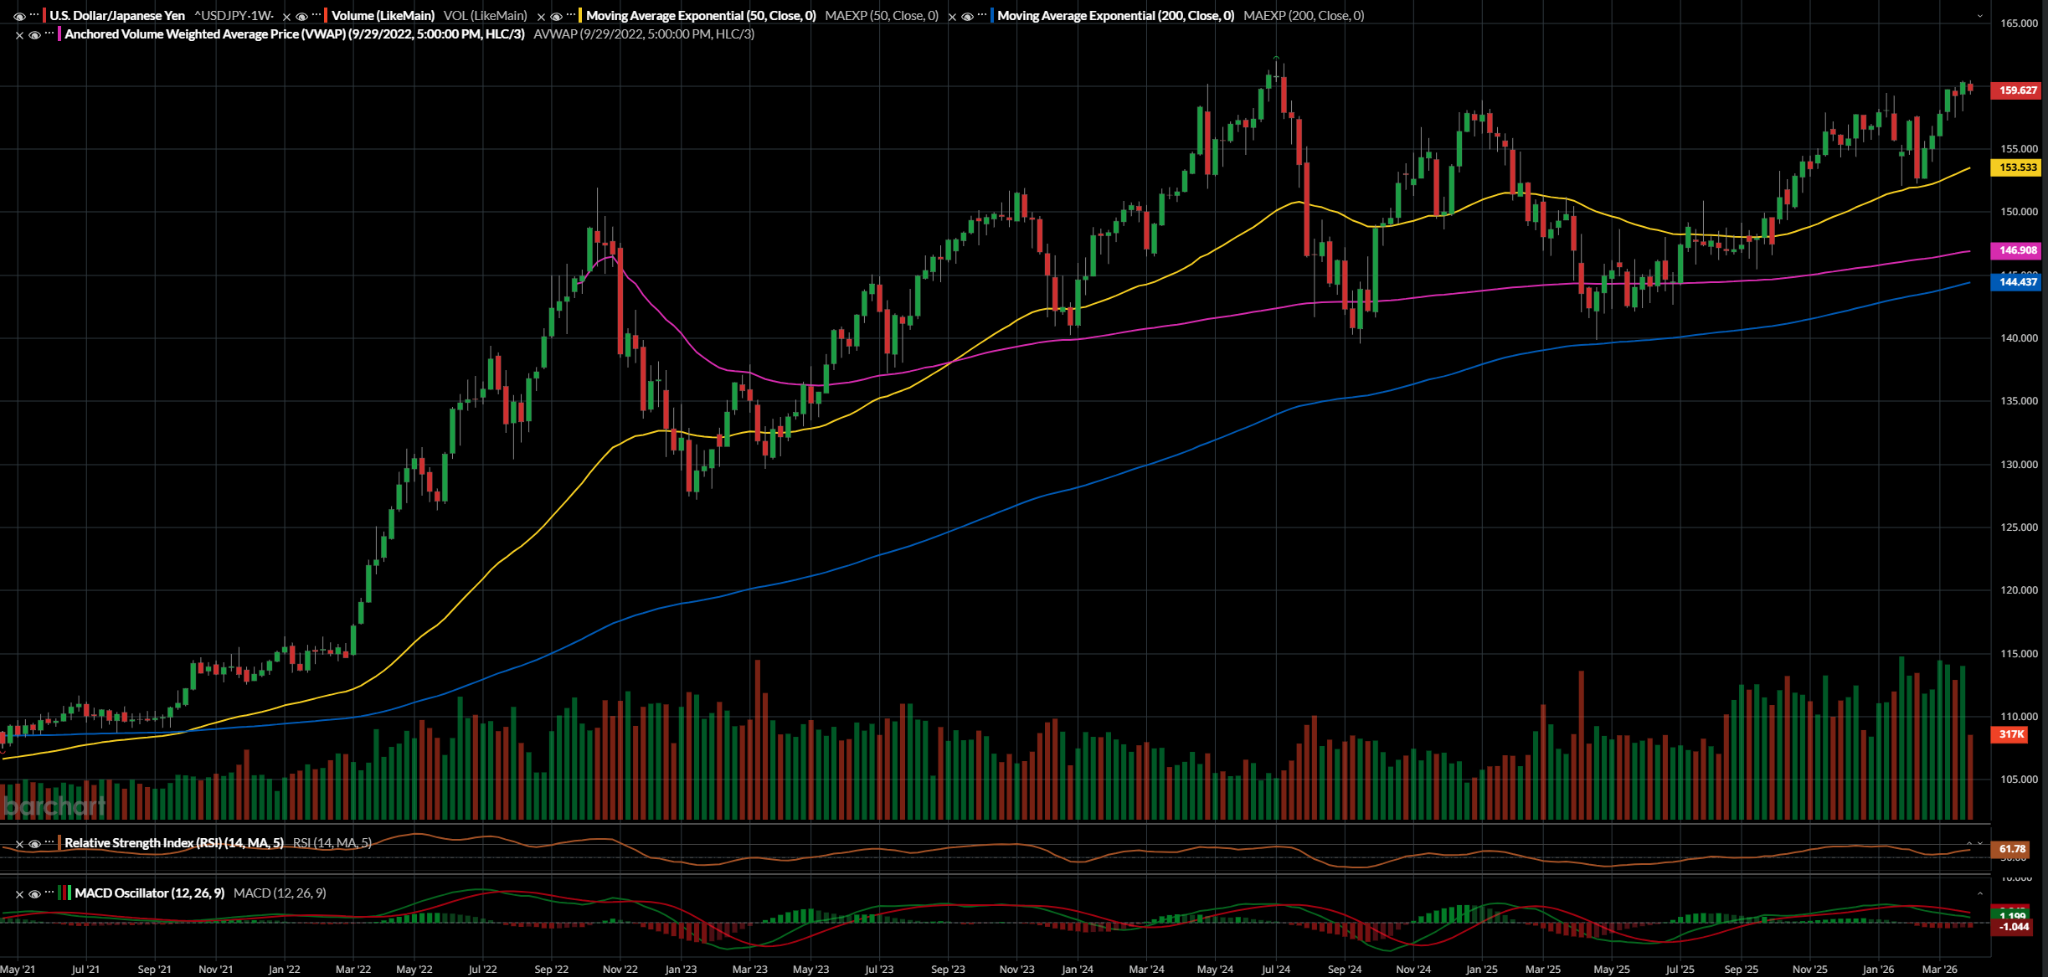
Note that it is absolutely a risk to make any assumption in investing, but given the history, willingness, and available resources to defend the yen, I expect that Nichigin will hold the 160 line and that the yen will not meaningfully break above its old high at 162. If I am wrong, the yen could go far higher. We’ve never seen anything else, and the parabolic structure from the last couple of years will thin out quickly after the initial volatility from policy change from intervention to not.
The central bank ceiling means that we’re effectively at a hard resistance that will be respected. We could trade around this level, ~159, for some time, but I expect that we won’t meaningfully break above 160. So taking a position around these levels would make sense for bears.
A timing signal for validation that the trade is on would require the bank to actually intervene or at least for the market to expect it to intervene. Since the market is forward-looking, we only need expectations of intervention to rise, not necessarily intervention itself to happen. This could be because of a speech a central banker gives or a policy statement, but most likely it would be at the next BOJ meeting in late April.
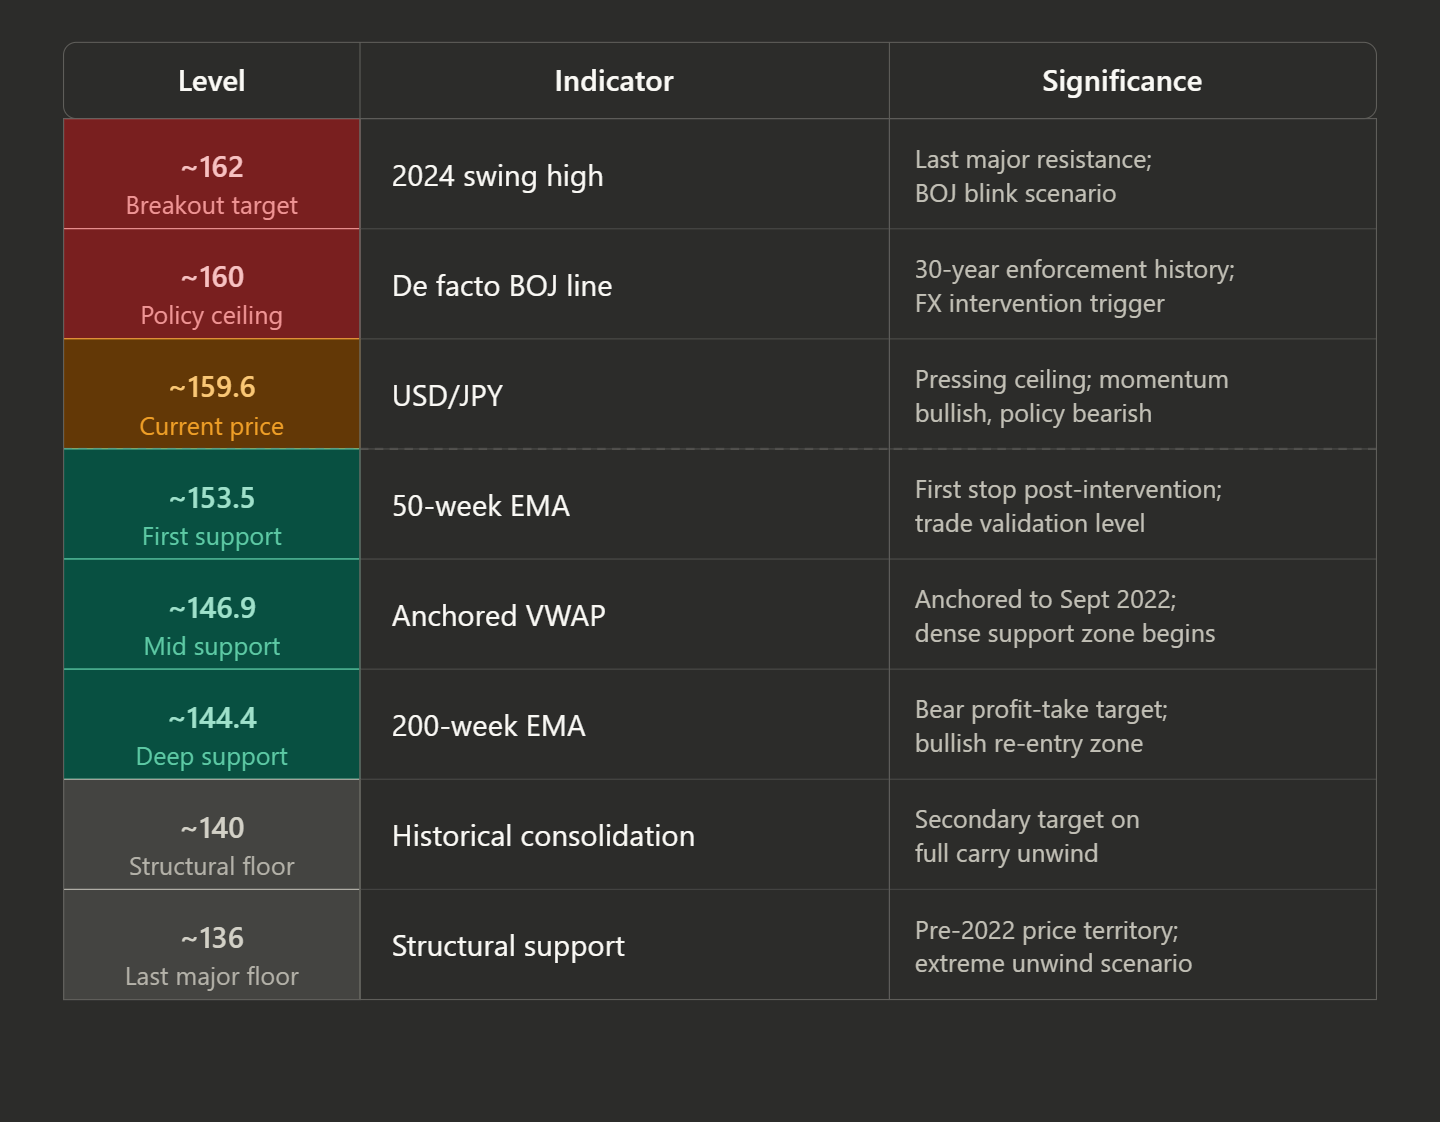
That gives time for the price to move lower and respect the line in the sand, but I am expecting it to stay range-bound until then. Should prices fall, we can expect the first major resistance to come at ~153, the 50-day EMA. Below that, the anchored VWAP sits at ~147, and the 200-day EMA is shortly behind it at ~144.
That is a dense level of support, and I would expect the bearish take profit to be set just above those levels, with breaking below the 50-day EMA at ~153 be considered validation for the trade. I don’t expect us to meaningfully break below ~145 so long as JGB bond yields stay elevated and BOJ policy trends hawkish. But changing both of those things will take significant time, and so this support level may hold for a while.
If we do reach 145 in the upcoming months and retest the 200-day EMA, I would be interested in taking a bullish position against the dollar. But were that level not to hold, there’s structural support at ~140 and then ~136 following that.
Conclusion
The yen trade is rare in that it comes with a referee, the Bank of Japan, which defends a hard line in the sand. As we approach that line, technicals must respect policy. So what we have looks like a one-sided chart, but that makes it ripe for taking a bearish position. What’s unknown is how long the BOJ will tolerate the yen sitting at the current level and how much they are willing to deploy; in the past, the drop was 15 basis points, very considerable.
Bears have a well-defined entry here, a clear invalidation above 162, and a dense support cluster between 144 and 147 as their target. That’s a tradeable setup. The BOJ is effectively handing it to us, but knowing where the ceiling is doesn’t mean that you can time the drop.
Take positions tactically here and make sure that if the dollar continues to strengthen and reverse some of its weakness from last year, you’re not caught holding an outsized position at a time when the BOJ could blink—a blink that would be disastrous for the yen.