


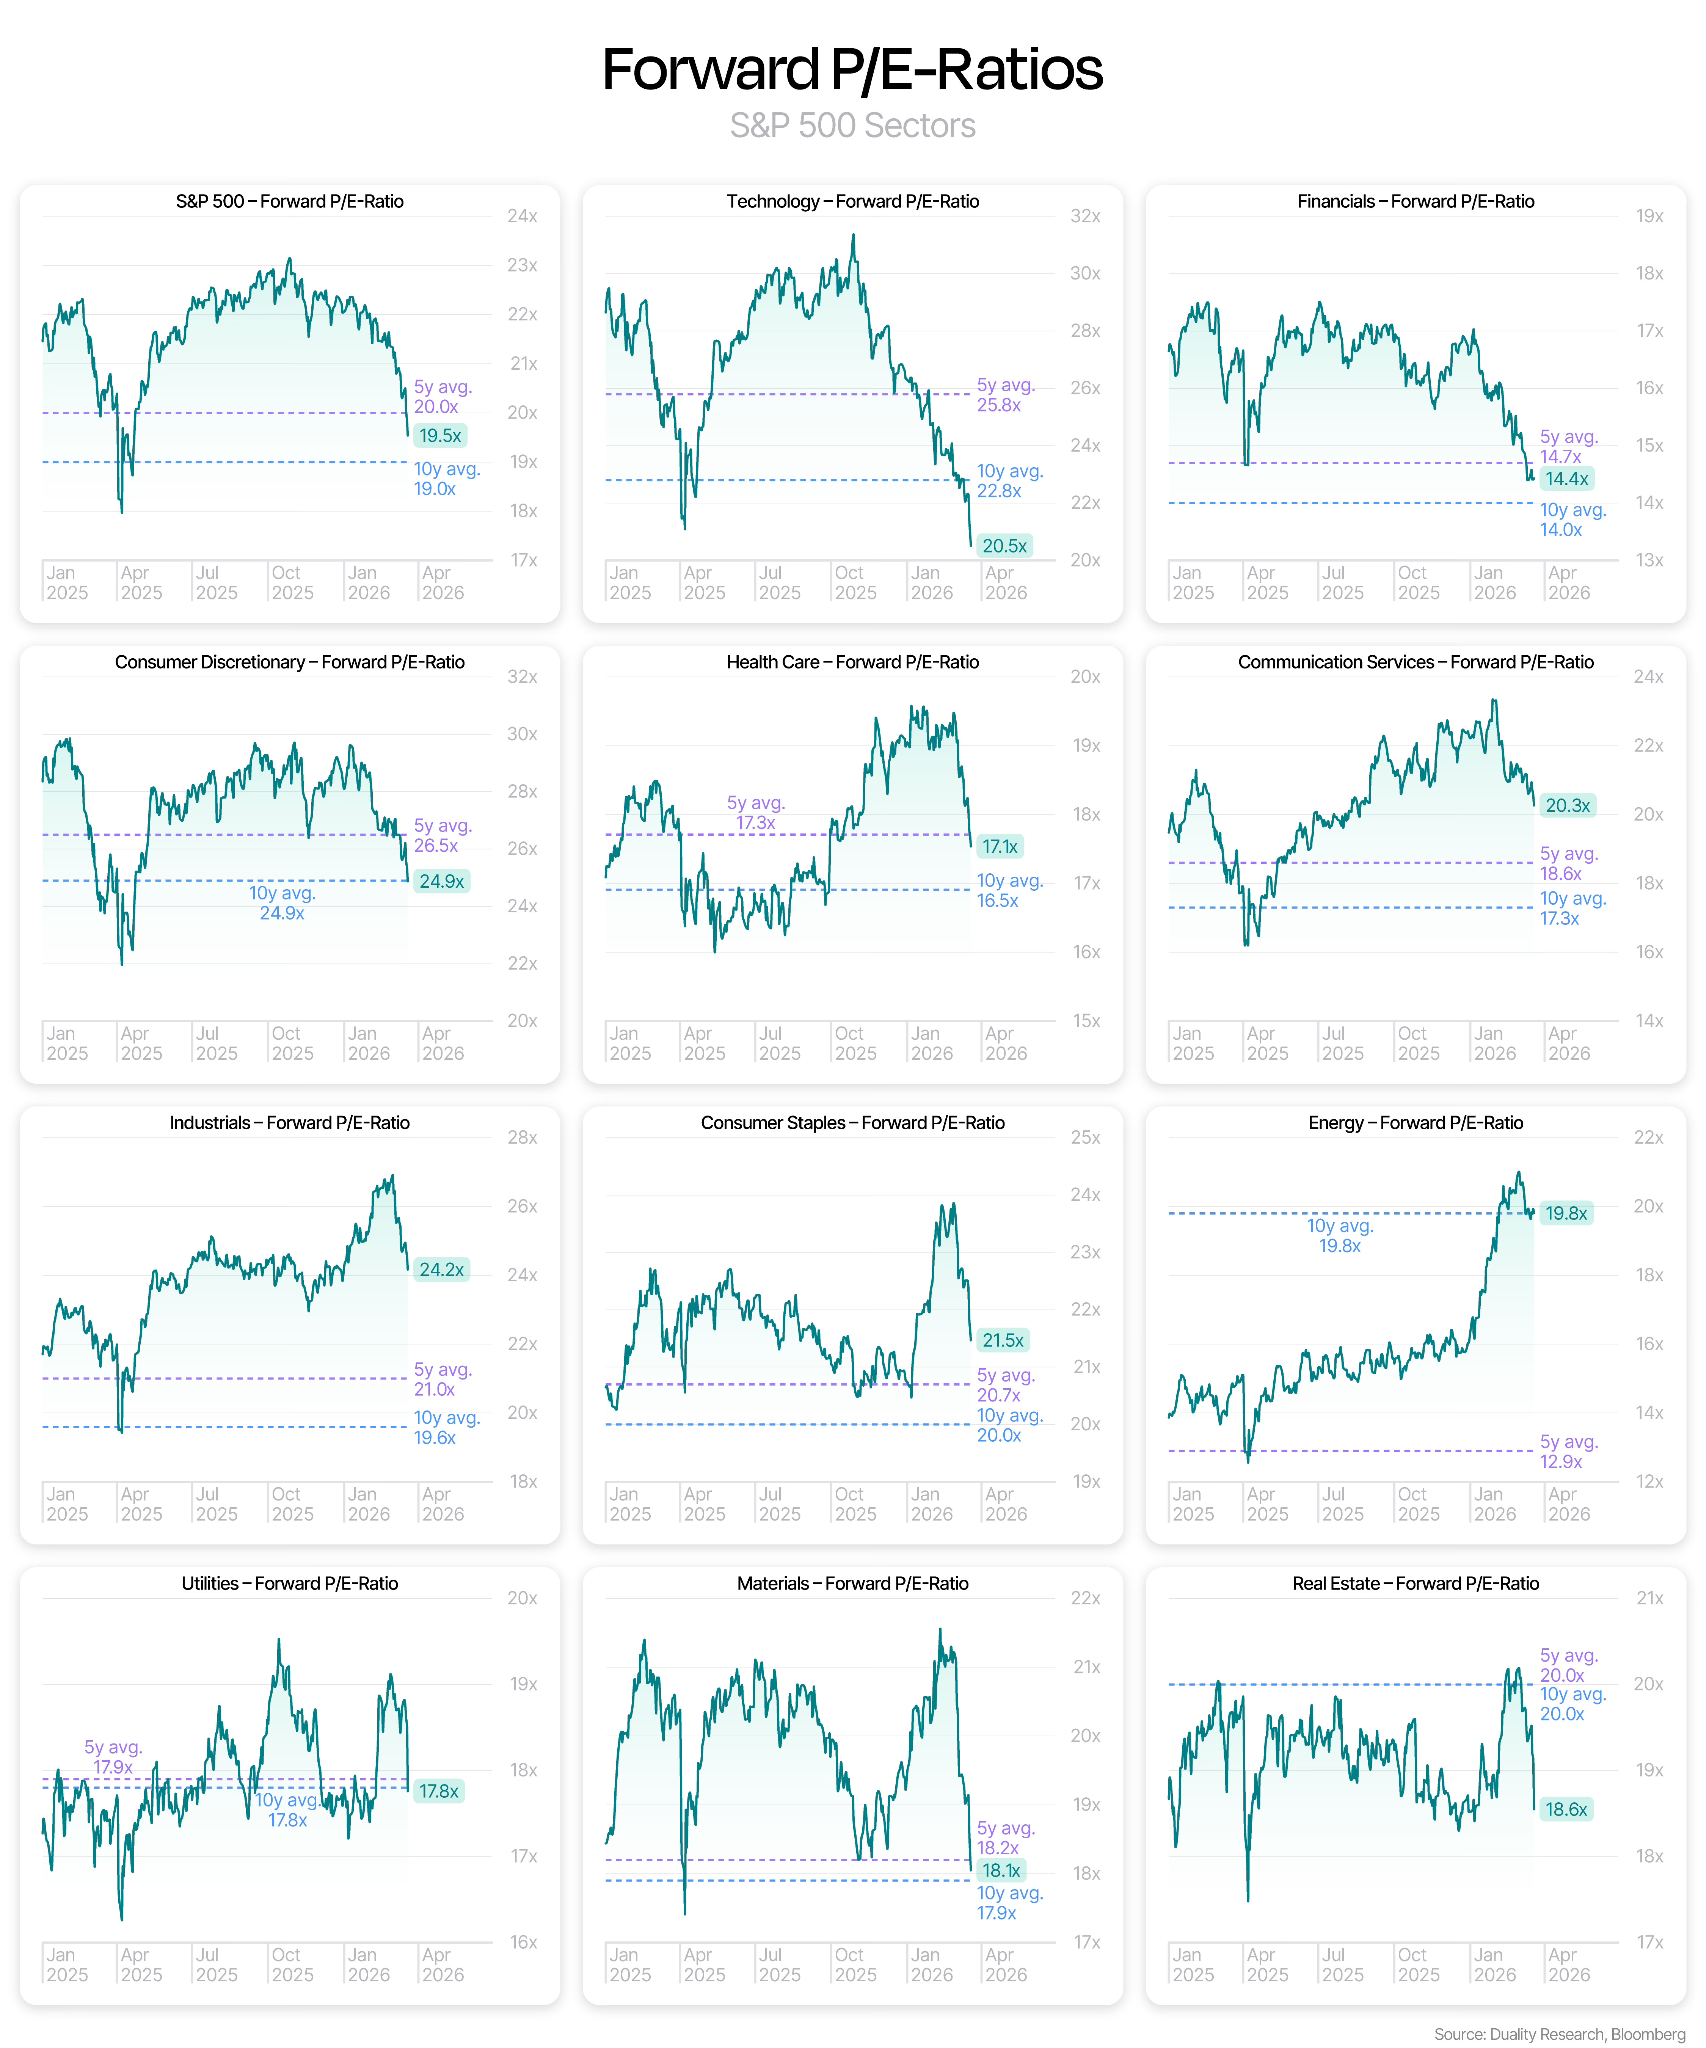
In this latest sell-off, all assets have been hit hard, barring the U.S. dollar (DXY). The entire market has repriced, with most sectors dropping several points in valuation. Tech stocks reprice from an average 31x earnings in October 2025 to 20.5x today, for an example of just how much we’ve moved in a short amount of time. That is a signal, among others, of opportunity. The market is already flashing oversold indicators galore, and so the question becomes, when the bullish rotation restarts, what will lead the way?
I’m trying not to understate the valuation meltdown. The market repricing has been brutal in March, as fears around the U.S.-Iran War and a looming energy crisis caused by the lack of ships transiting the Strait of Hormuz (too much fog of war to give a clear analysis of when or how that will be resolved) compound with the Fed’s signal that liquidity is tightening further.
The Market Is Oversold
There are many reasons to consider the market oversold that aren’t just the traditional technical metrics, although for the record, the S&P 500’s RSI(14) is below the oversold line as of the time of writing, down at ~23.
It’s more than just that, because being oversold on technicals alone isn’t enough to say the selling has peaked. Consider that there are a variety of things at play:
U.S. hedge funds are at their highest short exposure in years, aligning with past peaks. Once shorts hit too high of levels, funds have mandates to cover to maintain target exposure.
Options exposure is flashing peak hedging, with put delta exposure at levels higher than the peaks in 2020 and 2022. Peaks in put buying often align with market bottoms historically.
The call-put skew is at a relative peak, indicating that put costs are likely also peaking. The more expensive puts are, the more friction there is for the next person to hedge their position. It is a snowball that eventually creates so much friction—a peak like we are at now—that it snaps the chain and causes an unwind, i.e., profit taking and covering.
Passive flows have started to react, indicating that retail investors (the last to catch any wave) have just hit their sell buttons for the first time since the tariff tantrum in April 2025.
Few stocks are at their last highs, with less than 3% of S&P 500 stocks at both their 4-week and 52-week highs. Broad support is still present, with 43% of stocks above their 200-DMA.
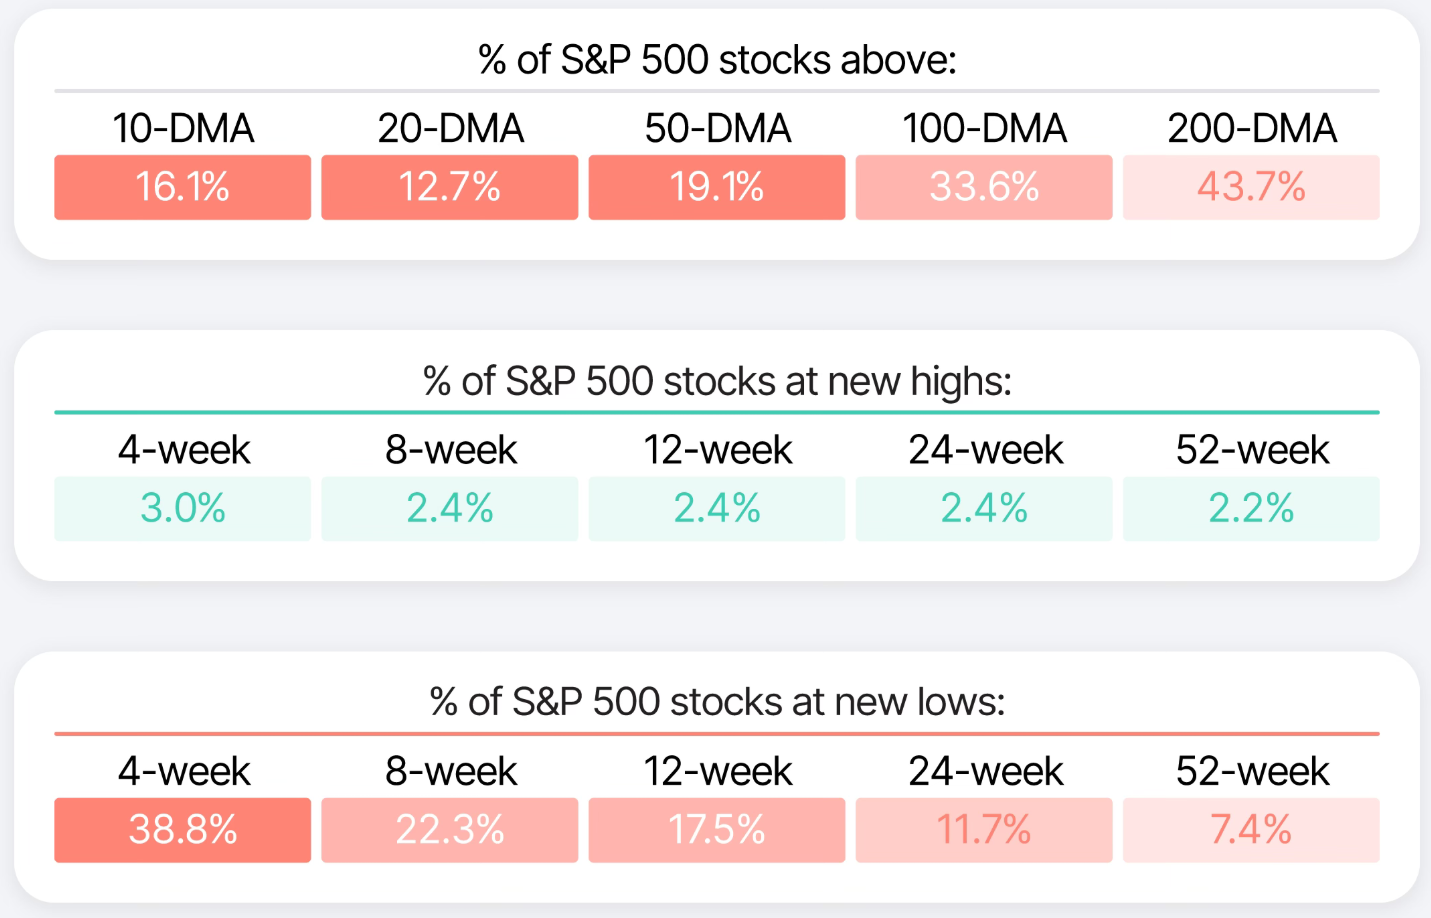
There are not only the conditions for the sellers to run out of steam very soon, but it is ripe for a violent correction back up. When everybody knows that everyone else is selling, but nobody knows when the selling will end—they just know that it eventually will—it creates a condition where buyers pile in very suddenly as the flip becomes clear. That’s why I’m buying now, but also why I’m being selective.
S&P 500 Price Forecast
Every new S&P 500 analysis as it publishes, today's technical signal and key levels, live price — on one page.
See all S&P 500 forecastsThe Two S&P 500 Sectors I’m Buying
My sector rotation strategy calls for an overweighting of several sectors at a time, chosen out of the total 11 based on their potential from a fundamental and technical perspective. Currently, I’m accumulating two of them.
Fundamentally, we can make two conclusions about our current market:
- Energy stocks are overbought, with buying pressure caused by speculators on the price of oil. It is the only sector performing well from a technical perspective for this reason, and so its technicals should be taken with a grain of salt. Be careful with energy and oil here, as the short oil trade is also crowded; I prefer to avoid this sector for now.
- A rotation back toward risk will be fueled by what has been fueling the bull run before now, increasing earnings among cyclical growth stocks. The proof? The sectors that have sold off YTD have all been experiencing multiple compression, not earnings loss.
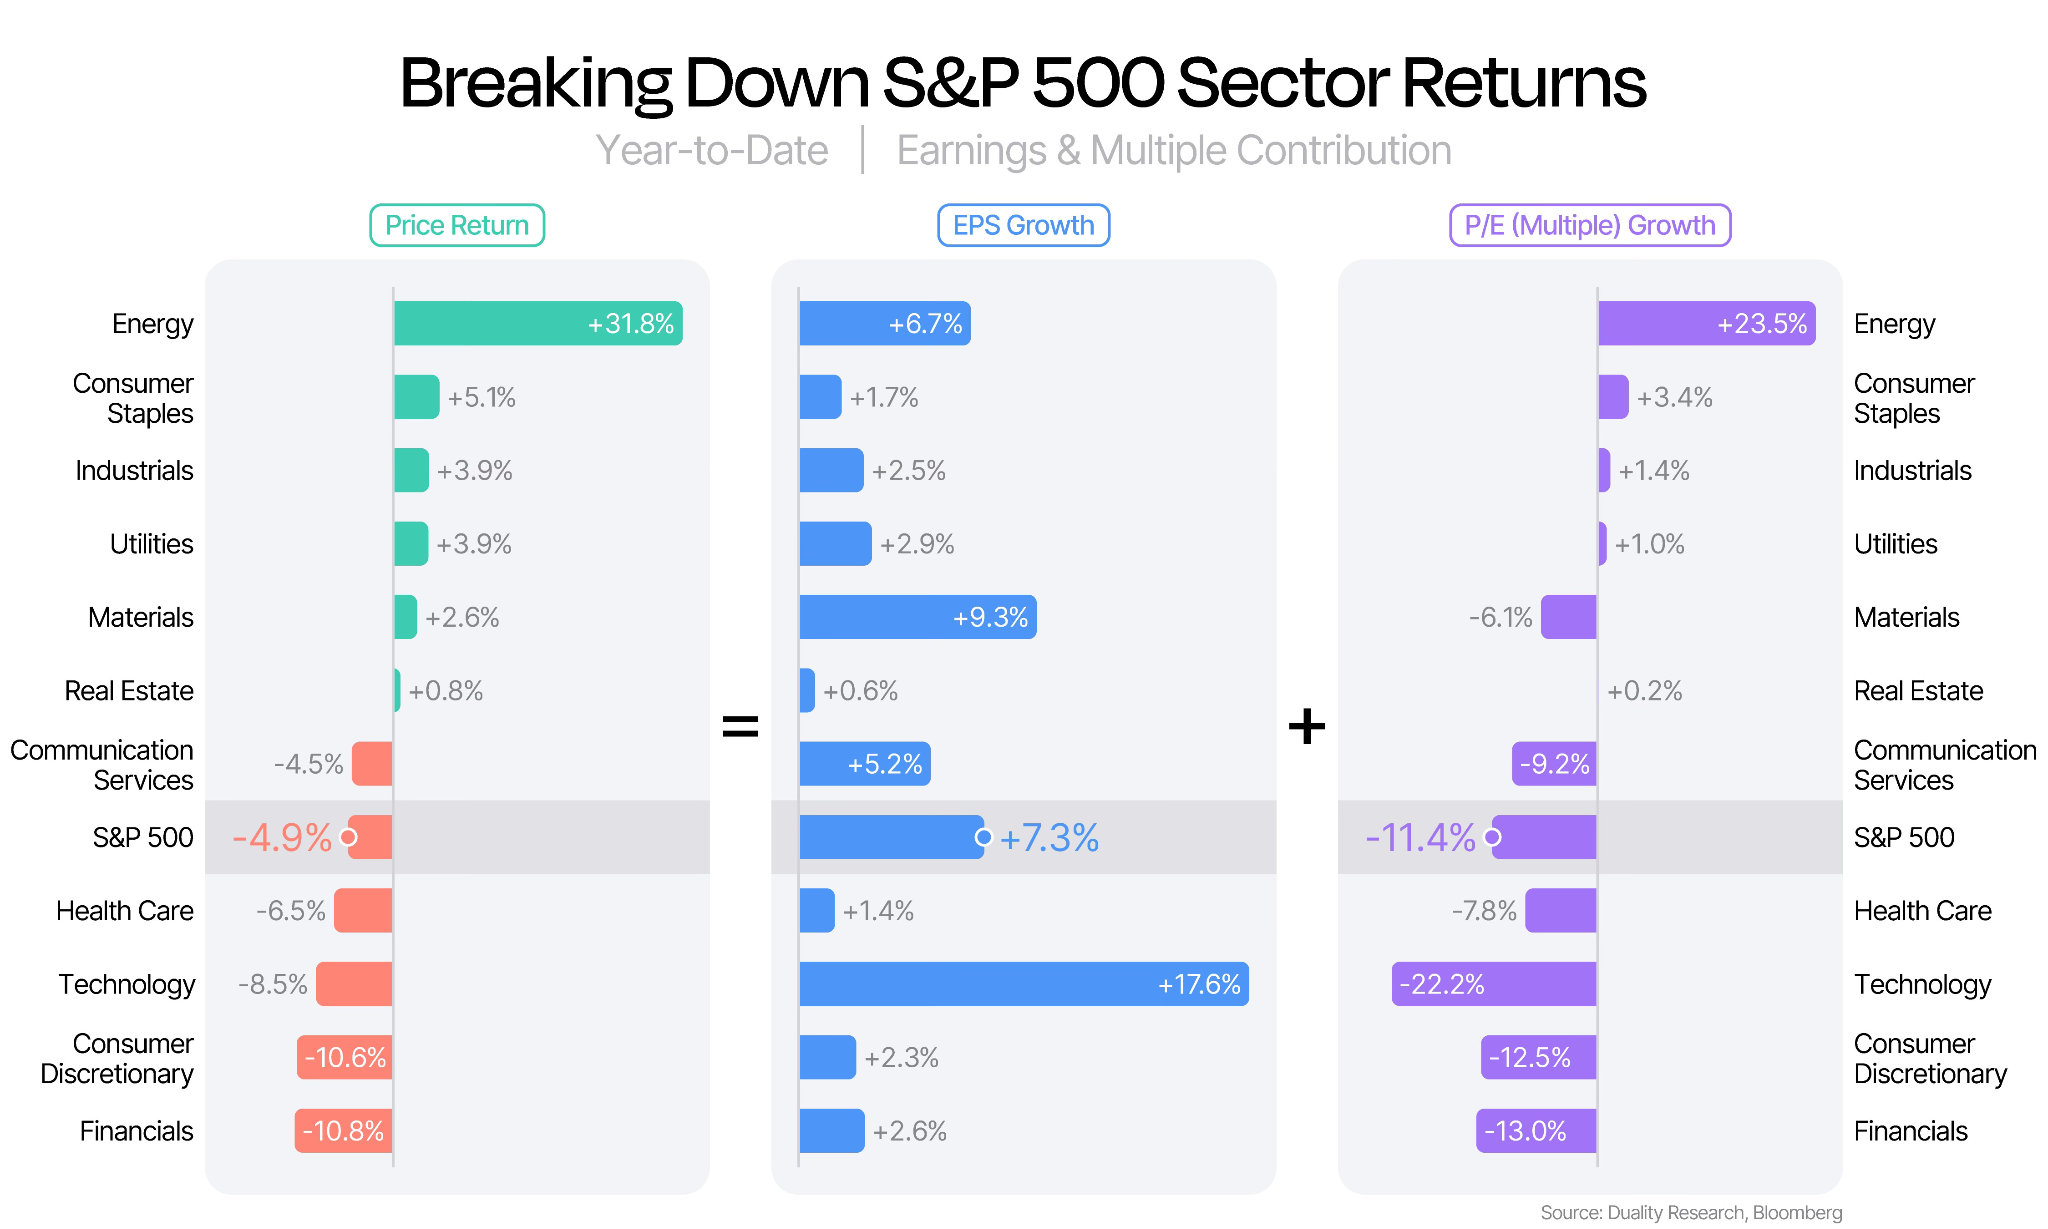
So if we’re excluding buying into energy at the current moment and buying growth cyclicals, our options are fairly straightforward: information technology (XLK), communications services (XLC), consumer discretionary (XLY), financials (XLF), and industrials (XLI).
A note on ETF selection: I’m using the SPDR ETF tickers for those since they are the most liquid sector funds, but consider that VanEck also offers these funds held at true S&P 500 index weights, unbound from SPDR’s weighting rules that limit exposure to the largest firms in the sector indexes. They only run a couple of these funds for now, but I expect more to come. Last year, they launched technology (TRUT), communications services (TRUC), and consumer discretionary (TRUD) funds. And good for us that they started with these sectors.
I expect risk-off conditions to be near their worst currently. We can always withstand another week or two of market pain, of course, but I don’t expect another 5% leg down anytime soon given the oversold conditions mentioned earlier.
So it’s natural that the risk-on sectors mentioned above should be screened for which have the best technical setups for a rebound. Currently, those are technology, comms, and discretionary.
Technology (XLK or TRUT)
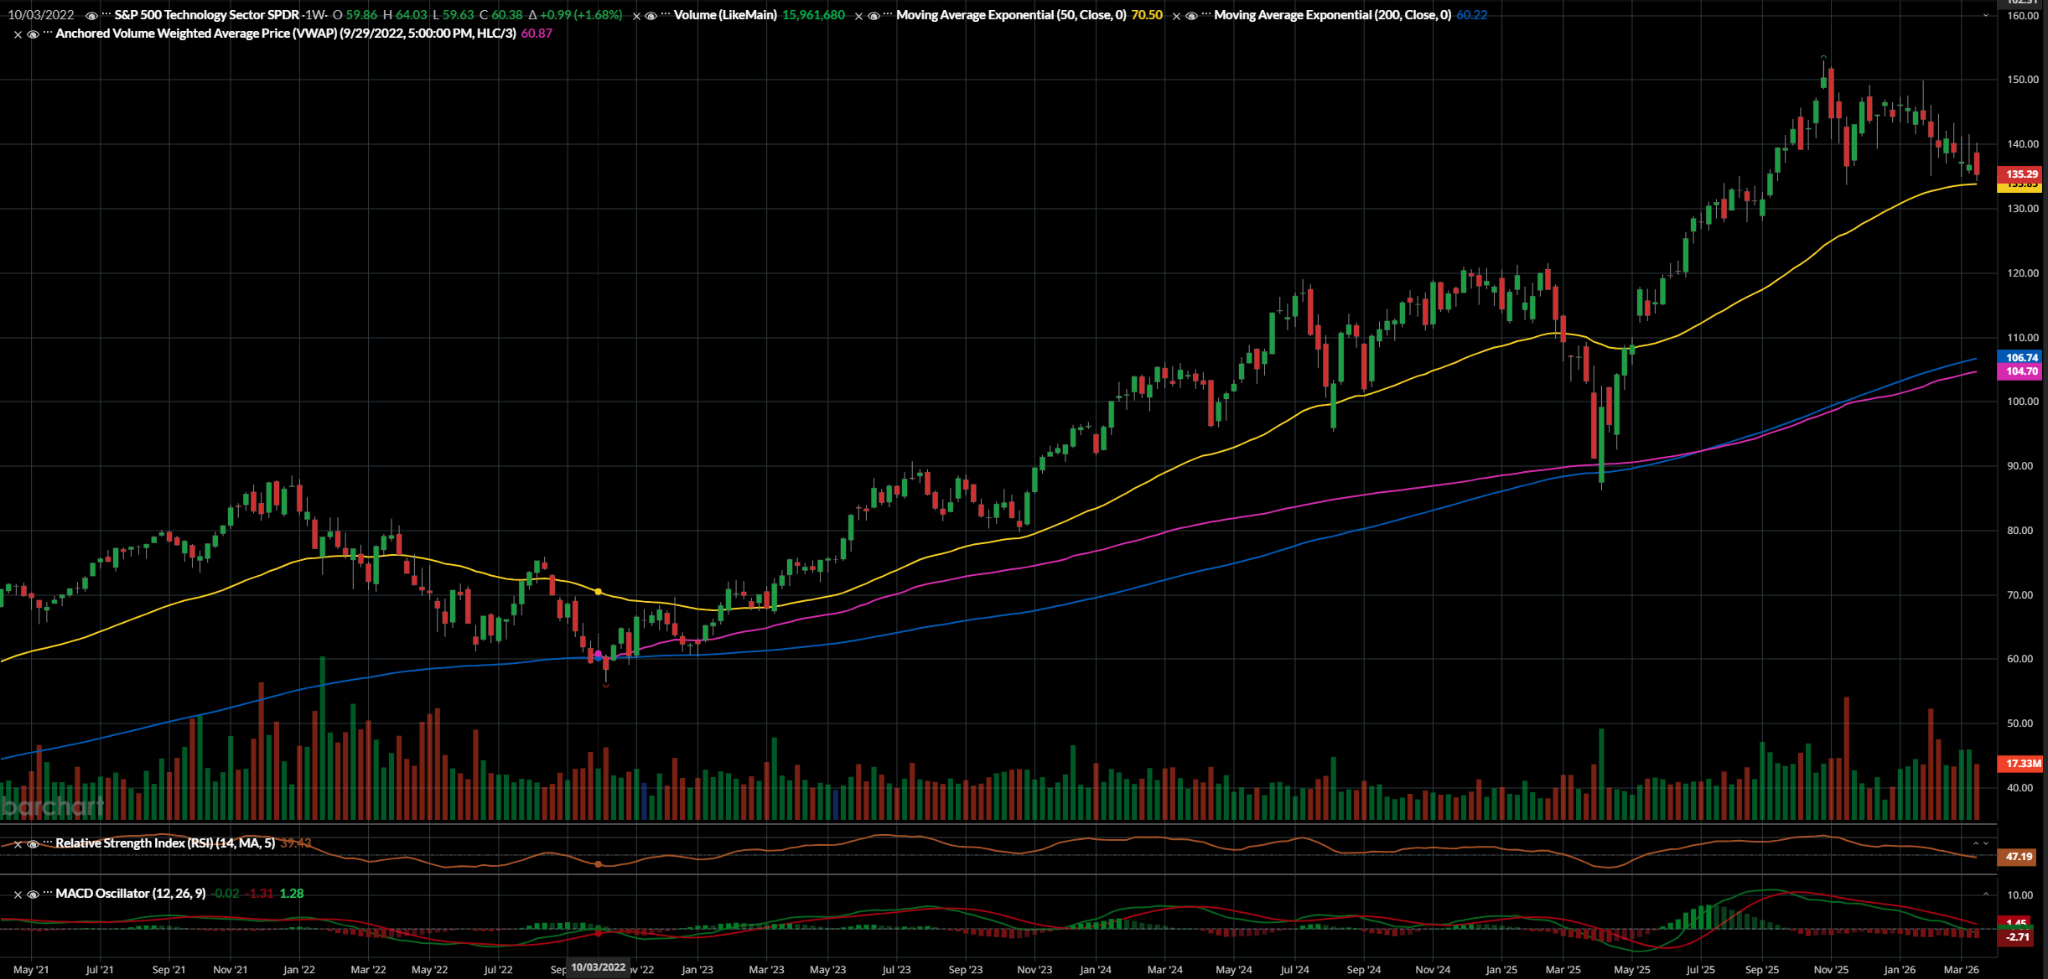
This chart is still telling me “higher.” Price is still in a clean uptrend with higher highs and higher lows still registering in the longer run. The recent pullback has hit the 50 EMA, which is acting as dynamic support. That is a classic bullish continuation pattern unfolding, which presents now as a buying opportunity.
Momentum-wise, the MACD cooled but could flip back quickly should the next weekly candle move up, and we do see a reversal of risk behavior as I expect.
If XLK’s price reclaims 140, that would be the buy signal. I would expect a continuation until the 150-155 zone and profit-taking above there, as it would be reaching new highs.
That may come quickly, as I expect the reversal to be violent, so consider that limits placed ahead of time may serve investors well here—this applies to all the funds I’m discussing here.
Communications Services (XLC or TRUC)
I always like to remind investors that this sector didn’t exist before 2018, and GICS split the technology sector to better track the difference between software/hardware firms and communications focused firms. So while many investors would consider Alphabet (GOOGL) and Meta (META) technology companies, and even part of “Big Tech,” they are not held by the technology funds. Instead, since 2018, they have been in the communications services fund.
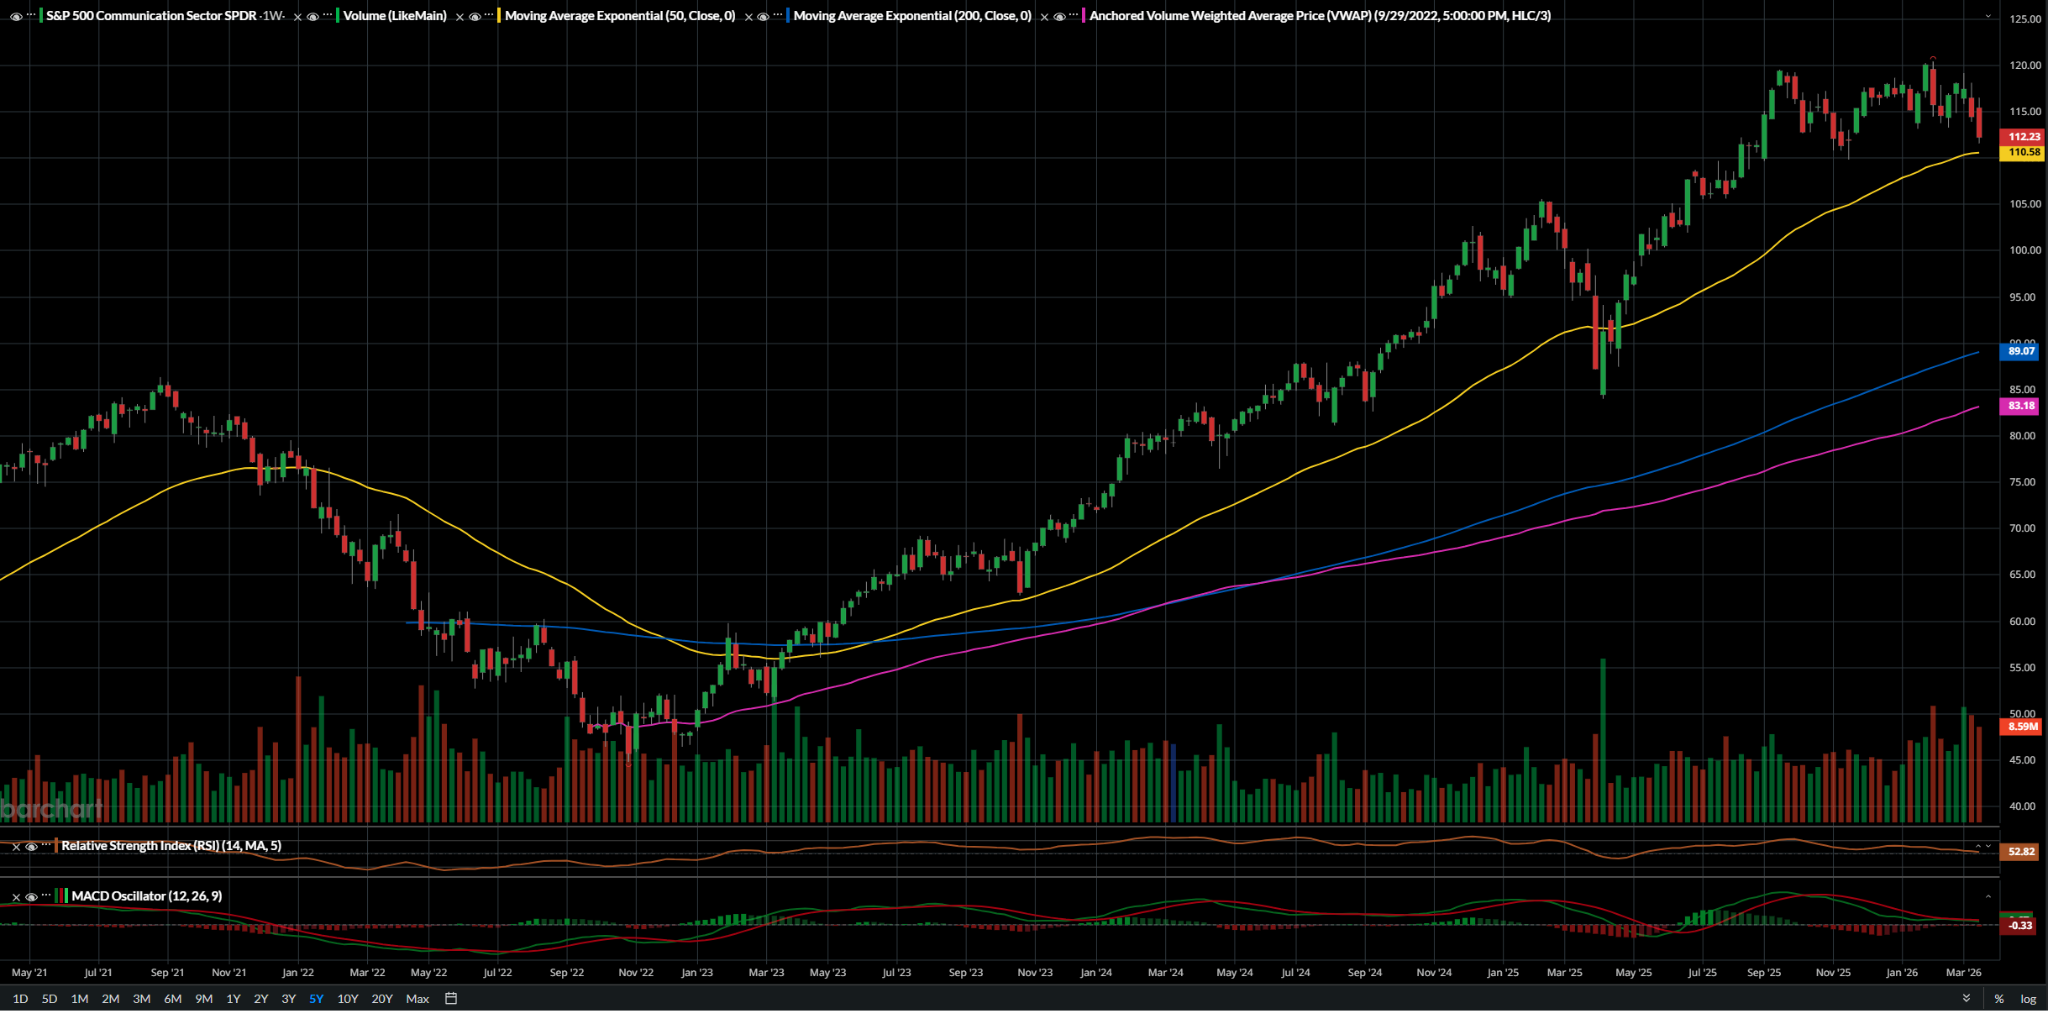
In the long-term chart, this is textbook bullish structure finding support. Like tech, the 50 EMA has been acting as dynamic support. Holding the 110-112 zone is critical, and a break above 116 would be the buy signal to run up back to the high at 120 and likely set a new high near 125.
A flattening MACD tells us that selling is abating, and buyers could step in to turn momentum back in XLC’s favor quickly.
Conclusion
We have a clear setup for a bottom in the S&P 500 given both fundamental and technical indicators. This is despite macroeconomic headwinds, although I believe we are close to or at “priced in” now, except for oil, as that is still in play. I expect any rebound to be violent and sudden, likely on news of de-escalating tensions in the Middle East.
In that case, cyclical stocks that benefit from growth expectations should excel. To that end, both technology and communications services are experiencing fundamental tailwinds like rising earnings and compressing multiples. At the same time, both stocks are approaching long-term support levels, where we should expect institutional buyers to step in as buyers and defend key levels.
Investors who want to catch the move ahead of time and are willing to take the short-term pain that may come before confirmation could buy in now, but otherwise, technical resistance levels sit at 140 for tech (XLK) and 116 for comms (XLC). Breaking these levels would confirm the bullish continuation. At that point, I would expect both to outperform the S&P 500.