


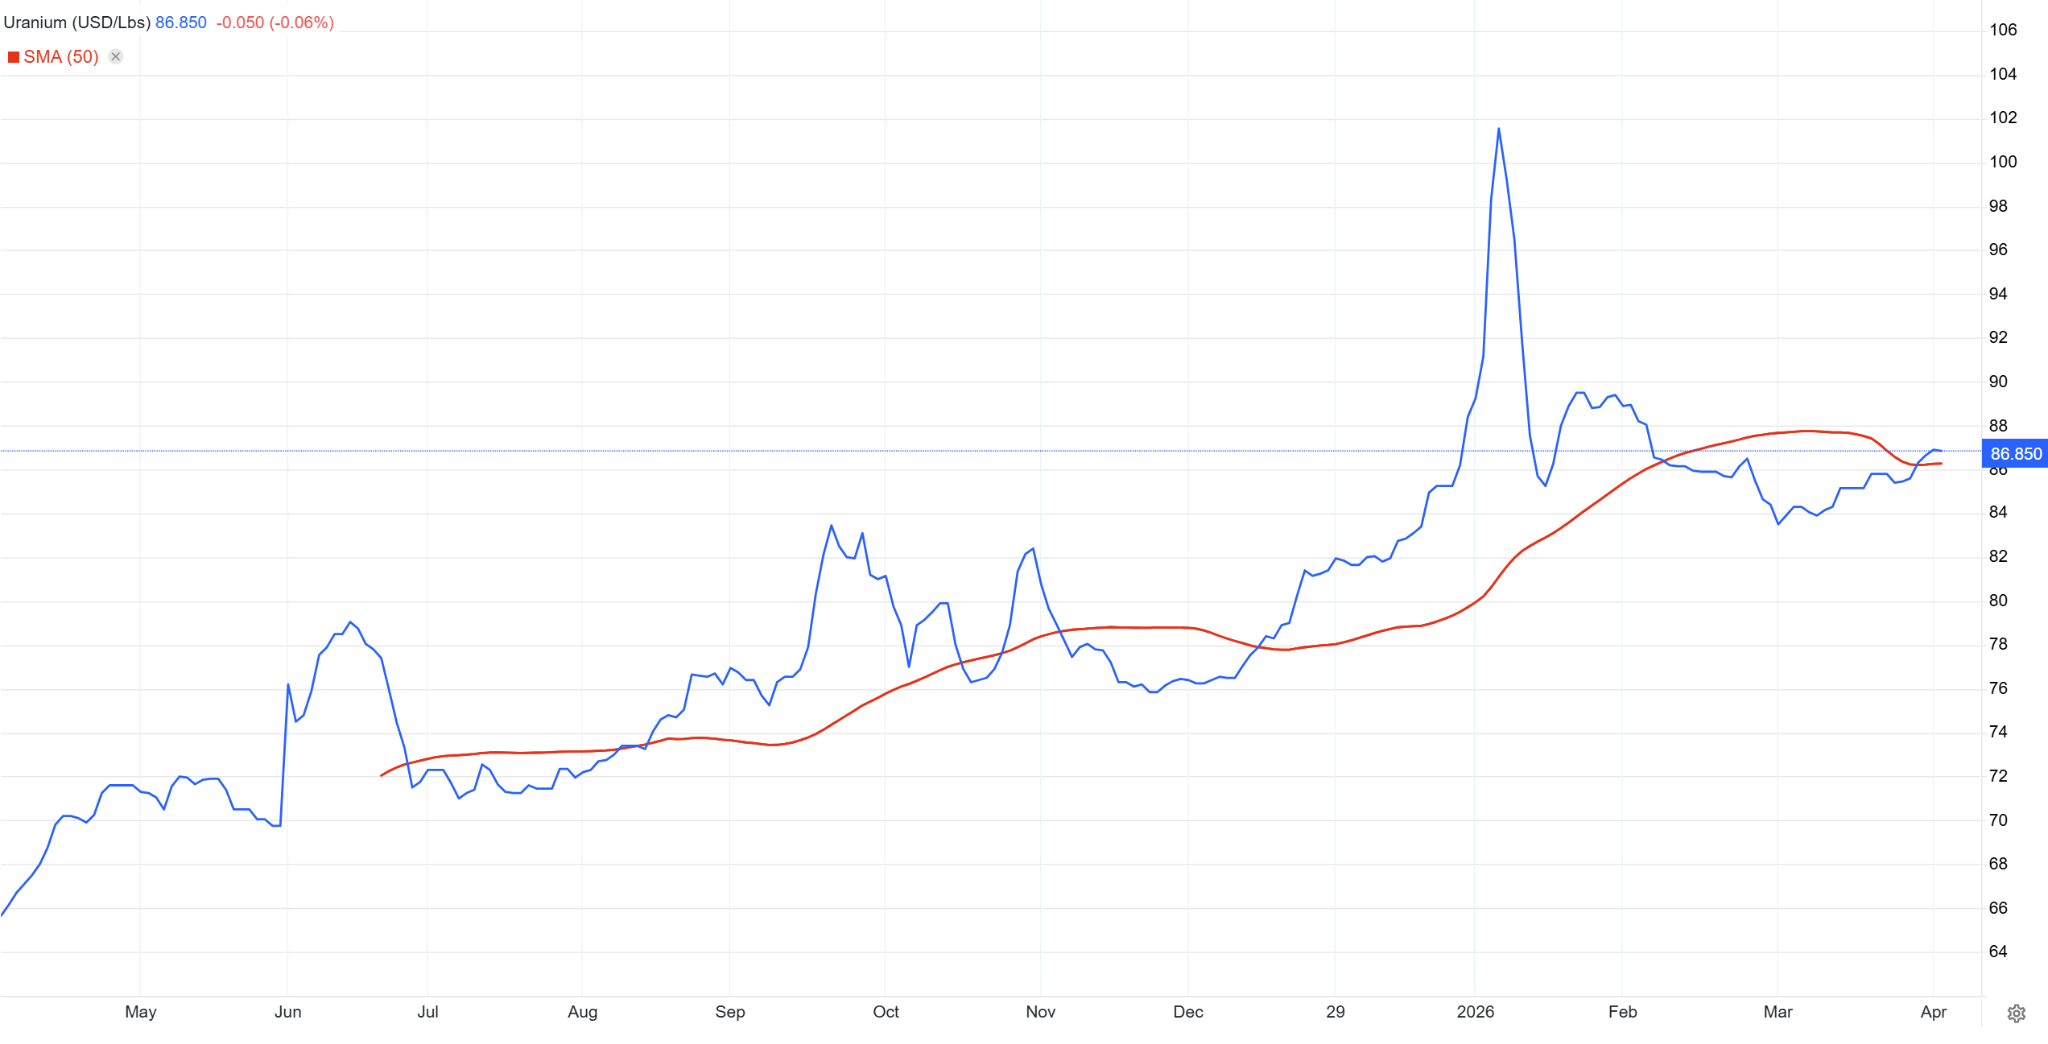
Uranium started 2026 on a tear, following a tremendous 2025. Spot U3O8 opened the year at ~$80/lb and ripped to $101.41 by January 29th, a new local high that finally seemed to validate what uranium bulls had been screaming about for two years: a structural supply deficit, nuclear power renaissance, hyperscaler power needs outstripping the existing grid, and a Russian enrichment cutoff that left the West scrambling. Then the U.S.-Iran war broke out, investors pivoted to safe havens, and spot tumbled to a low of ~83 in late March. It’s been chopping in the low-to-mid $80s ever since, sitting at ~$87/lb as of this writing; it’s not retesting a key support level and may be ready for another breakdown. The attempt at a breakout is now pulling back. That’s the setup I want to focus on, because the fundamental story underneath it is compelling enough to trap the bulls into chasing a move that the chart shows may not be ready yet.
The Bull Case Is Structural
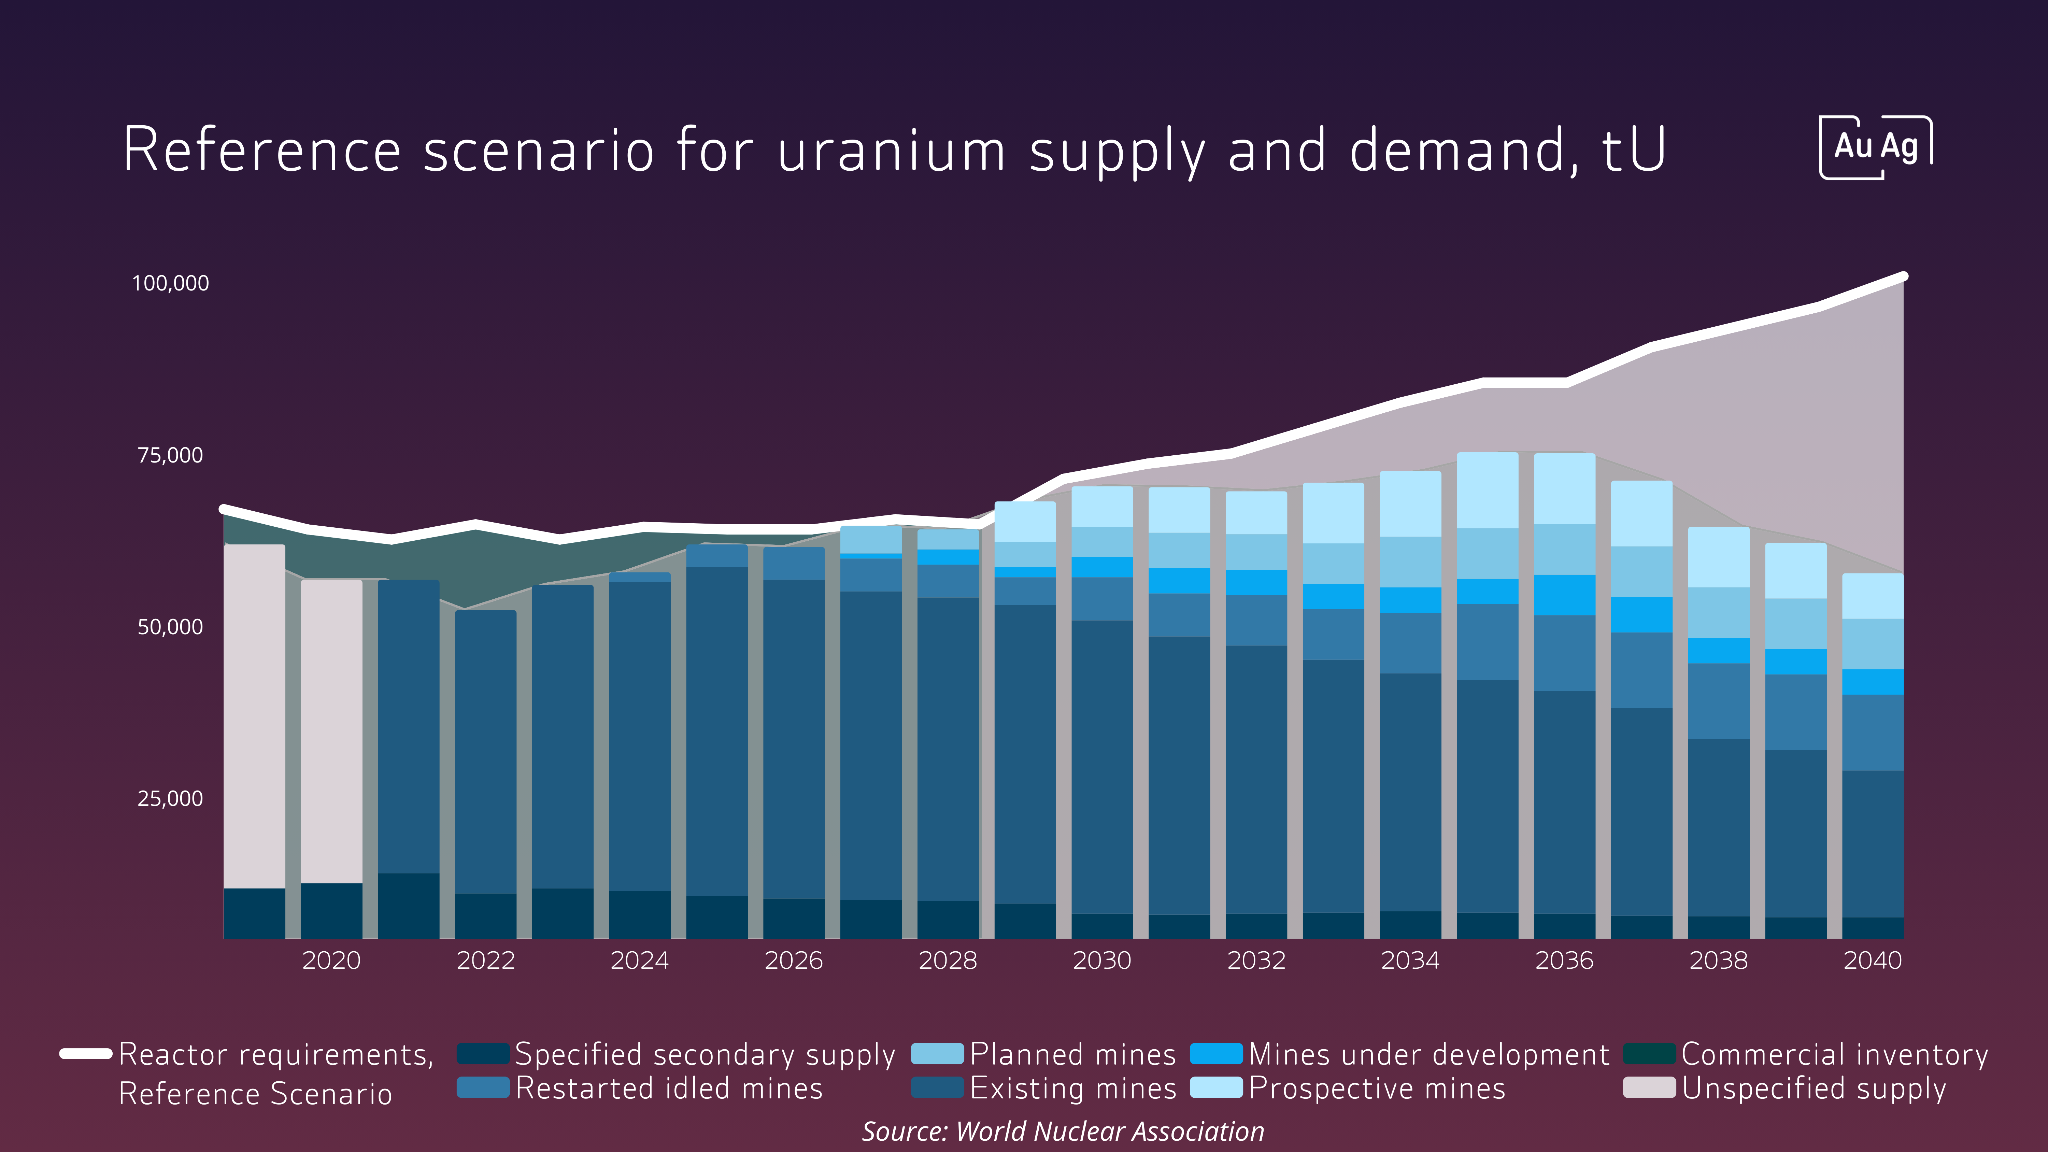
The bull case is built with a simple anatomy: we use and plan to use more uranium than we extract and plan to extract moving forward. Global reactor demand runs ~67,500 metric tons of uranium per year, and mine production has historically met only 74–90% of that. The deficit gets plugged with government stockpile drawdowns, recycled material, and secondary supply. These are finite sources that are now starting to run thin. The gap looks like it is only going to grow moving forward, at least by current estimates.
Demand is accelerating, and it’s coming from somewhere new in the last few years. Hyperscalers have figured out that the existing grid can’t cover their power draw demands for running data centers, so they’re turning to nuclear as one of the options to fill the gaps.
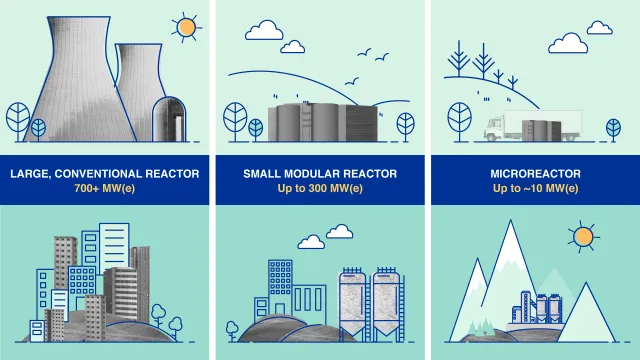
Amazon (AMZN), Google (GOOGL), and Oracle (ORCL) have all signed small modular reactor (SMR) contracts over the last eighteen months; Microsoft (MSFT) bought a decommissioned nuclear power plant, which they are having Constellation (CEG) operate. The hyperscalers are working to buy power from all kinds of nuclear reactors. Utility firms tend to operate the largest sites. Firms like NuScale Power (SMR) are working to build the mid-sized reactors, and firms like NANO Nuclear Energy (NNE) are working to build the smallest reactors, though most SMR and microreactor technology is very immature and the firms are unprofitable at this stage.
Policy has followed capital. The U.S. added uranium to the USGS Critical Minerals List last year, committed up to $80B to new reactor construction, and banned Russian uranium imports until 2040. The IEA forecasts annual nuclear investment rising from ~$70B today to ~$210B by the mid-2030s. The American supply chain is fragile, but it’s getting stronger. The question is will it be enough to cover those projected gaps?
The supply side is where it gets uncomfortable. Kazatomprom (NATKY)—the world’s largest producer of uranium—cut its 2026 production guidance. Cameco (CCJ), the world’s second-largest producer, lowered last year’s output due to development delays. Both look set to have continued issues moving forward preventing full production outputs.
Tier-one producers are openly telling the market that current pricing is not sufficient to justify bringing care-and-maintenance mines back online. That’s notable, because spot is at $87 and long-term contract prices are near $86. Producers are saying $100 is the floor that incentivizes new supply. After the failure to hold that level in January, the market has been choppy. Supply ultimately controls the market, since demand is beholden to the few large suppliers that are authorized to extract and enrich uranium into fuel.
That last part is important. The fuel cycle has its own chokepoints beyond mining. Yellowcake has to be converted to hexafluoride, enriched, and fabricated before it goes anywhere near a reactor; few companies are authorized to do this and can do it profitably. Russia controls a meaningful share of global enrichment and conversion capacity, and the U.S. ban on Russian imports has Centrus Energy (LEU) and NNE scrambling to scale up as the only licensed Western producers of high-assay low-enriched uranium (HALEU), the fuel that SMRs and microreactors take. Money doesn’t fix that fast. Permits, correctly skilled workers, transportation, and construction of proper storage facilities take years.
These supply bottlenecks all require time to heal, but the push to build out data centers is increasing demand at a much faster pace and is doing so right now. This imbalance is a clear catalyst for upside momentum for uranium.
Uranium Technical Outlook
While I was using spot U3O8 uranium prices earlier, there are not easily tradeable futures on uranium for most investors. Instead, I recommend a spot-tracking fund like the Sprott Physical Uranium Trust (SRUUF) which I will be using for our purposes here. Investors who prefer equities could consider the Sprott Uranium Miners ETF (URNM) as it holds pure-play uranium miners and some spot exposure.
Here’s the SRUUF (also listed on the TSX as U-UN) 1-year chart with daily candles:
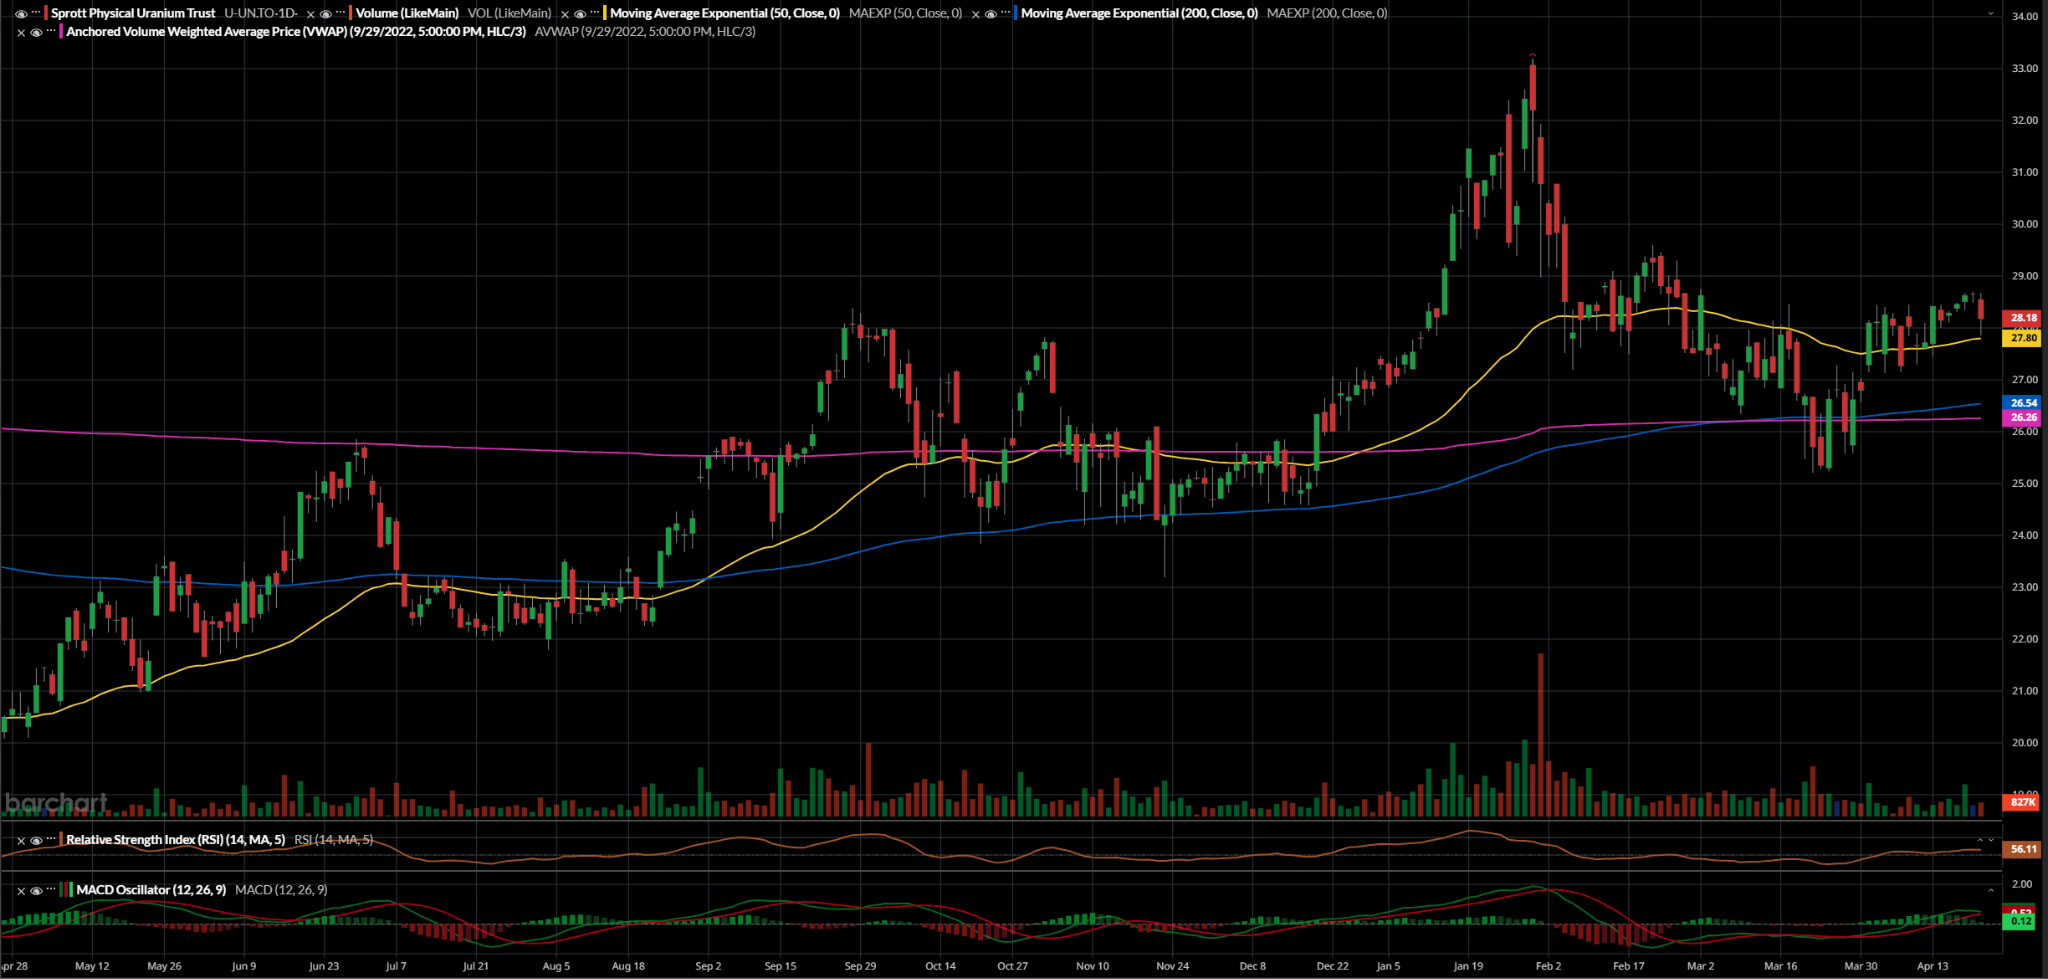
After breaking down below the 50-EMA at ~28 in late February and then failing the rest in early March when the U.S.-Iran war broke out, uranium fell below the 200-EMA at ~26 briefly before rebounding alongside the broad market and risk in general. The break back above the 50-EMA was reassuring for bulls, but now we’re back to approaching the old structural resistance around ~29, and uranium just retested the 50-EMA. This is a pivotal moment, as a break below the 50-EMA would be a bearish confirmation. But there don’t appear to be many near-term catalysts to drive us up above the ~29 resistance threshold. But should it break above, little stands between it and it’s old highs at ~33.
Current volume is low, and the MACD is showing facing momentum that’s about to roll over; without fresh price action to the upside, the signal lines will cross in the coming days. The RSI is the only positive momentum metric, although a drop below 50 coinciding with the bearish crossover in the MACD would be a nail in the coffin for breaking higher from here.
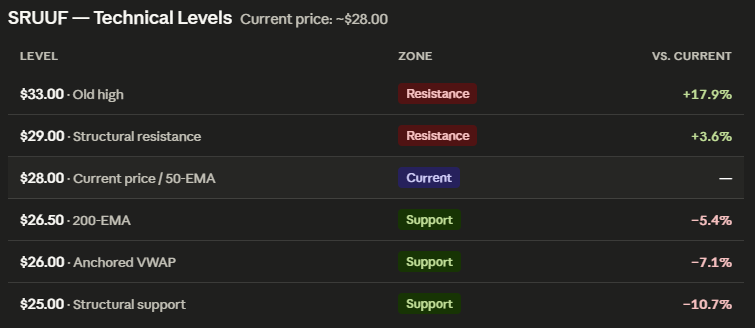
Here are the key levels to watch, and remember that these are approximates:
Conclusion
The fundamental story for uranium is as compelling as it has been in years. The deficit is real, the demand from hyperscalers is new and accelerating, policy has lined up behind the build-out, and the producers themselves are telling the market that $87 doesn’t get new pounds out of the ground. That’s a setup that should, eventually, resolve to the upside.
But “eventually” is a little loaded, because investors ultimately care about a more defined timeline, and many traders only care about the next days, weeks, or months. The chart is telling a different story than the fundamentals right now, and the chart is what you trade. Spot U3O8 failed at $100, SRUUF has stalled under its old structural resistance at ~$29, and the 50-EMA retest is ongoing. But momentum is fading in the moment that uranium needs it to hold the breakout; the MACD is about to cross bearish, and volume isn’t confirming anything.
This is the bull trap risk. The fundamental narrative appears clean, so it’s easy to chase and end up long at the top of a range. For bulls, the trade is patience. A confirmed close above ~$29 on real volume opens the door to $33, and that’s the move worth chasing. A break below the 50-EMA at ~$28 sends it back to the $26 zone, and that’s where I’d rather be a buyer. It’s much closer to buyer stockpiling levels, with the 200-EMA as the line in the sand for institutions. After all, the fundamentals will still be there in a month.