


Most investors register “volatility” immediately as the sudden forcefulness of price action. Most educated investors will associate it with the VIX (VIX), the “CBOE Volatility Index” that tracks the velocity of S&P 500 options. But the VIX only tells us what volatility is now. I’m more interested in what’s coming next. I’m tracking a handful of metrics that give some advance warning on future volatility, and they’re flashing red for the S&P 500 (and perhaps not in a bad way). Let’s walk through them so we’re prepared for what’s about to hit the market and maybe spike the VIX.
While the IV Rank is at 40%, meaning that the market is well within the last year’s range of implied volatility, consider that the last year also includes the Liberation Day crash in April 2025 that spiked the VIX to >50. This was a historic moment of unexpected chaos, although the market’s adjustment was rapid. If we strip out that black swan event, the real IV Rank would be ~75. This is why we have the IV Percentile as well, which sits at 94% and tells us that our current implied volatility is higher almost all trading days in the last year. That is the market pricing in significant future volatility; current trader assumptions are that the next month contains more volatility than any month in the past year.
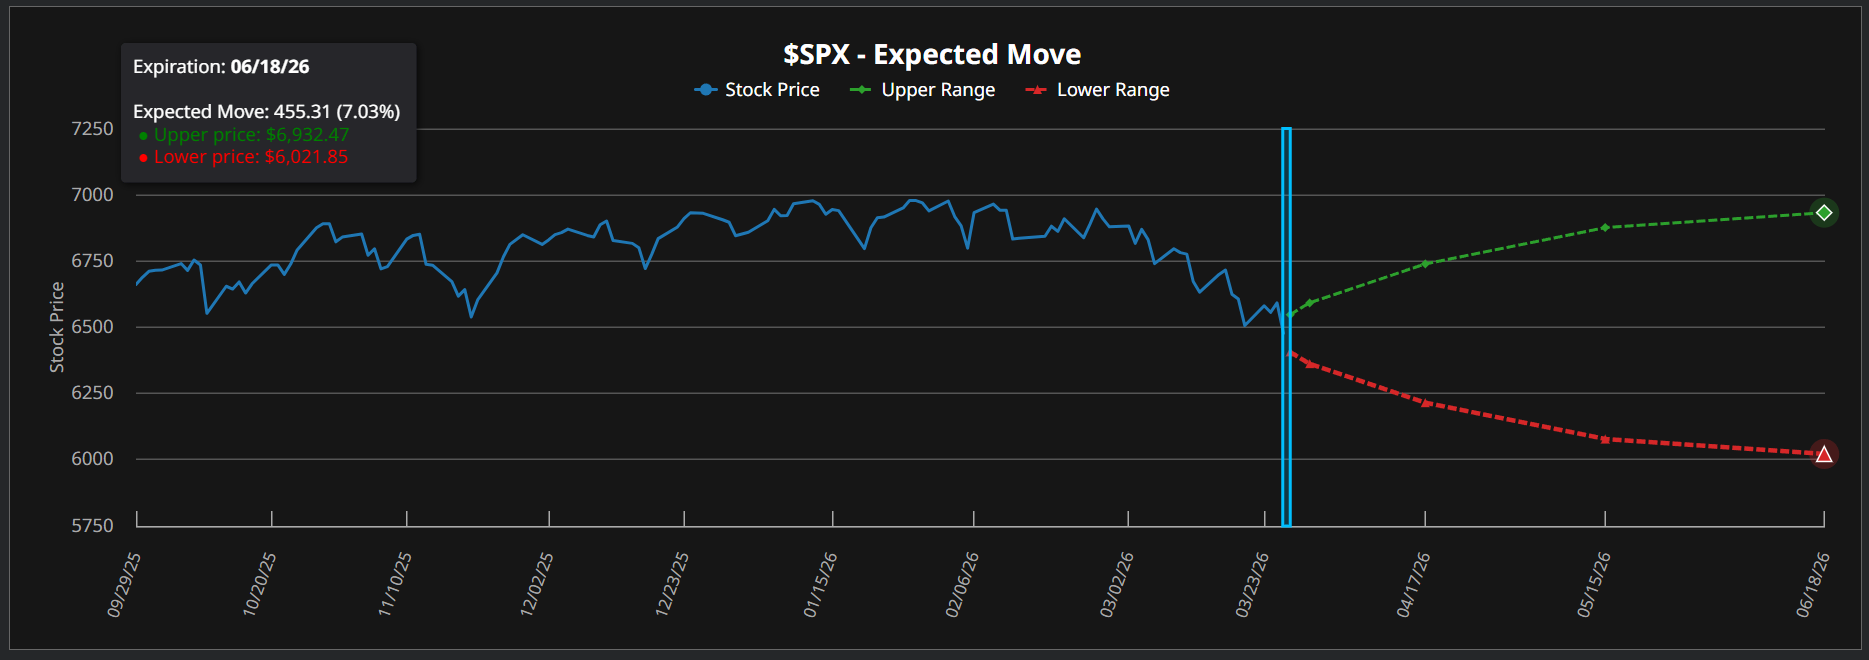
Options traders are expecting a big move for the index and are pricing in a full recovery of all the index’s YTD losses and then some. That, or a doubling down of the current YTD loss, ending up down >12% by the expiration in June. Of course, this is one of the extremes of the range, but pricing in a 7% move within 3 months is fairly uncommon. For context, the 3-month average expected move is typically around 4% in a calm market and 5.5% in the average market. So a move up to 7% is significant and tells us that traders are expecting volatility to increase meaningfully.
That chart begs the question: which way are traders weighted toward? Normally, the answer is always puts, and that is true this time as well. It is just far more common for puts to be traded than calls.
So what matters here is the ratio between them. A fall in this ratio would indicate that there is more call buying going on, which also means less hedging. This ratio has been falling YTD but has accelerated into this recent market sell-off as the hedgers realize their gains and bulls step up to buy weakness as they see it.
S&P 500 Price Forecast
Every new S&P 500 analysis as it publishes, today's technical signal and key levels, live price — on one page.
See all S&P 500 forecasts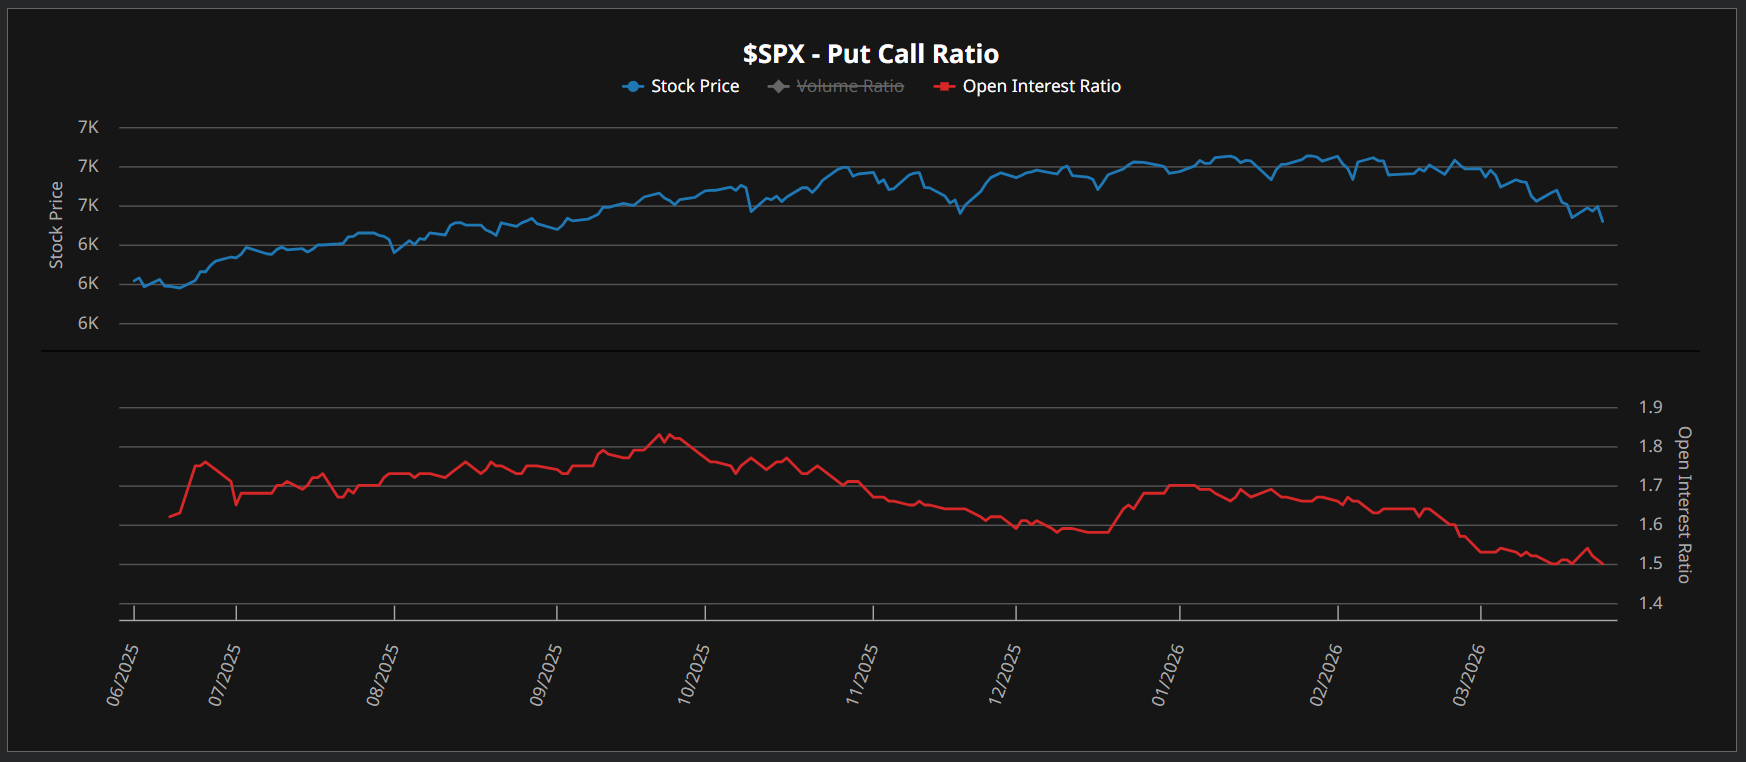
Gamma Is Decisively Negative
When we are looking at dealer (institutions, ex-asset managers & leveraged funds) positioning in S&P 500 futures contracts—this is the consolidated figure that includes SPX, XSP, et al.—we can see that since late October, dealers have gone further and further short. The past two weeks saw some recovery in line with the put-to-call ratio falling and bringing some slack to their books, but not much. They are still net short and at a much deeper level than they were in H2 2025.
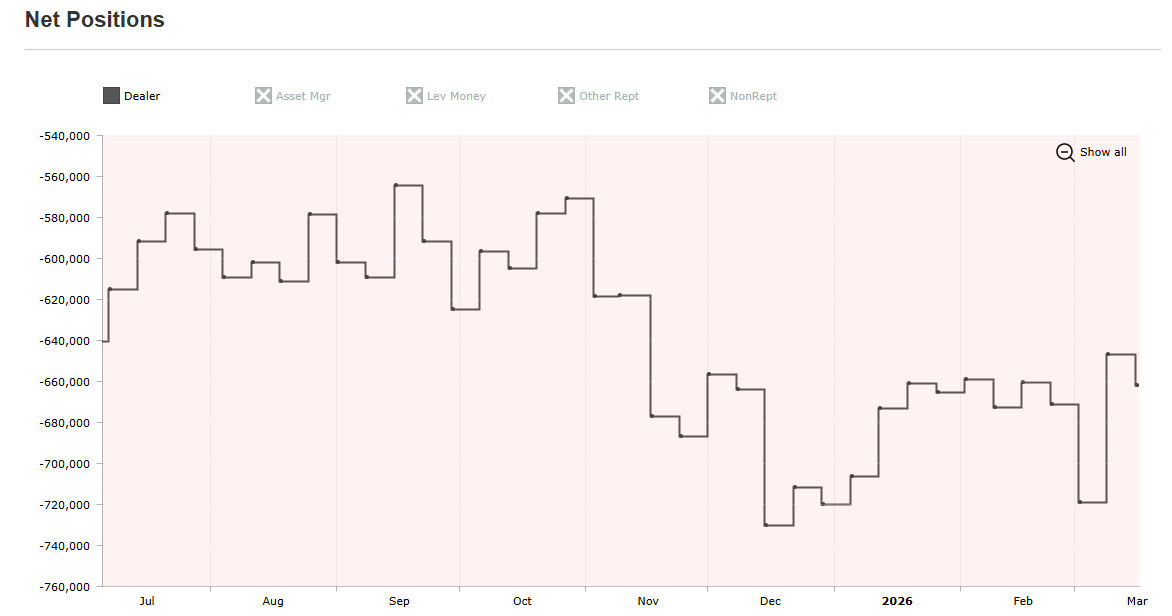
This does something to the mechanics of dealers. When they have net short exposure, it’s far more likely that their net gamma is negative. Negative gamma forces a certain kind of behavior from dealer institutions, where to keep delta neutral, they need to sell as prices fall. This also means buying as prices rise. Negative delta acts as an accelerant for markets, and the more negative it is, the harsher an accelerant it can act like. Here are the current exposure levels for SPX:
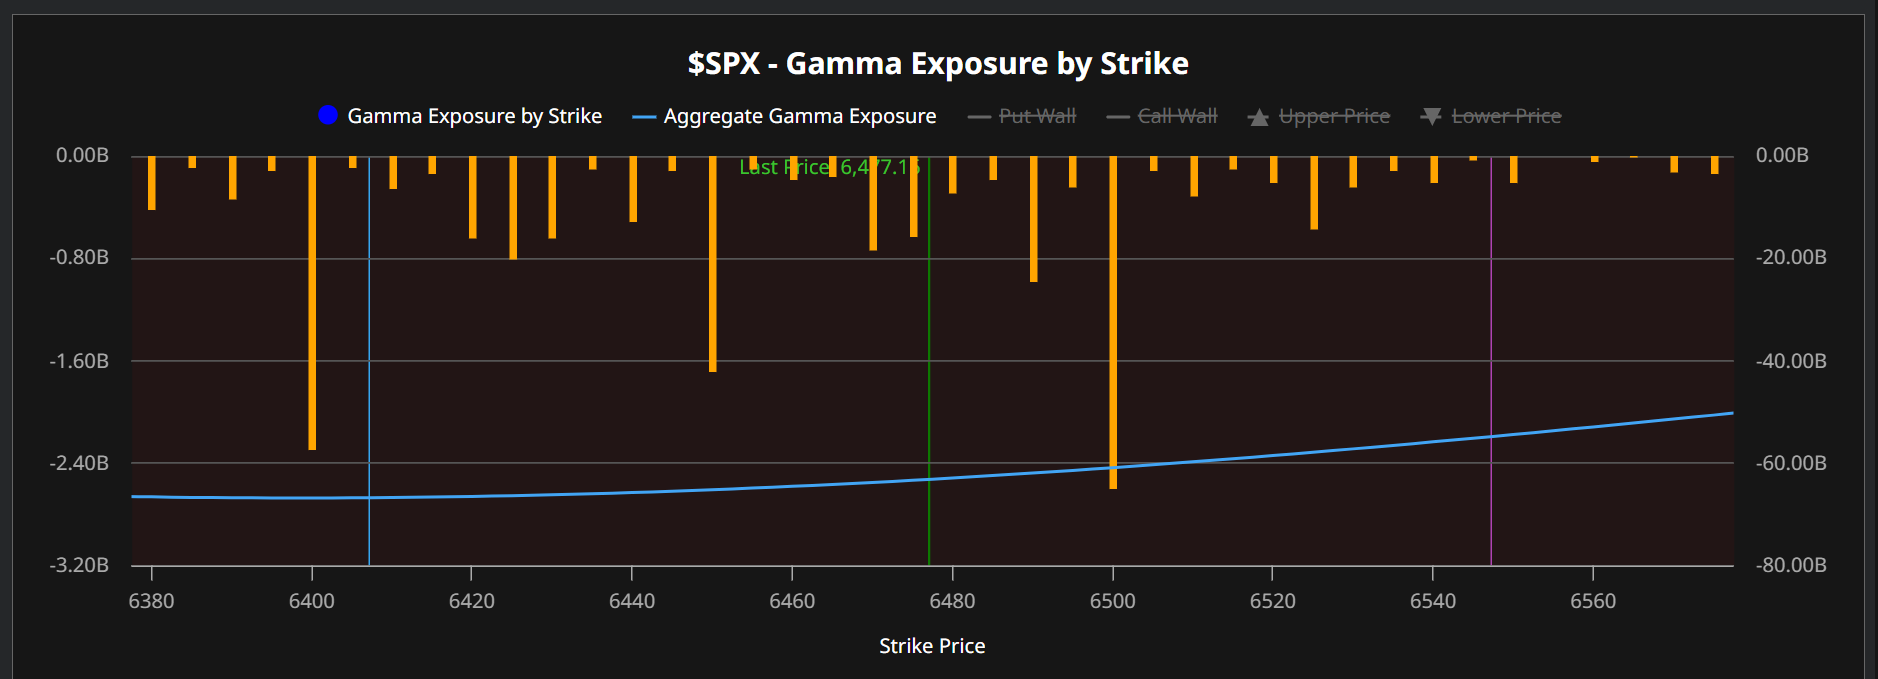
There’s $2.6B in negative gamma exposure sitting at 6500, which is elevated compared to normal times, as are most things right now. This is one of the core components of why we should expect increased volatility. And it’s worth being precise about what the $2.6B figure actually means. It is not a wall of buying that triggers the moment the price crosses 6500; that would be the order book. Instead, it represents the approximate rate of hedging activity dealers must execute per 1% move around that level.
Much of that adjustment happens continuously on the way up and down, not all at once at the exact level. Consider that this is just a snapshot after the markets are closed, but during the trading day, this figure is constantly changing.
That being said, the negative gamma exposure doesn’t relent on the way down. There is another $2.3B in exposure sitting at 6400. Moves down from here are likely to cascade, and worryingly for the bulls (of which I am one currently), the technical setup doesn’t allow for much downside from here. There are no strong support levels below our current level until we reach ~6200.
Conclusion
Further breakdown from current levels in SPX sees its negative gamma exposure accelerate the move and start a real cascade. That’s how the VIX takes off in the coming weeks, though there will need to be some trigger event. What that will be is unclear, but the mechanics are in place for it to send markets going down fast.
The mechanics work on the flipside as well. Bullishness is brewing in options ratios, and negative gamma causes the feedback loop on the buying side; the mechanics that set up the downside cascade can cause a melt-up as well. Should prices rise on improved sentiment, there is a lot of covering that will take place and add fuel to the fire.
The takeaway is to be prepared for volatility ahead. The data isn’t showing the eventuality of a crash or melt-up, but that traders are positioning for the possibility and that there is some plumbing that could make it a reality. It’s the kind of mechanics that turn what would be a 1% movement in a normal market into a 3% move in this market.