


The AI revolution has become one of the defining investment narratives of the 2020’s. Governments are running substantial fiscal deficits, central banks remain under pressure to support liquidity, and investors continue to price extraordinary growth into AI-driven companies. The result has been a powerful combination of optimism, liquidity and technological euphoria that has pushed U.S. equities to record highs. But there is a question investors should absolutely be asking: What if we are much closer to the death throes of the AI-driven bull market than the birth?
That does not necessarily mean the S&P 500 has reached its ultimate peak. In fact, a long-term analysis of inflation-adjusted S&P 500 cycles suggests the index could potentially rally another 14% before the current secular cycle reaches its conclusion. And then?
The S&P 500 Could Rally Another 14%
The S&P 500 is currently trading at 7,750 points. A long-term comparison with previous secular market cycles suggests the index could potentially advance to 8,863 points. That would represent 1,113 points of additional upside, or 14% from current levels.
On the surface, that may appear strongly bullish. But the reality is that the historical significance of the target is more important than the size of any potential gain. The same broad long-term structure appeared during the secular cycles that preceded both the Nifty Fifty and Dot Com bubbles. To understand why that matters, it is necessary to look at the market in inflation-adjusted terms.
Two Secular “Cups”
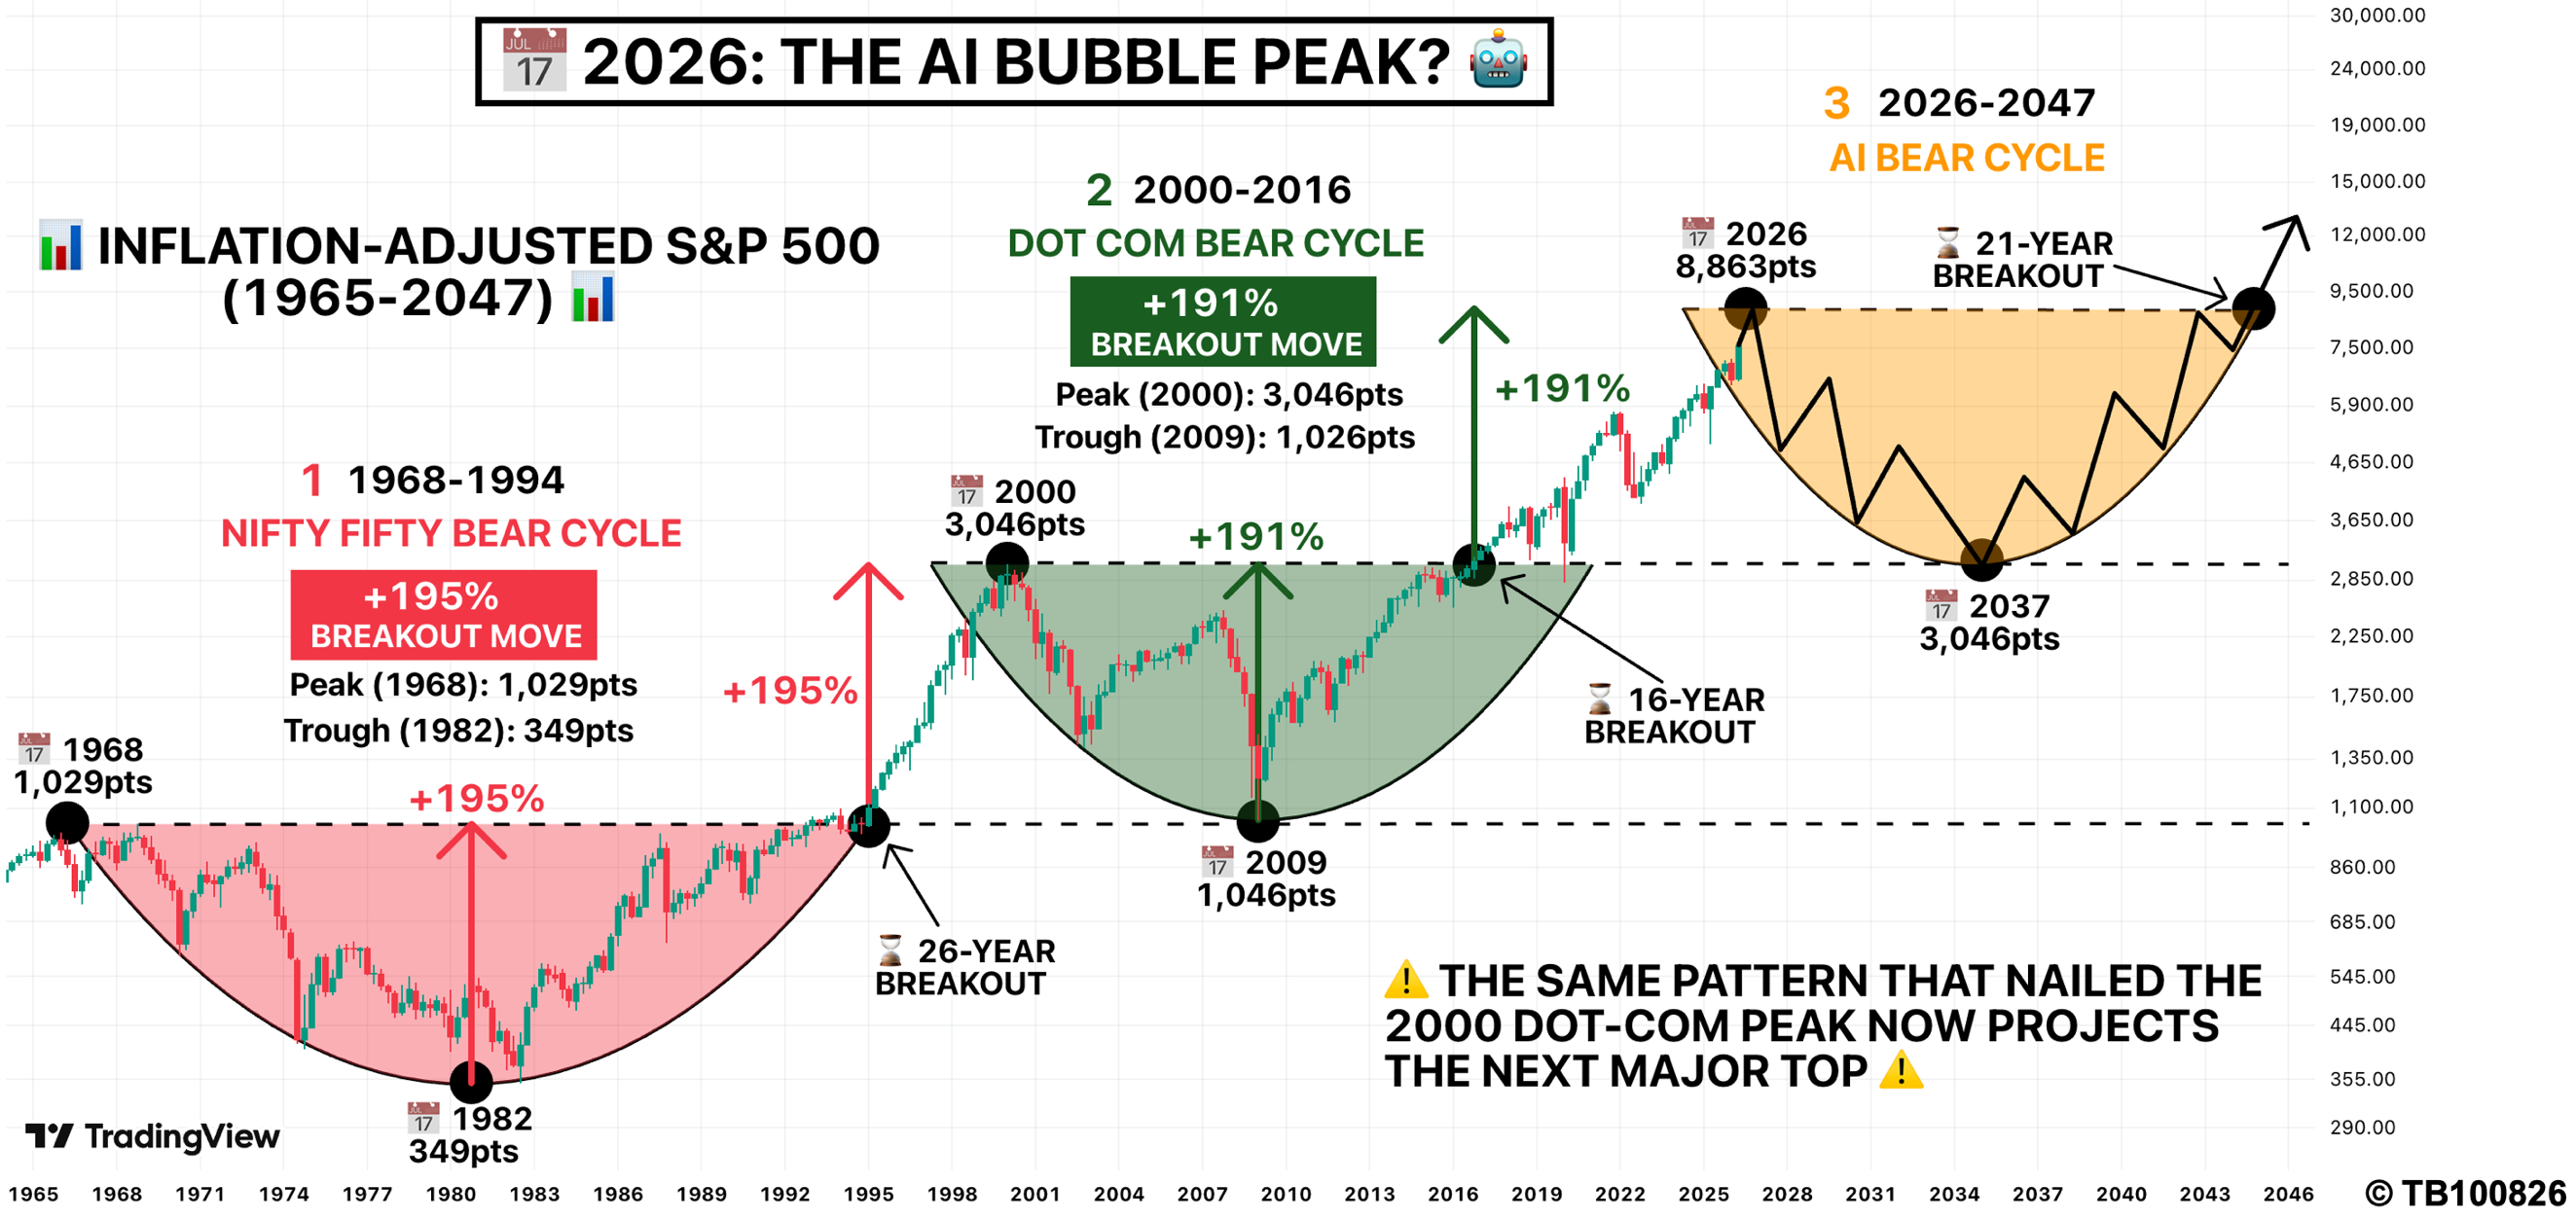
The inflation-adjusted S&P 500 reveals two remarkable long-term cup-shaped structures. The first developed following the Nifty Fifty era. The second followed the collapse of the Dot Com bubble. In both cases, the market experienced a prolonged decline, established a major low, recovered towards its previous high and subsequently broke into new territory. The magnitude of those recoveries provides the historical comparison for today’s market.
S&P 500 Price Forecast
Every new S&P 500 analysis as it publishes, today's technical signal and key levels, live price — on one page.
See all S&P 500 forecasts1. The Nifty Fifty Cycle
The first major cycle began with the market peak in 1968, when the inflation-adjusted S&P 500 reached 1,029 points. The index then entered a prolonged secular bear market, eventually falling to 349 points in 1982. From that trough, the market embarked on a historic recovery. The advance from the 1982 low back to the previous 1968 peak amounted to 195%.
Assuming the same magnitude of appreciation was subsequently projected from the breakout, the resulting target was 3,036 points. The actual peak of the Dot Com bubble in 2000 was 3,046 points.
What followed , of course, was a prolonged decline. Between 2000-09, the S&P 500 suffered a 66% loss in real terms. More importantly, investors who bought around the peak faced a prolonged period before recovering any purchasing power.
2. The Dot Com Cycle
The second cycle followed a remarkably similar pattern. The inflation-adjusted S&P 500 peaked at 3,046 points in 2000 before falling to 1,046 points in 2009. From that trough, the subsequent recovery once again produced an enormous advance. The move from the 2009 low back to the previous 2000 peak represented 191% – strikingly similar to the 195% advance observed during the previous cycle.
If the current market repeats follows a pattern of the 2009 trough to its subsequent breakout, the implied target, today, would be 8,863 points. And at the current rate, that level could potentially be reached by the end of 2026.
What’s the Next Move?
Bullish Until The Structure Breaks
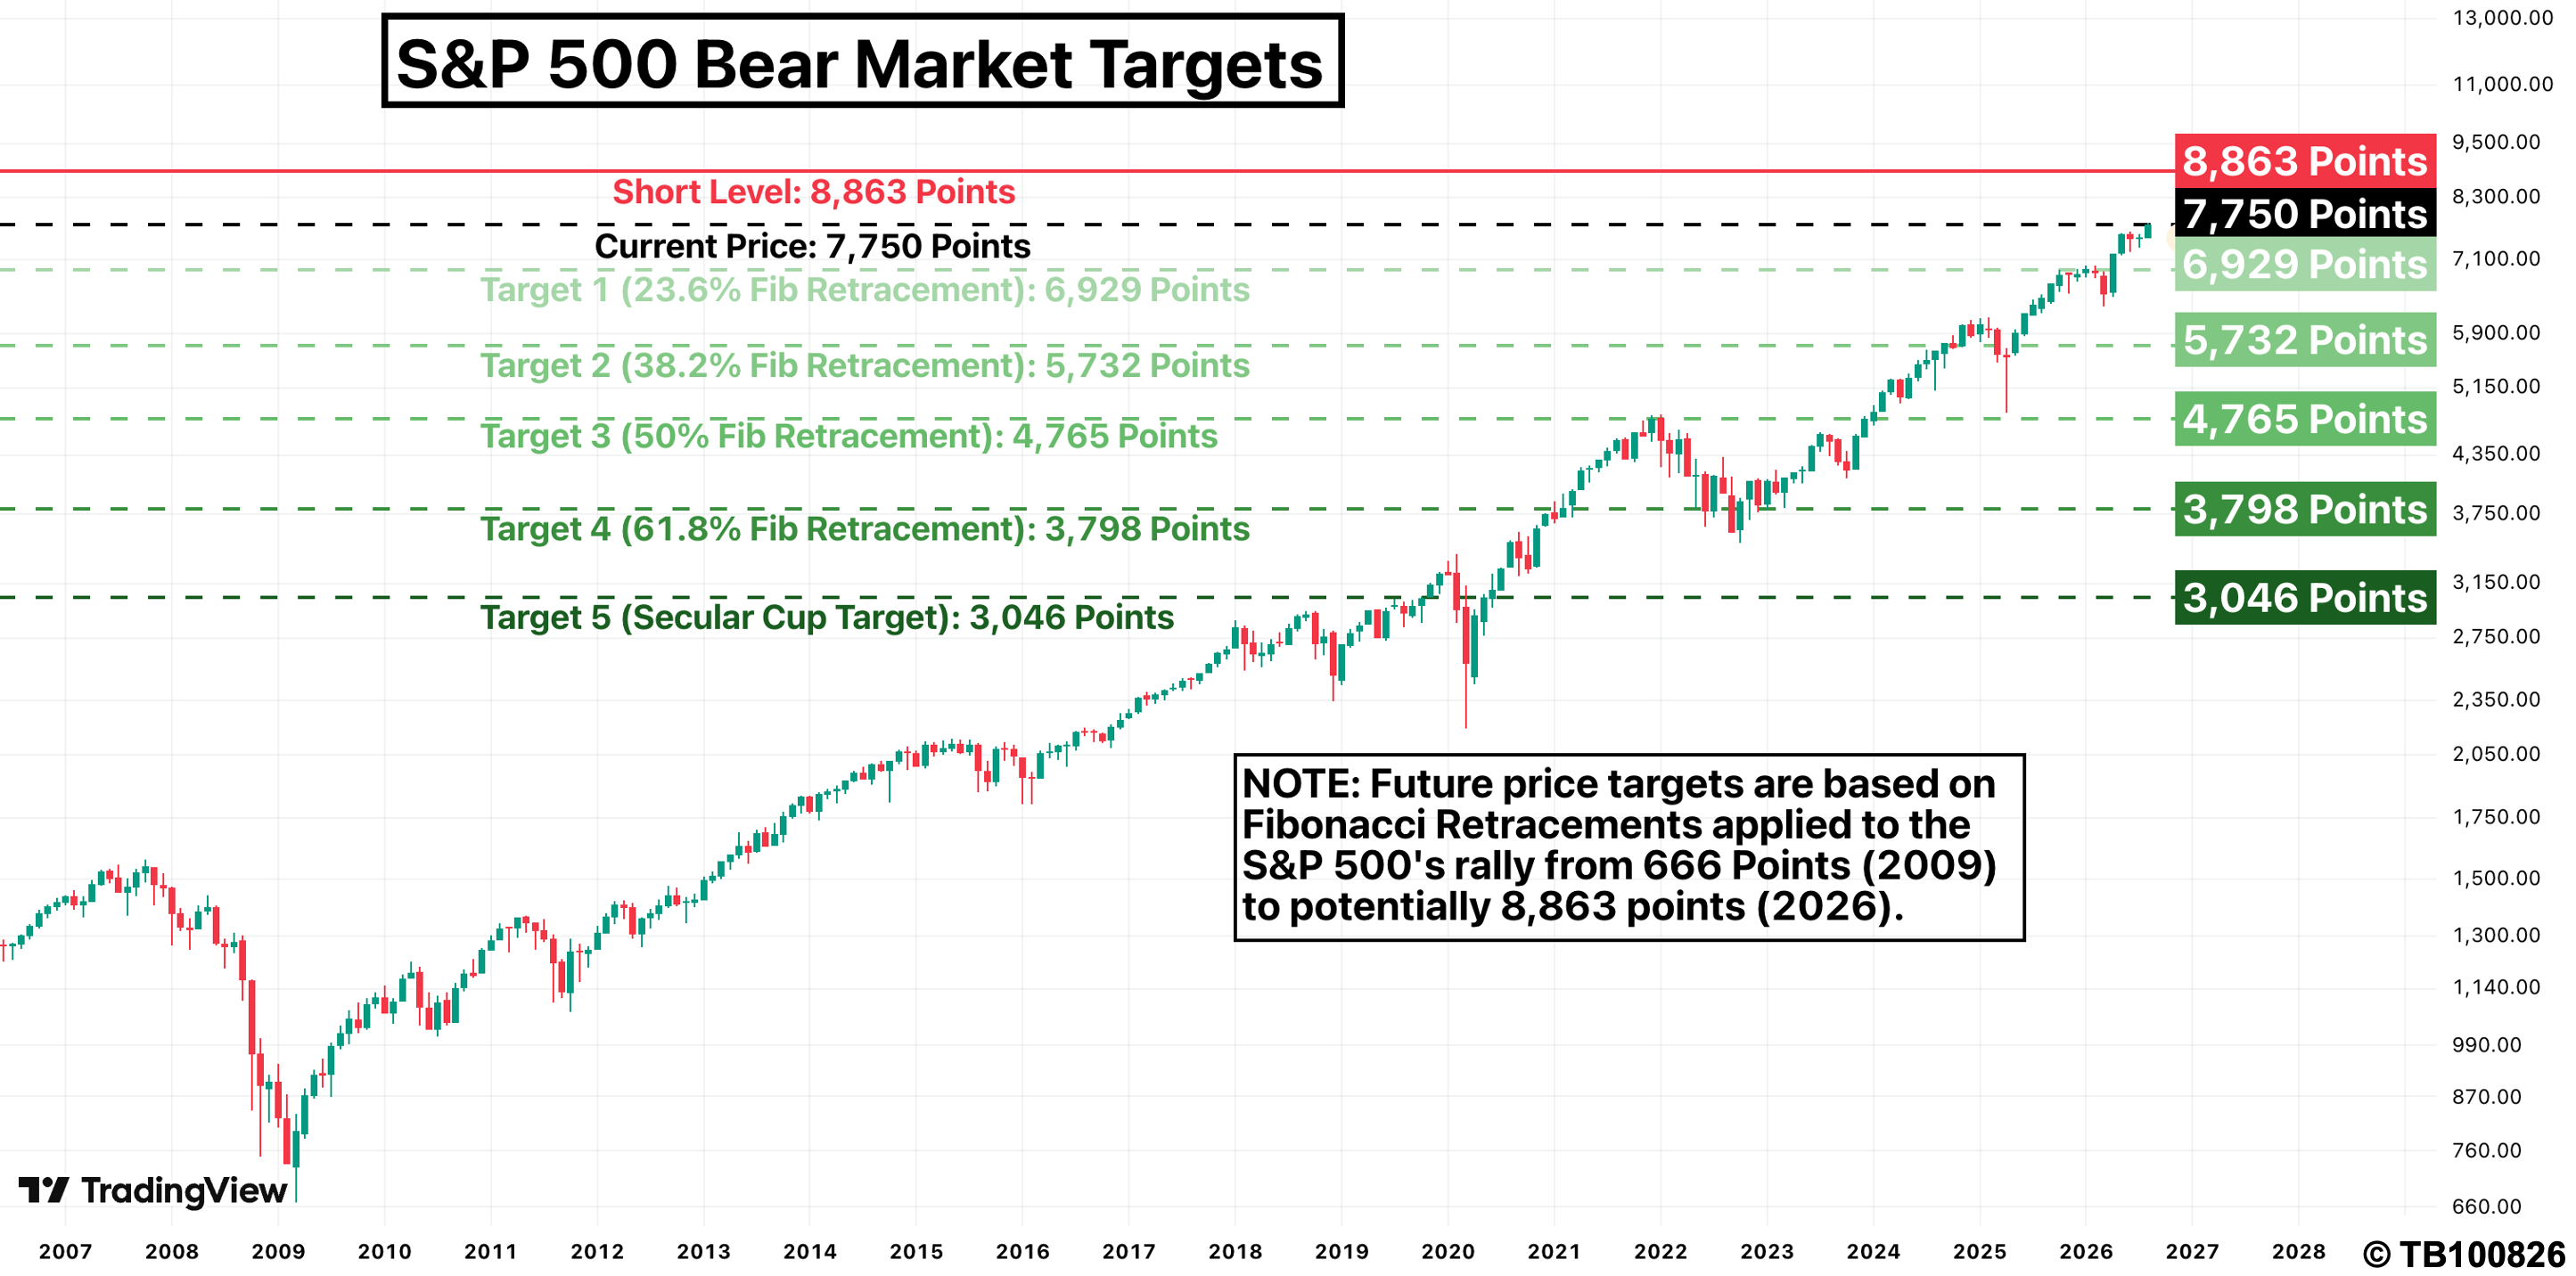
For now, my approach will be relatively straightforward: I’ll remain long in the S&P 500 while the index remains above 7,002 points. The significance of 7,002 points is that it represents a major pivot high established back in January 2026. Since 2013, when the S&P 500 has shot through major pivot resistance, when the market has returned to test it – it hasn’t broken decisively below it.
That makes 7,002 points a potentially important cusp. Above it, the current bullish structure remains intact. Below it, the historical pattern underpinning this particular bullish thesis would be materially weakened. From 7,750 points, a decline to 7,002 points would represent 10% downside. By comparison, an advance to 8,863 points would represent 14% upside. That leaves a potentially favourable risk/reward profile – while the structural support remains intact.
Bearish At 8,863 Points
My strategy would change materially if the market reached 8,863 points. At that level, I would consider initiating a short position, based on the possibility that the current secular bull market has entered its final stage. The objective would not be to identify the precise bottom. Instead, I would progressively realise profits as the market declined. My own exit structure would be:
- 6,929: closing 20% of the short position
- 5,732: closing 25% of the remaining position
- 4,765: closing 33% of the remaining position
- 3,798: closing 50% of the remaining position
- 3,046: exiting the remaining position
This deliberately staged strategy reduces the need to identify the exact turning point. Based on those exit levels and position-sizing rules, my weighted average exit price would be 4,851 points. A short initiated at 8,863 points and ultimately covered around that weighted average would therefore represent a potential gain of 45%.
The broader proposition is therefore asymmetric: Around 14% potential upside from today’s level to 8,863 points, followed by the possibility of 45% profit on the short strategy if the longer-term historical pattern subsequently plays out.
The Real Risk Is Not The Next 14%
This is where the thesis becomes more interesting. A move from 7,750 points to 8,863 points would undoubtedly feel spectacular. It would provide further ammunition for the bulls and strengthen the argument that AI, technological innovation, fiscal stimulus and monetary liquidity can continue driving equity valuations higher.
But another 14% of upside should not automatically be interpreted as evidence that a new multi-decade bull market is beginning. It could instead represent the final stage of the current secular cycle. That distinction matters enormously.
If 8,863 points ultimately proves to be a major secular peak, investors who chase the final leg higher could potentially capture a relatively modest gain before entering a market environment characterised by years of weak or negative real returns. The danger, therefore, is not necessarily the next correction. It is the possibility of confusing the final phase of a bull market with the start of the next.
The Cost of Buying At The Top
The historical narrative offers us an important reminder. Investors who bought around the 1968 Nifty Fifty peak had to wait 26 years to regain their purchasing power in real terms. Those who bought around the 2000 Dot Com peak faced 16 years before achieving a comparable real recovery.
If an AI-driven market peak were to occur during 2026 and we average out the length of the two previous episodes of no gains, an investor aggressively buying at the top today could theoretically face a 21-year recovery period extending to 2047.
That is obviously not a forecast. The economic environment of the next 20 years will almost certainly not resemble the past. AI could generate productivity gains on a scale that fundamentally transforms corporate profitability. Monetary and fiscal policy could produce a completely different market outcome. And technological revolutions could create enormous economic value. Nevertheless, the historical precedent is worthy of consideration.
The Final Stages Of A Bubble
Could the S&P 500 continue higher? Absolutely. Could the AI boom become even larger? Certainly. Could the index reach 8,863 points? Yes. The argument is therefore not that investors should automatically sell everything today. It is that investors should distinguish between participating in the final stages of a bull market and assuming this final stage will continue indefinitely. That distinction becomes particularly important when valuations, expectations and narratives begin reinforcing one another.
The final stage of a major bubble can feel extraordinarily comfortable. Technology appears transformative. Earnings forecasts seem certain. The economic narrative becomes increasingly compelling. And every additional surge up provides investors with the compelling evidence that any concerns are misplaced. That is precisely what makes a final phase so dangerous.
To summarise: the S&P 500 could still deliver another spectacular rally from here. It could potentially reach 8,863 points. But the more important question may not be whether investors can capture that final move. It may be whether they understand what they are potentially buying into when they do.
Is chasing a 14% upside worth the risk when considered against the backdrop of a potential downside that could involve 21 years of misery?