



The iShares 20+ Year Treasury Bond ETF (TLT) is trading at ~$86.50 and trying to climb its way back up to the 50-EMA, currently sitting at just above it. That retest matters a lot for the bulls who think rates will come down. TLT has been below both its 50-EMA and 200-EMA since mid-March, after the Fed’s hawkish shift sent yields higher. Since the lows following that meeting, the 20-year has consolidated and recovered a bit, and the chart is now asking every long bond bull to answer: does the first retest of the 50-EMA hold as resistance, or does TLT finally punch back through and reclaim some of that ground?
My read is that this retest fails. The macro backdrop that drove TLT below its key technical levels hasn’t changed. The Fed told us rates are higher for longer and it seems unlikely that a change over with just one member of the FOMC (Chair Powell for nominee Kevin Warsh) will be able to sway the path of monetary policy.
The bond vigilantes heard the Fed loud and clear and have been demanding higher yields ever since. The ceasefire extension with Iran this week pushed yields higher because the inflation picture has gotten messier with oil threatening to touch $100 again. Everything that had been keeping a bid under long bonds is rolling over at the same time, and the technicals are catching up to the macro. From the start of the war to now, the long end of the curve has risen. If it starts to revert, that could be the push bulls need to reclaim the 50-EMA.
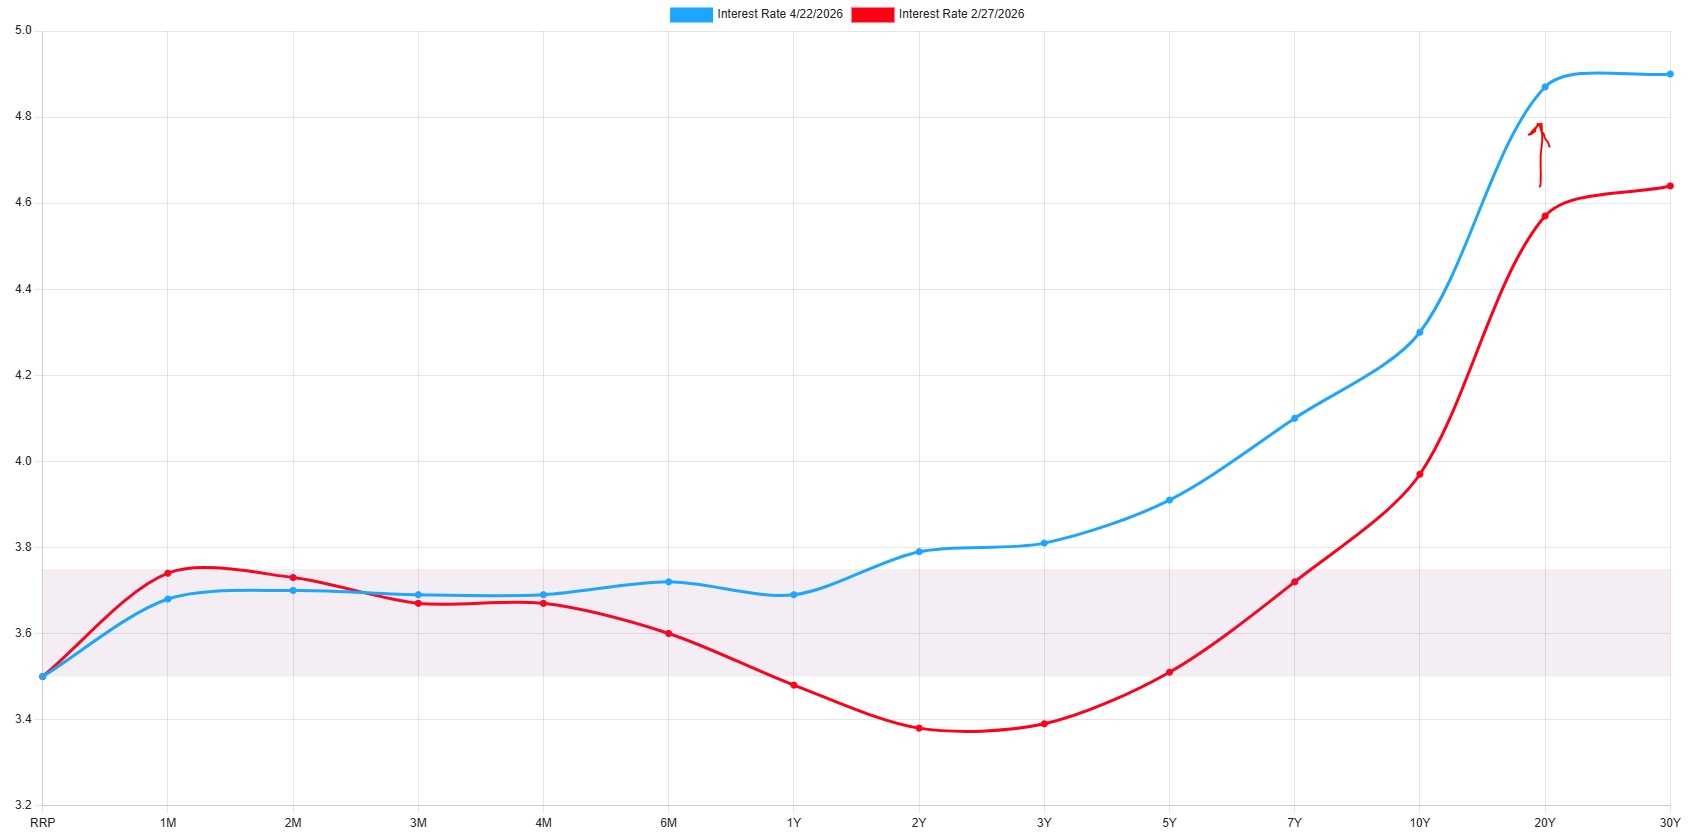
The Bond Market Is Listening
The FOMC’s last dot plot showed what looked like a dovish shift at first glance: the median dots for 2026, 2027, and 2028 all drifted lower. But the long-run dot, the one that reflects the Fed’s view on where rates settle structurally, moved the other way. That shift is rare, and it matters more than the near-term forecasts. Long-run assumptions don’t move on cyclical noise. When they move, it’s because the committee is updating its underlying model of the economy. The movement of that long-term median is the direct “higher for longer” signal for rates. The bond market took that and ran with it, which is how we get the 4.91% peak—the 20-year is sitting close to it now, at 4.89%.
Most recently, at a Senate Banking Committee hearing on the nomination of Kevin Warsh to the Fed chair position, he gave answers that corroborated the narrative, indicating that he was interested in redefining inflation to modernize the data collection and inputs, which exacerbated bond market fears. What goes on at next week’s FOMC meeting, particularly the statements made on how much of the ongoing inflationary spike in fuel the Fed is willing to look through and consider temporary, will determine where rates go from here.
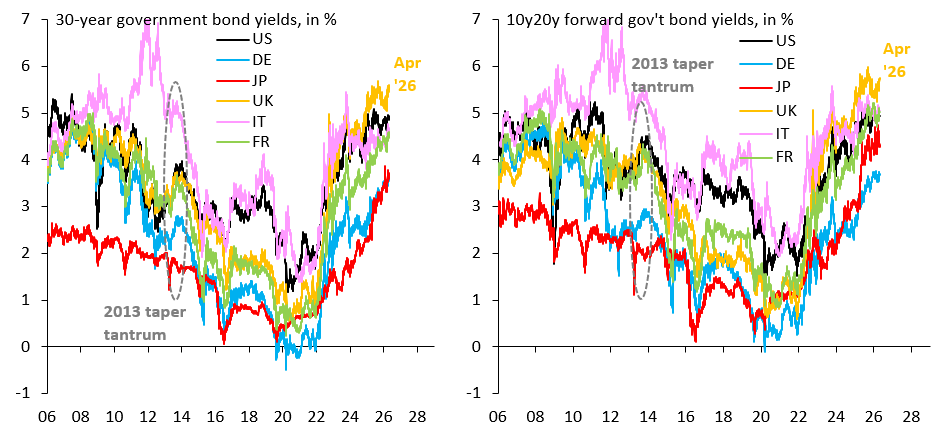
The broader context is worse. This isn’t just a Fed story. Sovereign bond yields across the developed world have been rising for over a year, even as central banks from the ECB to the Bank of Canada have cut policy rates. The U.S. is falling in line with what Canada, Australia, New Zealand, and the Eurozone have already been pricing. We aren’t returning to the easy money regime of the 2010s. Bond traders are demanding systematically higher rates across the board. This pressure has kept a floor for U.S. bond yields and thus a ceiling on TLT that has been keeping it depressed.
TLT Technical Outlook
The picture is ugly for bond bulls. TLT hasn’t printed a higher high in months, with its last major high on the chart coming in October. The 50-EMA rolled over in March, the 200-EMA is flat-to-declining, and the price is below both of them, trying to push up for a retest of the 50-EMA at ~87.
Here’s the 1-year daily chart for the TLT ETF, although this maps to most 20-year bonds:
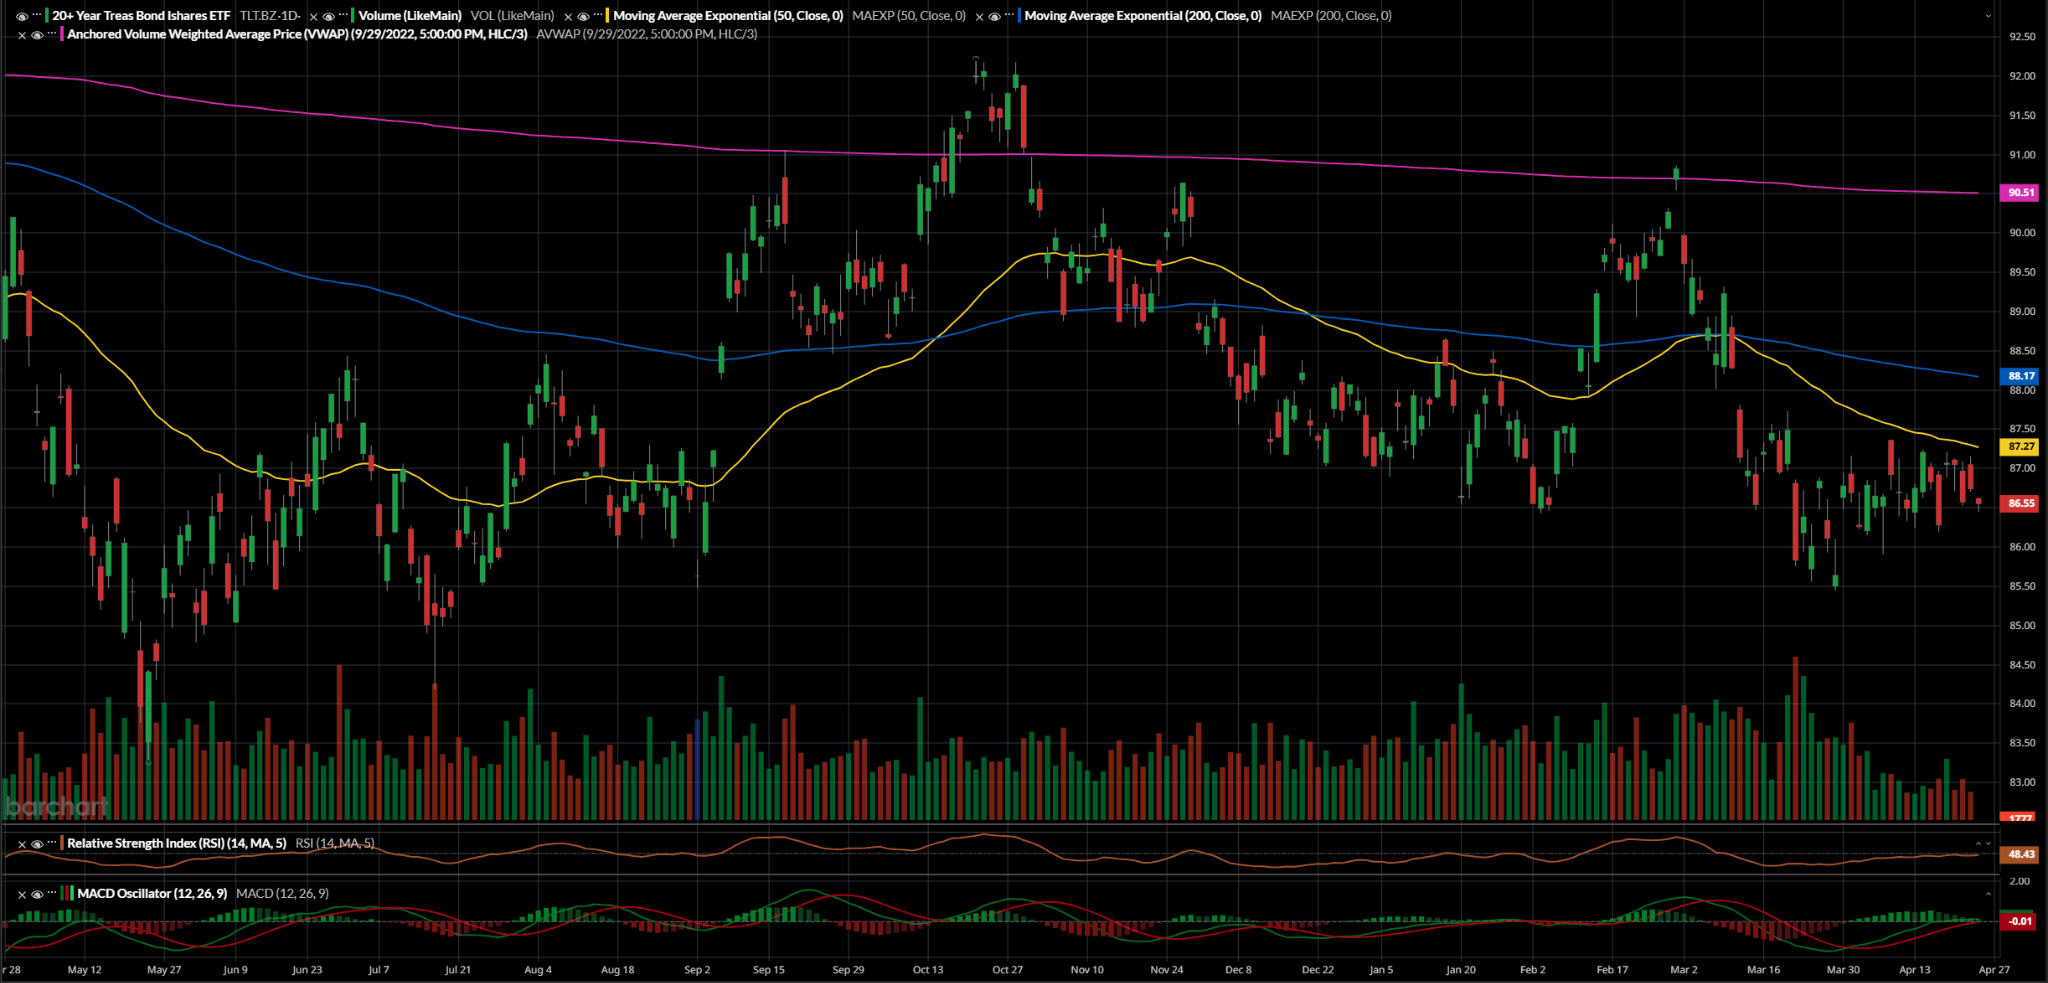
The bounce off the late March lows at ~85.50 looks reasonable on the surface, but there is a problem. The movement came on very low volume relative to the last few months, which is the signature of short covering rather than fresh buying. That means that demand may not be actually arriving like the recent ascending triangle suggests.
Momentum confirms the bearish read. RSI is at ~48, which is weak but almost neutral. That leaves plenty of room for the price to drift lower before momentum traders start sniffing a reversal. The MACD looks ready to cross the signal lines and fully roll over, although the read is still weakly positive. Neither indicator is very convincing that bulls will be able to keep the momentum needed to break out above the strong support sitting just above the price.
A breakout will be met with very heavy resistance, with the 50-day, 200-day, and anchored VWAP all stacked above the current price. But if volume increases, the trade may really have legs.
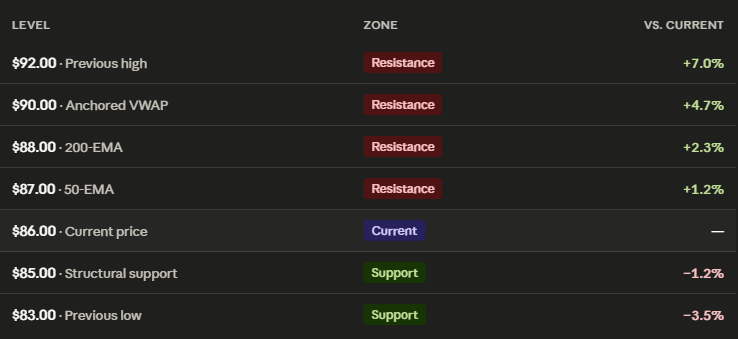
Here are the key levels to watch:
Conclusion
TLT is not broken in the way that a capitulation low would look. It’s ascending currently, consolidating before an attempt at a breakout. But the broader picture is showing something arguably worse for long-term holders: a grinding, orderly decline driven by a structural shift in the rate regime that the Fed signaled and the bond market has been confirming ever since. The 20-year at 4.89% is not a print that says the cycle is about to turn to me.
The near-term trade is the 50-EMA retest at ~$87, which sits very close to the current price. If it fails, TLT heads back toward its old lows, with structural support at ~$85.
My read: this is a potential short after rejection at the 50-EMA with a stop above ~$88 at the 200-EMA and a target at the prior low at ~$83. For longer-term holders of long-duration Treasuries, the more important takeaway is that the fundamental setup—higher for longer, sticky inflation, heavy supply, no safe-haven bid—hasn’t changed despite all of this. The chart is just the visual confirmation of the macro conditions. The bond market has been doing this to bonds across the board, not just treasuries.
Until something genuinely changes the higher-for-longer narrative, TLT’s rallies are opportunities to sell, not opportunities to buy from my view. Trade them carefully.