
Advertisement
Advertisement
Crude Oil Forecast October 25, 2016, Technical Analysis
Updated: Oct 25, 2016, 05:35 GMT+00:00
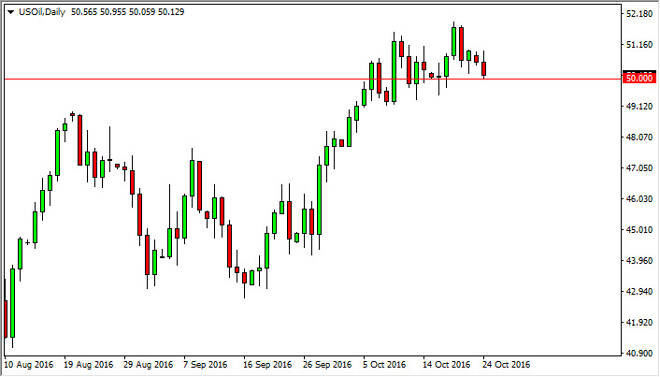
WTI Crude Oil The WTI Crude Oil market initially tried to rally during the day on Monday, but turn right back around to test the $50 level. There is a
WTI Crude Oil
The WTI Crude Oil market initially tried to rally during the day on Monday, but turn right back around to test the $50 level. There is a significant amount of support just below, and extending all the way down to the $49 handle. It is because of this that I don’t have any interest in selling, and I do believe that it is only a matter time before we bounce or form some type of supportive candle that we can go long from. With this, I am very cautious about the market at this moment in time but I do recognize that if we break down below the $48.50 level, and at that point in time we could start to see a significant sell off, which of course I would participate. In that case, I would anticipate that the market would reach towards the $47 level.
Brent
The Brent markets initially tried to rally during the course of the session on Monday, but turned around as well. We did up forming a bit of a shooting star and we are sitting on top of the $51 level, an area that seems to be rather supportive. I think that that support would run down to the $50 level based upon previous action, so it’s really not until we significantly break the $50 level to the downside that I would think about selling. In the meantime, I would anticipate that the market should find enough bullish pressure sooner or later to turn things back around and continue to go higher. With this, a supportive candle is reason enough to go long just as a fairly impulsive candle would be. A break above the top of the highs from the Monday session would signify that we will probably try to reach towards the $53 level above.
Ultimately, pay attention to the US dollar as it can have quite a bit of influence on the value of the oil markets in general, and as it goes higher, it can put bearish pressure on this market, and of course vice versa.
About the Author
Christopher Lewisauthor
Chris is a proprietary trader with more than 20 years of experience across various markets, including currencies, indices and commodities. As a senior analyst at FXEmpire since the website’s early days, he offers readers advanced market perspectives to navigate today’s financial landscape with confidence.


Advertisement