
Advertisement
Advertisement
Crude Oil forecast for the week of August 15, 2016, Technical Analysis
Published: Aug 13, 2016, 06:22 GMT+00:00
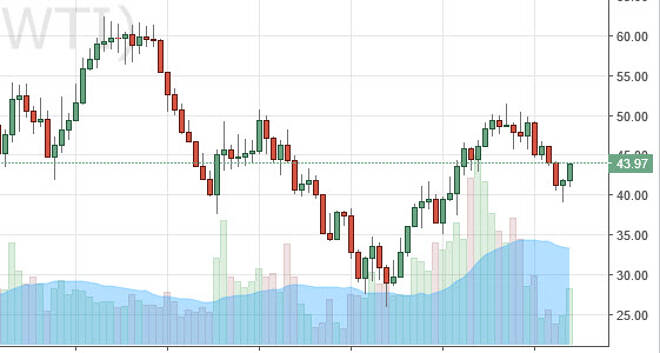
WTI Crude Oil During the previous week, the WTI Crude Will market formed a nice-looking hammer at the $40 level. This is a classic sign of support, and we
WTI Crude Oil
During the previous week, the WTI Crude Will market formed a nice-looking hammer at the $40 level. This is a classic sign of support, and we have seen quite a bit of follow-through during this past week. That being the case, I believe that the market is trying to rally from here and trying to go much higher. However, the question then becomes one of supply and demand. I believe that the supply will continue to outweigh the demand, although there are hints that perhaps next year production will fall due to the low prices of oil. Nonetheless, I believe that there is a bit of a buzz saw of resistance above so look for some type of exhaustion to sell. Longer-term traders are going continue to be beat up in this market though, the least until we get some type of clarity. A move above $50, or below $40 would be that clarity needed.
Brent
Brent markets of course did almost the exact same thing as the support seems to be somewhere near the $41 handle. I would also say that the $50 level in this market is extraordinarily important, and therefore if we can break above there it’s likely that we could make a longer-term and to the upside. It will be interesting to see how this plays out because the lack of shale production next year could very well put upward pressure on the market, but then again you have to worry about whether or not this can be any demand anyway. Saudi Arabia continues to flood the market with oil, while Iran and Russia are begging them to stop. At this point in time, it looks as if OPEC is still quite fractured, so this is going to be a volatile market regardless what happens. If we can break down below the bottom of the hammer from the previous we, that is a negative sign and would have me selling for the longer-term. In the meantime though, it’s probably be easier to trade this market from a short-term charts such as the daily timeframe.
About the Author
Christopher Lewisauthor
Chris is a proprietary trader with more than 20 years of experience across various markets, including currencies, indices and commodities. As a senior analyst at FXEmpire since the website’s early days, he offers readers advanced market perspectives to navigate today’s financial landscape with confidence.


Advertisement