
Advertisement
Advertisement
Crude Oil forecast for the week of September 12, 2016, Technical Analysis
Published: Sep 10, 2016, 05:14 GMT+00:00
WTI Crude Oil The WTI Crude Oil market rose during the course of the week, bouncing off of the $44 level. The market looks as if it is going to go back
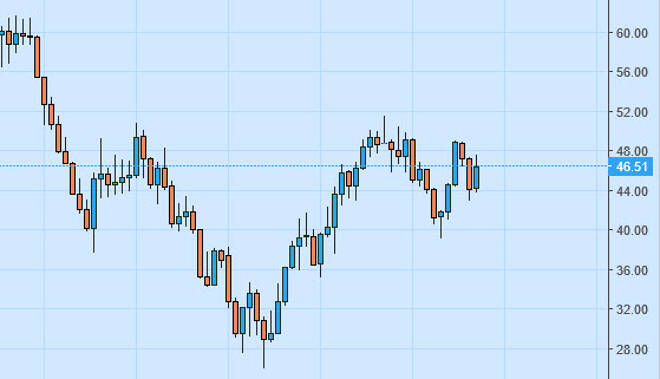
WTI Crude Oil
The WTI Crude Oil market rose during the course of the week, bouncing off of the $44 level. The market looks as if it is going to go back and forth, as we are most certainly in a consolidation area. A break above the $50 level would be very bullish, and a break down below the $44 level could be very negative. This is a market that is going to continue to be choppy, and as a result I think that it’s probably going to be easier to trade off of the short-term charts. However, you can make an argument for some type of inverse head and shoulders, but is not until we break above the neckline above that it gets proven. In the meantime, it is just simply consolidation.
Brent
Brent markets continued to go back and forth during the course of the week, but ultimately ended up with a fairly positive candle. Ultimately, the $52 level above will continue to offer resistance, just as the $45 level below looks to offer support. This is very much like the WTI Crude Oil market previously mentioned, as we are trying to figure out which direction where to go longer term. At this point in time, there are a lot of moving pieces in the markets, so having said that expect a lot of volatility. I believe in this market we could very well find the market to be best traded off of short-term trading, so having said that I probably not going to place a longer-term trade anytime soon. I would of course though if we get above the $52 level, as it is a massive resistance barrier.
Ultimately, this is a market that needs to make up its mind, but right now we are so try to figure that out. After all, there is a chance that we move in one direction or another, but we still have to worry about the demand picture, and of course the value the us dollar. Expect a lot of choppiness, and therefore you may want to look to the daily charts or even lower time frames.
About the Author
Christopher Lewisauthor
Chris is a proprietary trader with more than 20 years of experience across various markets, including currencies, indices and commodities. As a senior analyst at FXEmpire since the website’s early days, he offers readers advanced market perspectives to navigate today’s financial landscape with confidence.


Advertisement