
Advertisement
Advertisement
E-mini Dow Jones Industrial Average (YM) Futures Analysis – February 5, 2016 Forecast
By:
March E-mini Dow Jones Industrial Average futures are trading flat shortly before the release of the U.S. Non-Farm Payrolls report and the cash market
March E-mini Dow Jones Industrial Average futures are trading flat shortly before the release of the U.S. Non-Farm Payrolls report and the cash market opening. The price action this week given the volatility in the other markets suggests investors are confused. This could mean we’ll see a choppy, two-sided trade shortly after the release of the report before investors finally decide to pick a direction.
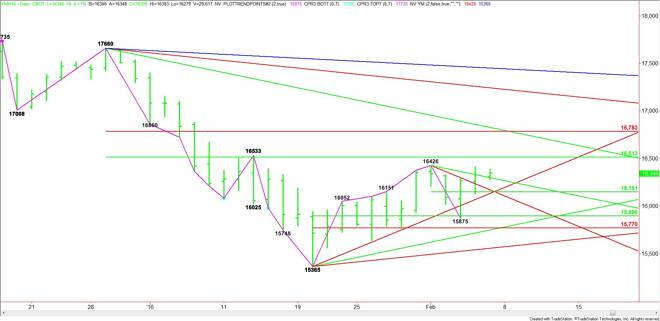
Technically, the main trend is up according to the daily swing chart. Taking out 16426 will turn the main trend to up. A trade through 15875 will signal a resumption of the downtrend.
The main range is 17660 to 15365. Its retracement zone at 16513 to 16783 is the primary upside target.
The short-term range is 16426 to 15875. Its 50% level is 16151. This level should be treated as a pivot.
The intermediate range is 15365 to 16426. Its retracement zone at 15896 to 15770 is the primary downside target. This zone provided support earlier in the week when the Dow traded down to 15875.
Based on Thursday’s close at 16328, the direction of the market today will likely be decided by trader reaction to the downtrending angle at 16298. This angle was tested successfully earlier in the session. Holding above this angle will indicate the presence of buyers. This could create enough upside momentum to challenge the main top at 16426.
A trade through 16426 will turn the main trend to up. This is followed by the major 50% level at 16513 and the main top at 16533. Taking out 16533 could trigger an acceleration to the upside with the next major target coming in at 16783.
A sustained move under 16298 will indicate the presence of sellers. The first downside target is a price cluster at 16170, 16151 and 16133.
The angle at 16133 must hold or the market could collapse since the next major downside target doesn’t come in until 15896. This is followed by 15875 and 15770.
Watch the price action and read the order flow at 16298 today. Trader reaction to this angle will tell us whether the bulls or the bears are in control.
About the Author
James Hyerczykauthor
James Hyerczyk is a U.S. based seasoned technical analyst and educator with over 40 years of experience in market analysis and trading, specializing in chart patterns and price movement. He is the author of two books on technical analysis and has a background in both futures and stock markets.


Advertisement