
Advertisement
Advertisement
EUR/USD Monthly Technical Analysis for January 2016
By:
The new year begins with the interest rate differential strongly favoring the U.S. Dollar over the Euro. The Fed just raised rates on December 16 shortly
The new year begins with the interest rate differential strongly favoring the U.S. Dollar over the Euro. The Fed just raised rates on December 16 shortly after the European Central Bank announced additional stimulus on December 3. The interest rate spread is expected to widen during 2016 because the Fed is scheduled to raise rates several times with the next coming in June 2016 while the ECB may have to continue to tweak its stimulus program. Because of the higher rates, the U.S. Dollar will continue to be a more attractive investment than the Euro. This should keep the selling pressure on the EUR/USD.
As we start the new year, the spread between the U.S. 2-Year Treasury Notes and 2-Year German Bonds suggests the EUR/USD should be valued at about 1.0300. If U.S. 2-Year Treasury Notes move to 2.0% then the Euro may drop to parity.
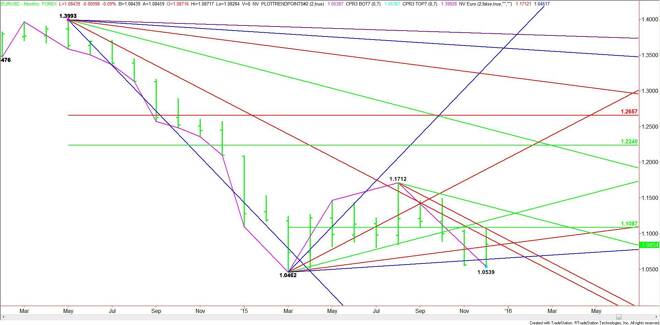
Technically, the main trend is down according to the monthly swing chart. However, the December closing price reversal bottom at 1.0539 has temporarily stopped the recent four month break. A trade through 1.1059 will confirm the potentially bullish chart pattern. This could lead to further short-covering in January, but it shouldn’t lead to a change in trend. This will only occur on a breakout over 1.1712.
The main range is 1.0462 to 1.1712. This makes its 50% level at 1.1087 an important pivot price. This price is essentially controlling the short-term direction of the market.
Based on the December 31 close at 1.0854, the direction of the market early in the month will be determined by trader reaction to the downtrending angle at 1.0912.
A sustained move over 1.0912 will indicate the presence of buyers. This could lead to a test of the pivot at 1.1087. Overtaking the pivot will indicate the buying is getting stronger with the next target an uptrending angle at 1.1262. This is followed by a downtrending angle at 1.1312.
A sustained move under 1.0912 will signal the presence of sellers. This is followed by uptrending angles at 1.0862 and 1.0793. The daily chart opens up to the downside under 1.0793 with the next target a slow-moving uptrending angle at 1.0662. This is the last potential support angle before the closing price reversal bottom at 1.0539 and the main bottom at 1.0462.
Watch the price action and read the order flow at 1.0912 this month. This price will tell us whether the buyers or sellers are in control.
About the Author
James Hyerczykauthor
James Hyerczyk is a U.S. based seasoned technical analyst and educator with over 40 years of experience in market analysis and trading, specializing in chart patterns and price movement. He is the author of two books on technical analysis and has a background in both futures and stock markets.


Advertisement