
Advertisement
Advertisement
Technical Outlook: USD/CAD, EUR/CAD And CAD/JPY
By:
USD/CAD Although 1.3000 – 1.3005 horizontal support triggered USDCAD bounce during Wednesday, the pair presently finds it difficult to surpass short-term
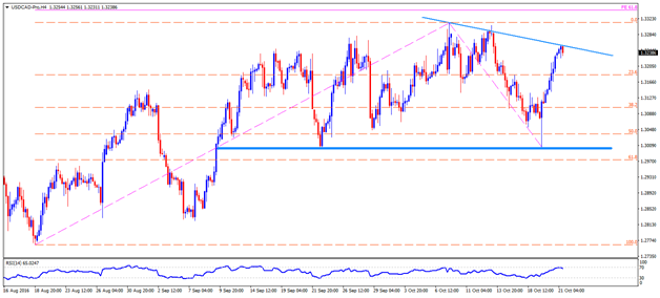
USD/CAD
Although 1.3000 – 1.3005 horizontal support triggered USDCAD bounce during Wednesday, the pair presently finds it difficult to surpass short-term downward slanting trend-line resistance of 1.3260 ahead of the Canadian Inflation and Retail Sales figures. Given these headline figures match upbeat forecasts, the pair can quickly break above 1.3260 and can rally towards 1.3280 before aiming the present month high of 1.3315. In case of the pair’s further advances beyond 1.3315, it becomes capable enough to test 61.8% FE of August – October up-move, near 1.3350. On the downside, 1.3210 and the 23.6% Fibonacci Retracement level of 1.3180 can entertain short-term sellers, breaking which the pair could dip to 1.3140 and then to 1.3060. However, pair’s additional weakness below 1.3060 needs to break below 1.3000 psychological magnet before it could plunge to 1.2930 support-mark.
EUR/CAD
Following its failure to sustain a spike above 100-day SMA, the EURCAD prices are now again declining towards 1.4380 trend-line support which triggered the quote’s bounce during April and June month. Should positive Canadian figures drag the pair below 1.4380, it can quickly plunge to 1.4280 and then to 1.4200. Moreover, the pair’s additional weakness below 1.4200 can have 1.4090 as small buffer to pass before it could re-test December 2015 low around 1.4020. Alternatively, 1.4480, 1.4520 and the 100-day SMA level of 1.4545 are likely immediate resistances that the pair traders should watch. Should the pair manage to provide a closing break above 1.4545, chances of its extended north-run to 1.4610 and to 1.4675 can’t be denied.
CAD/JPY
CADJPY’s break of three-month old descending trend-line was aptly confined by the 100-day SMA which presently drags the pair to test the same resistance-turned-support-line around 78.40 that is closely followed by 50-day SMA level of 78.00. If weaker Canadian prints fetch the pair prices below 78.00, the 77.30 and the 76.70 are likely downside figures to observe on the chart before the Bears aim for 76.00 and the previous month low of 75.40. Should the pair declines below 75.40, it can extend the southwards trajectory to 61.8% FE of its April – June dip, at 74.60. Meanwhile, 78.90 and the 100-day SMA level of 79.00 are expected nearby resistance to limit the pair’s near-term advances, breaking which 79.45 and the 80.00 figures could come-up to analyze. Moreover, pair’s extended rise beyond 80.00 enables it to look for 81.20 and then to the 50% Fibonacci Retracement level of 82.00.
Cheers and Safe Trading,
Anil Panchal
About the Author
Anil Panchalauthor
An MBA (Finance) degree holder with more than five years of experience in tracking the global Forex market. His expertise lies in fundamental analysis but he does not give up on technical aspects in order to identify profitable trade opportunities.


Advertisement