
Advertisement
Advertisement
Technical Update: USDCHF, NZDCHF And CADCHF
By:
USD/CHF While a year-long upward slanting trend-line confined the USDCHF downside, the Brexit decision propelled the pair towards the month’s high;
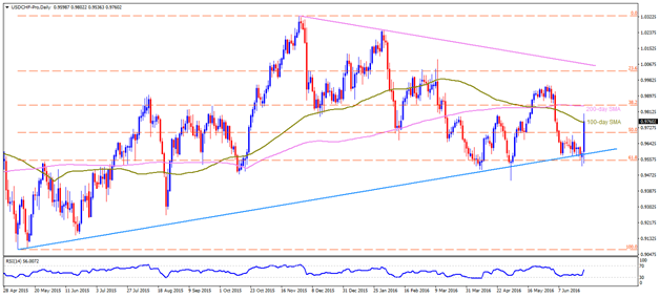
USD/CHF
While a year-long upward slanting trend-line confined the USDCHF downside, the Brexit decision propelled the pair towards the month’s high; however, a pullback move presently confronts with 100-day SMA level of 0.9760, clearing which the pair could rally further towards 38.2% Fibonacci Retracement of its May – November 2015 and 200-day SMA confluence, near 0.9845-50 area. During its extended rise beyond 0.9850, the 0.9885 and the 0.9900 might act as intermediate resistance that the pair needs to clear prior to 0.9950-55 resistance-region. Alternatively, a daily close below 0.9760 might trigger profit-booking moves of the pair to 50% Fibo level around 0.9700 and to the 0.9630 before challenging the mentioned trend-line support of 0.9580, followed by 61.8% Fibo level of 0.9545. Given the pair drops below 0.9545, the 0.9500 and the 0.9470 are likely consecutive support that it could test before visiting the 0.9400 – 0.9390 multiple support-zone.
NZD/CHF
Even as the present uncertainty helped the NZDCHF to rally towards the highest level in a more than a year, resistance-line of six-month old ascending trend-channel, coupled with 61.8% FE of its August – December 2015 upside, near 0.7025, might restrict its further upside. If the pair fails to respect the 0.7025 mark and closes beyond that, 0.7070, the 0.7100 and the 0.7170 are likely landmarks that it could print. Meanwhile, a close below December 2015 highs of 0.6878 can trigger its fresh downside to 0.6830 and 0.6780 prior to resting on short-term ascending trend-line support of 0.6760. Should the pair declines below 0.6760, 0.6700 can become its next support to conquer ahead of witnessing 0.6615-10 support-confluence, including 23.6% Fibo and support-line of the mentioned channel.
CAD/CHF
CADCHF’s break of two-month old descending trend-line resistance failed to clear the 50-day SMA and the pair is presently witnessing correction towards 0.7460 immediate support, breaking which 0.7425 and the 23.6% Fibonacci Retracement of its January – April up-move, near 0.7400, can restrict the pair’s further decline. Given the pair maintains the downside below 0.7400, the 0.7360 and the 0.7340 can act as buffer rest-points during its south-run to 0.7260 mark. On the upside, a break above 50-day SMA level of 0.7570 can extend the up-move to March highs around 0.7600, 0.7640 and the 0.7670 ahead of fighting with 0.7725-30 resistance-zone, including 61.8% FE and April highs. Should the pair rallies beyond 0.7730, it wouldn’t take much time for its to print 0.7800 on chart.
Follow me on twitter to discuss latest markets events @Fx_Anil
About the Author
Anil Panchalauthor
An MBA (Finance) degree holder with more than five years of experience in tracking the global Forex market. His expertise lies in fundamental analysis but he does not give up on technical aspects in order to identify profitable trade opportunities.


Advertisement