
Advertisement
Advertisement
The Best Trading Opportunity Today – March 30-Year U.S. Treasury Bonds – November 30, 2015
By:
After a prolonged move up in terms of price and time, March U.S. Treasury Bonds posted a potentially bearish closing price reversal top on November 27,
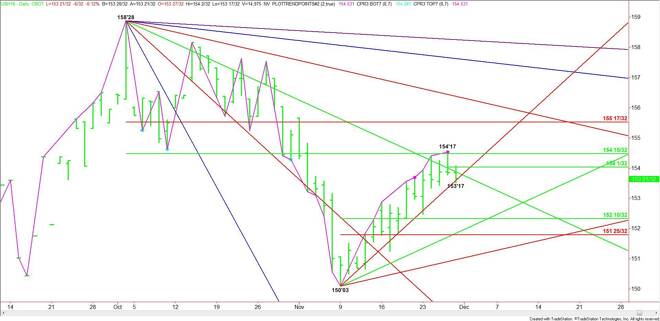
After a prolonged move up in terms of price and time, March U.S. Treasury Bonds posted a potentially bearish closing price reversal top on November 27, setting up the market for a possible 2 to 3 day break or a 50% correction of its last rally.
Earlier in the session, sellers confirmed the chart pattern when they took out Friday’s low at 153’25. The market is now set up for further downside action. This is why we consider this to be the trade of the day.
There are several ways to approach the market now that the closing price reversal top has been confirmed. It all depends on your personal preference. Since this is a momentum play, it would be nice if volume and volatility returned to at least average.
After confirming the chart pattern on the trade through 153’25, T-Bonds broke into 153’17. This was essentially a test of the steep uptrending angle that has been providing support and guidance since the 150’03 main bottom on November 9. This angle at 153’19 and the low at 153’17 are essentially trigger points for the start of an acceleration to the downside.
The entry level for a short position today will depend on a trader’s personal preference.
More aggressive traders will prefer to short weakness on a trade through 153’19 to 153’17. This is a pure momentum play.
Less aggressive traders may prefer to sell an intraday rally back to the conference level at 153’25. Some may prefer to sell a rally back into the major downtrending angle at 153’28.
Even more risk averse traders may want to wait for a retracement of the 154’17 to 153’17 range. This price level is 154’01. Waiting for this price may even carry more risk of failure because the intraday momentum may have shifted back to the upside.
Now that the potentially bearish closing price reversal top has been confirmed, the tone of the market today may be to the downside. Watch the price action and order flow at each of the potential resistance levels previously mentioned. The idea behind this trade is for better-than-average volatility and selling volume to return today, triggering an acceleration to the downside through the uptrending angle at 153’19.
Although we are only looking at this trade today, if the market closes in a weak position, there is the possibility that it could eventually lead to a 2 to 3 day break into at least 152’10.
About the Author
James Hyerczykauthor
James Hyerczyk is a U.S. based seasoned technical analyst and educator with over 40 years of experience in market analysis and trading, specializing in chart patterns and price movement. He is the author of two books on technical analysis and has a background in both futures and stock markets.


Advertisement