
Advertisement
Advertisement
Trade of the Day – March U.S. Dollar Index – February 8, 2016
By:
March U.S. Dollar Index futures is the market to watch today because of a possible shift in the fundamentals and the technical picture. Last week’s
March U.S. Dollar Index futures is the market to watch today because of a possible shift in the fundamentals and the technical picture. Last week’s volatile price action by the March U.S. Dollar Index was all about the pace and the timing of the expected Fed rate hikes. The Greenback broke sharply for two days last week on negative news about the pace of the rate increases, but managed to rebound at the end of the week, following the release of more upbeat news.
We’re looking for the rebound rally to continue this week especially since the market formed a potentially bullish closing price reversal bottom on the daily chart. The key today will be the news and the follow-through rally.
The potentially bullish chart pattern is there, but we’re going to need the news to make it work. We need to see U.S. Dollar investors continue to make position adjustments that reflect the possibility of at least one Fed rate hike in 2016. If they go back to thinking like they did early last week that there is no chance of at least one rate hike then support for the dollar index will continue to erode.
This essentially means we are going to need help from the stock market. If the stock market continues to weaken like it is early today then the funding currencies – the Japanese Yen and the Euro- are going to continue to strengthen. This will prevent the March U.S. Dollar Index from rallying.
If stocks can find a bottom then the weakness in the Japanese Yen and the Euro is likely to lead to a strong move by the dollar index.
Technically, the main trend is down. However, momentum appears to have shifted to the upside.
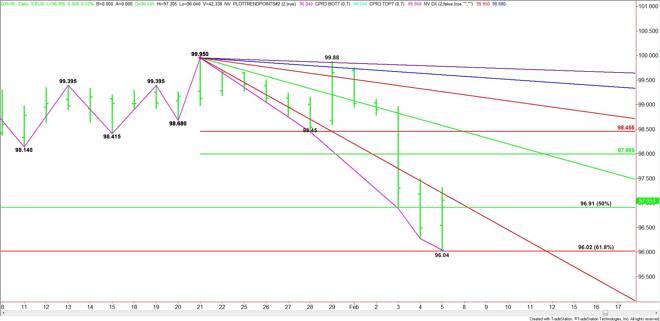
The index opened on the strong side of a downtrending angle on the daily chart at 96.95 and the major 50% level at 96.91. These are two key support angles that need to hold or the index will continue to weaken.
If there is a sustained move under 96.91, the index will likely continue down to 96.67, which will complete a 50% retracement of the first rally from the 96.04 closing price reversal bottom. If 96.67 fails then this will indicate the lack of buyers and the move could continue into 96.04.
The key number to watch on the upside is 97.305. This is Friday’s high. If this market is going to rally then we need to see this number taken out with conviction. We may see some back and forth trading on both sides of this number until traders decide what they want to do. So we must monitor the order flow and price action at this level to determine if the buyers or the sellers have the upper hand.
The daily chart indicates there is room to the upside if buyers can sustain a move over 97.305. The first major upside target is the 50% level at 97.995. This is followed by a price cluster formed by a downtrending angle and Fibonacci level at 98.45 to 98.46.
If conditions are right then we expect to see a huge breakout over 97.305. However, be prepared for a choppy, two-sided trade if there is trader uncertainty and buying volume is light.
About the Author
James Hyerczykauthor
James Hyerczyk is a U.S. based seasoned technical analyst and educator with over 40 years of experience in market analysis and trading, specializing in chart patterns and price movement. He is the author of two books on technical analysis and has a background in both futures and stock markets.


Advertisement