


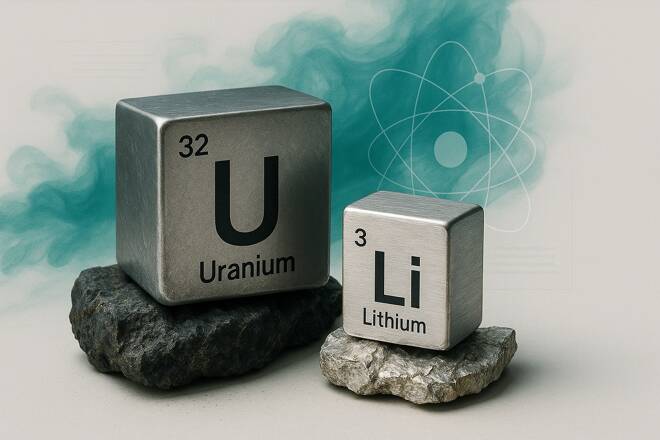
Copper (XCU), lithium and uranium face mixed signals as the weak Chinese growth and uncertain US rate policy increase the short term volatility in commodities. In my view, the tight copper supply, strong energy investment and growing nuclear demand may support copper and uranium, while lithium may remain under pressure from new mine supply. This article presents the key macro drivers, supply trends and technical levels that may shape the next move for these three commodities.
China Slowdown Pressures Copper and Lithium
China’s weaker economic data creates the short term headwind for copper and lithium but it has not reversed the broader bullish trend in copper. The tight physical supply, falling inventories and strong demand from power infrastructure continue to support copper prices.
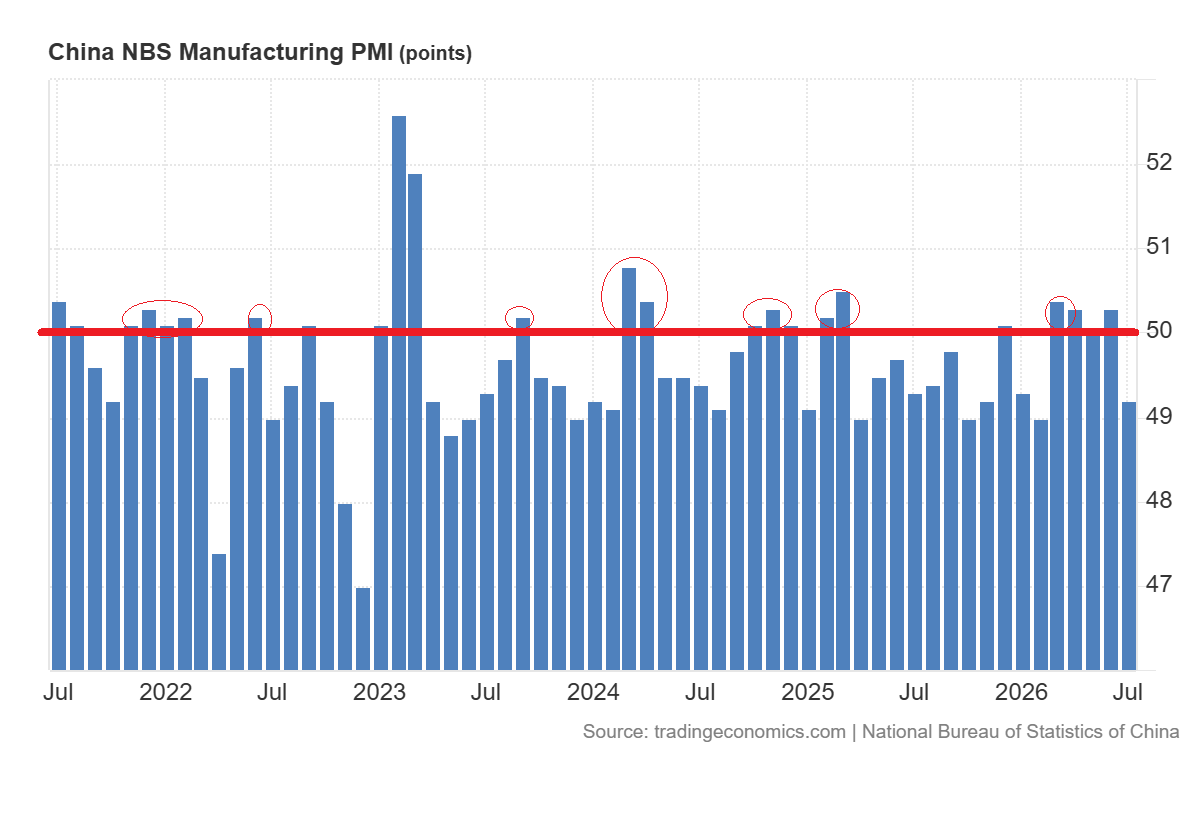
The chart below shows that the official NBS Manufacturing PMI dropped from 50.3 in June to 49.2 in July. This was first contraction since February. The factory output also dropped to 49.9.
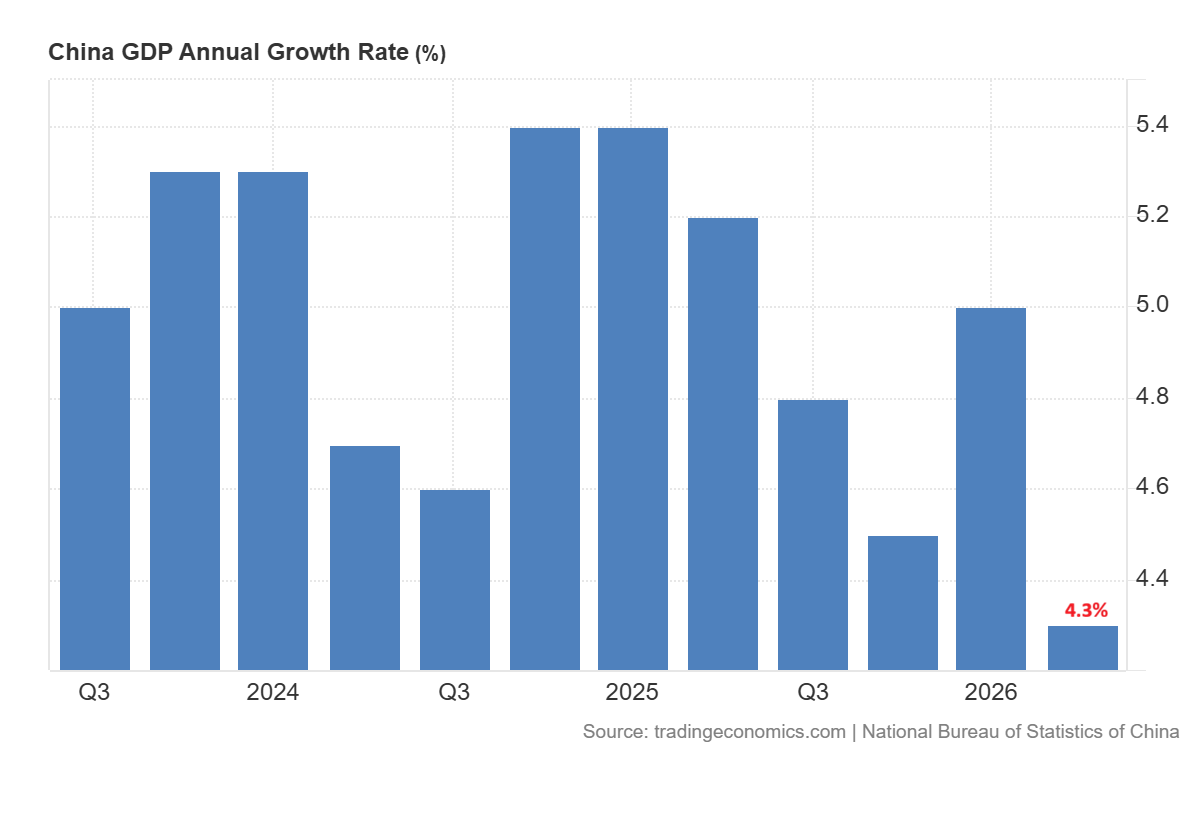
Meanwhile, the economy of China expanded by 4.3% YoY in Q2 as compared to 5% in Q1.
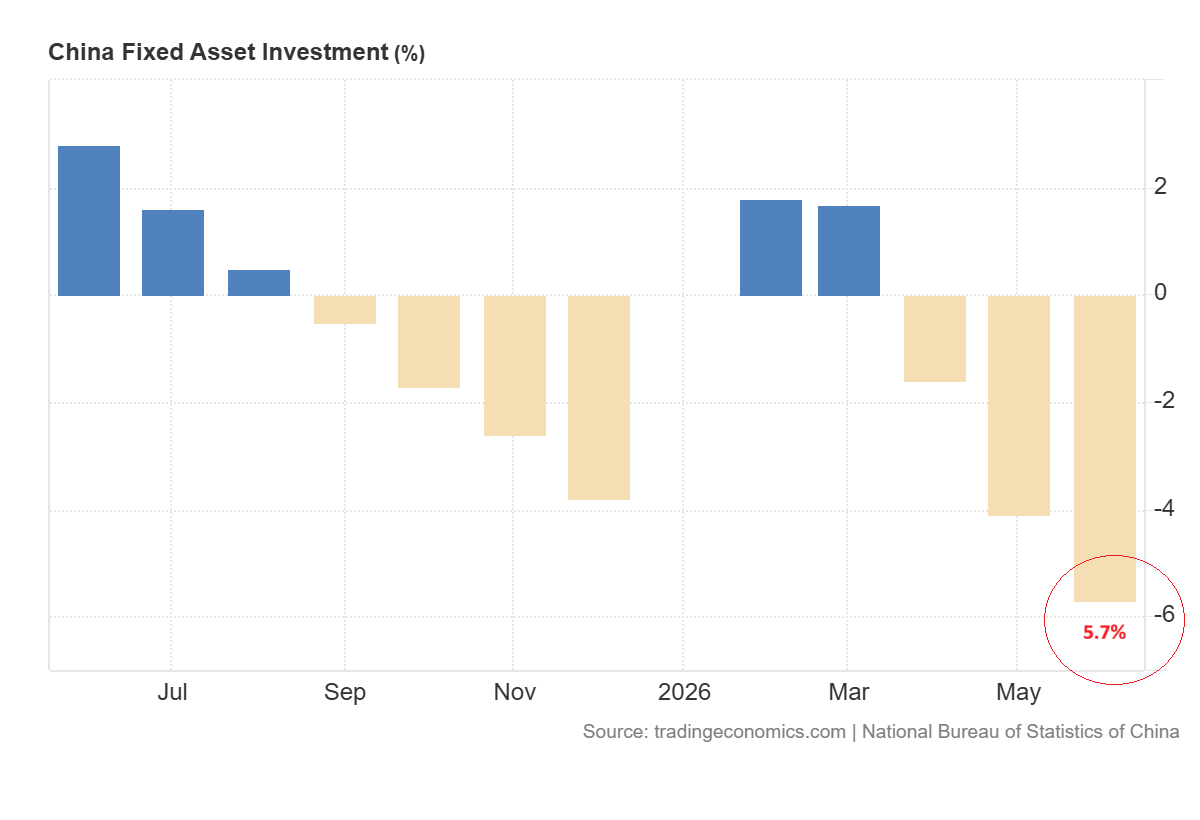
The investment in fixed assets has also dropped by 5.7% during the H1 2026. The investment in infrastructure fell 2.4% and property investment dropped 18%. This data suggests the lower demand from construction and traditional sectors.
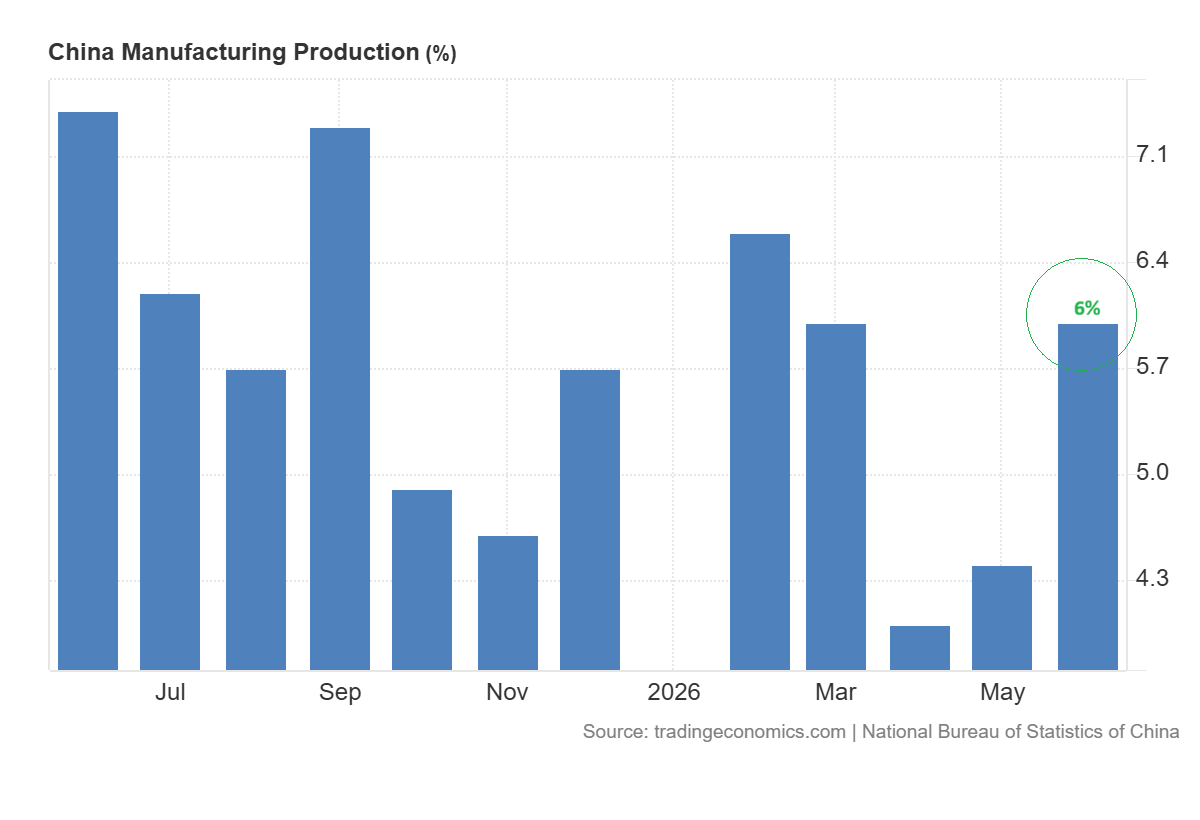
But the manufacturing production rose 6% in June. The Chinese government also wants to step up its bond spending and fiscal spending. Yet it has not made a big announcement for a big stimulus package. The mix could help maintain the copper and lithium volatiles in the short term. Uranium might be less sensitive to this as its demand depends more on the long term utility agreements and the nuclear capacity.
Copper Price Forecast
Every new Copper analysis as it publishes, today's technical signal and key levels, live price — on one page.
See all Copper forecastsUS Data and Fed Policy Drive Commodity Volatility
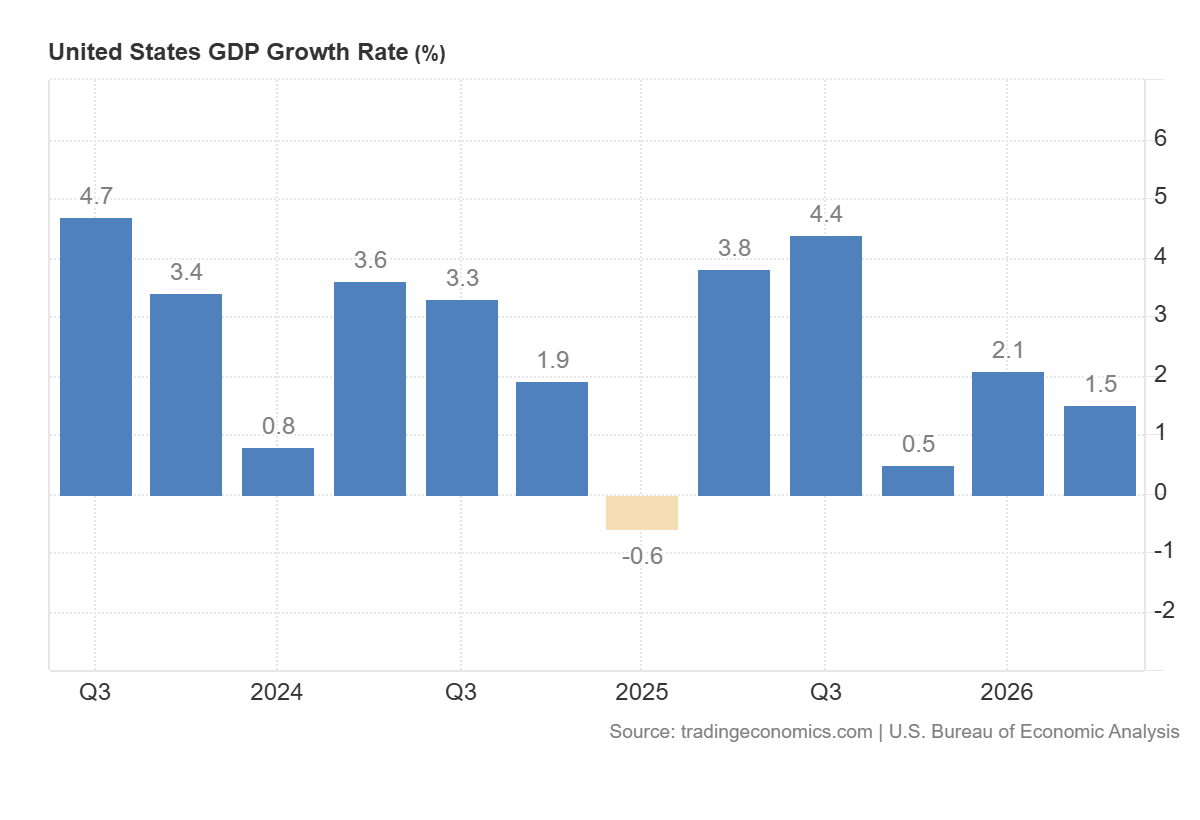
The latest US data also sends mixed messages. The US economy expanded at a tepid 1.5% in Q2 which is down from 2.1% in Q1. But there was 15.2% increase in business investment in equipment. This means that investments in AI and data infrastructure are holding up despite the relatively slow headline growth.
The Federal Reserve voted to leave interest rates at 3.50%-3.75%, but three members voted for a quarter point hike. This division allows a September rate hike to remain an option.
At the same time, the core PCE price index increased by only 0.1% in June, down from 0.3% in May. The rate also dragged down from 3.4% to 3.3% a year. The US dollar index dropped on Thursday but remains well above the 100 mark. A falling dollar supports the dollar-priced copper and uranium. But if the markets begin to get excited about another rate hike, further gains may be limited.
Copper Price Forecast: Supply Shortage and Power Demand Support Prices
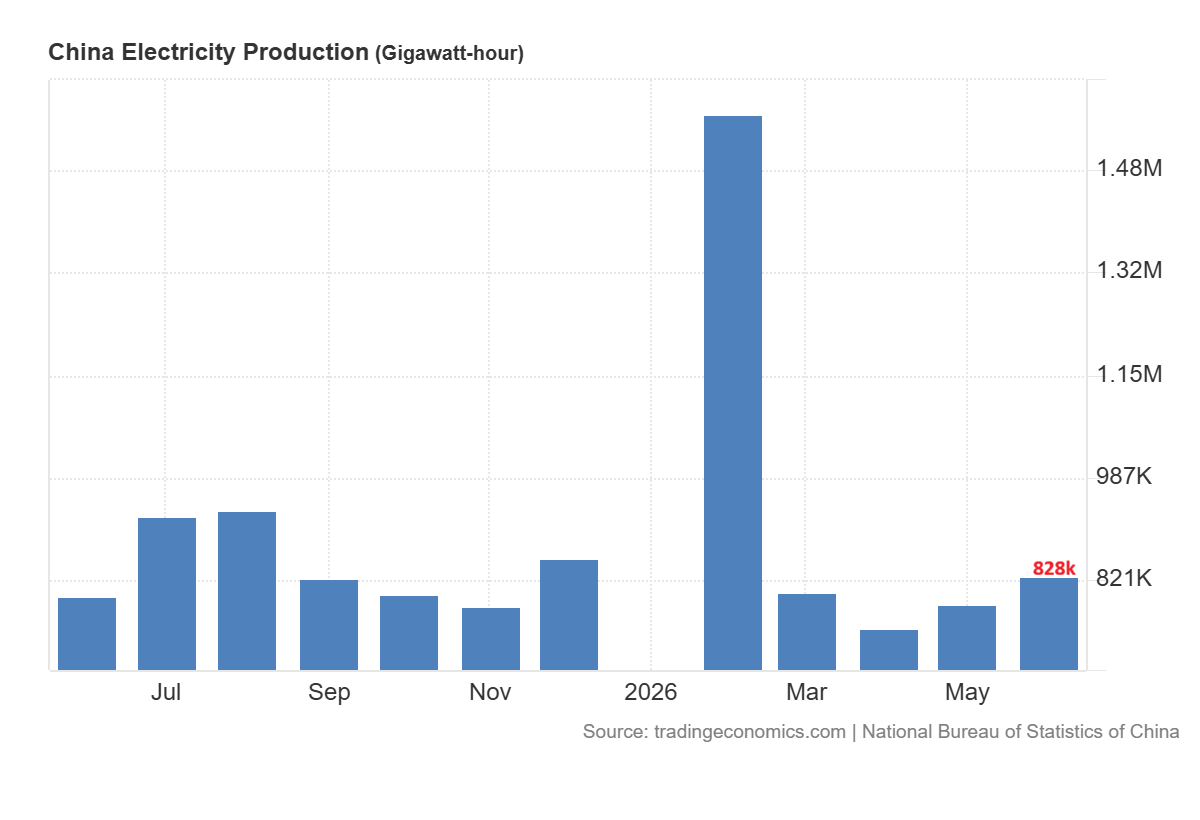
Copper is still supported by an increase in electricity demand and physical supply restrictions. In July, China’s electricity generation grew 4.6% from the previous month to 827,600 GWh.
In the first half of 2026, China’s coal energy share of power generation was also relatively low at 49.7% compared to 65.5% in 2016. Renewable energy offered 41.2% and wind and solar 24.6%. The copper has huge demand from the rising renewable power, electricity networks and data centers. This demand also increases the need for battery storage.
The physical copper market is also very tight. In 2025, US imports of refined copper rose 80% to 1.64 million tonnes and the first five months of 2026 saw a further 13% jump to 763,000 tonnes. That means that 58% of global copper in the form of visible stocks is now in the United States’ warehouses.
Shanghai inventories have declined from 433,458 tonnes in March to 69,610 tonnes while LME inventories have declined from over 400,000 tonnes in May to 262,000 tonnes. This change may help in sustaining copper prices but the final US tariff decision may lead to high volatility.
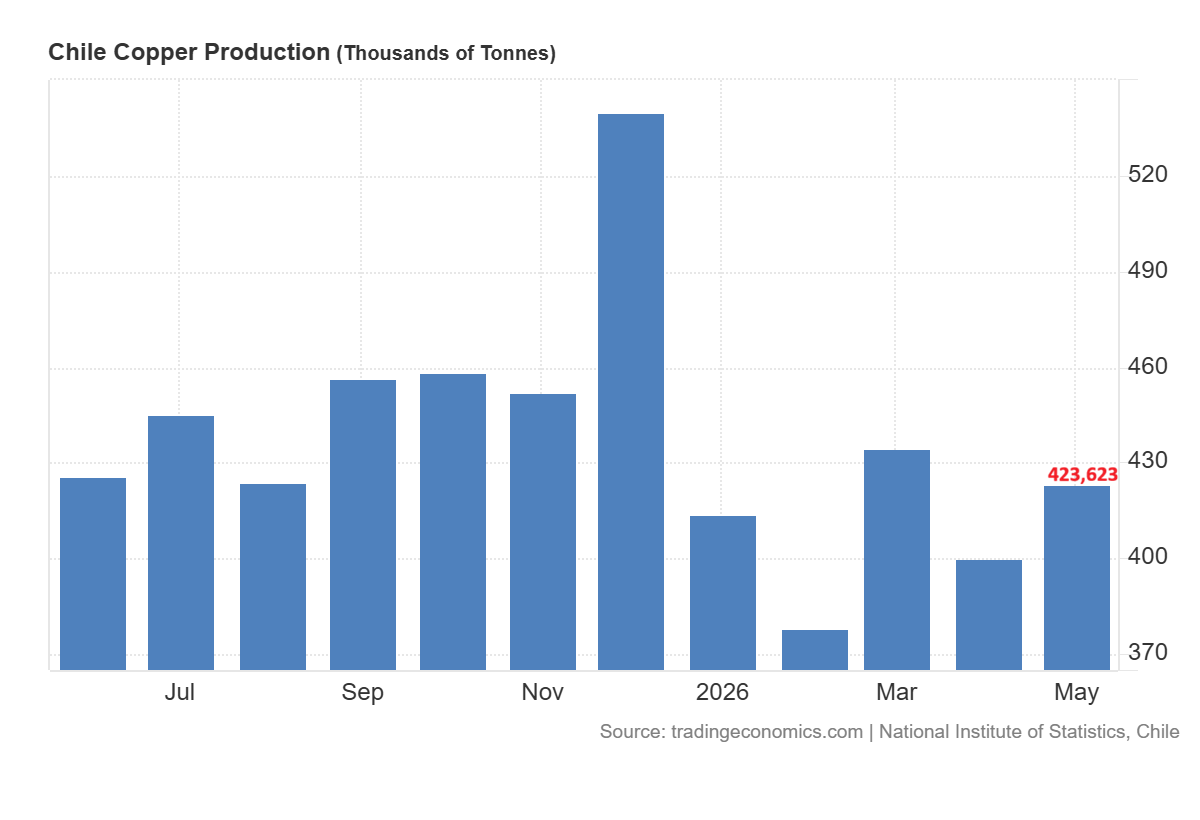
Moreover, the supply is also low from Chile. The latest available data show that production fell by 12.9% year on year to 423,623 tonnes in May.
Copper Technical Analysis: Bullish Setup Targets Further Gains
From technical perspective, the copper price has been consolidating in a strong bullish formation between $6.20 and $6.70. A break above $6.70 will open the door for a strong surge toward the $7 region. The formation of inverted head and shoulders patterns and then the strong consolidation indicate that copper prices are likely to surge during the next few months.
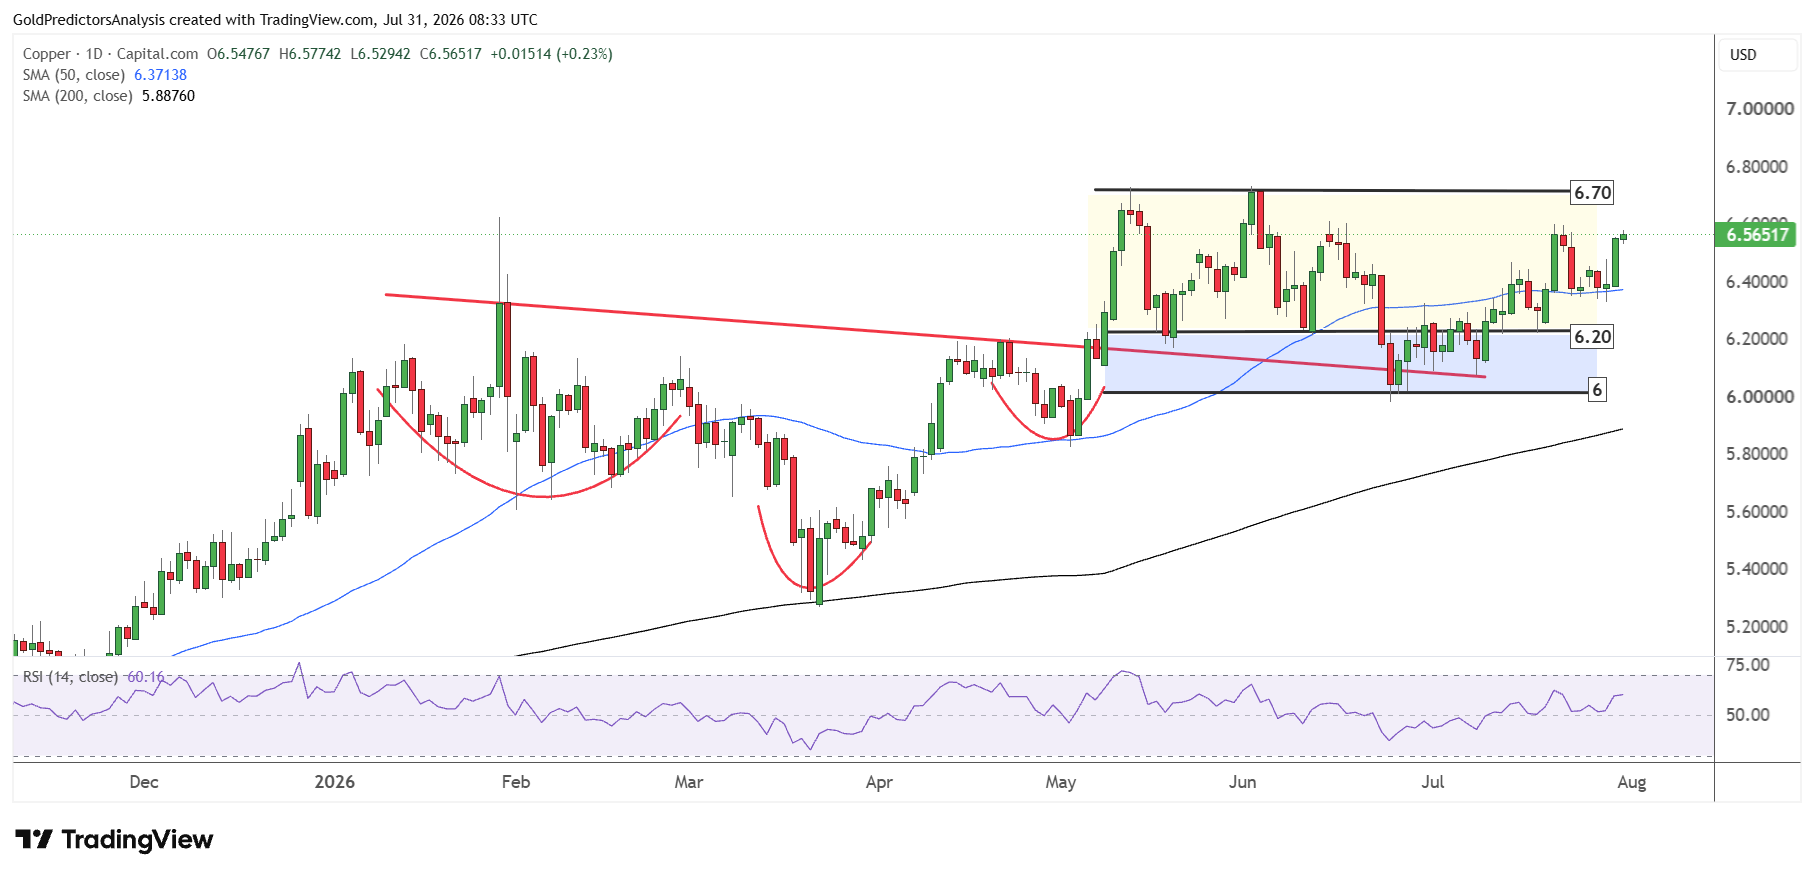
The RSI also remains above the midline, which highlights a positive trend. The price has already breached the 50-day SMA. This further indicates that the short term momentum in copper remains positive.
Lithium Price Forecast: Mine Restarts Weigh on Prices Despite Strong EV Demand
The lithium market faces the short term supply pressure but the demand indicators remain positive. The lithium carbonate price has dropped over 20% since the peak in 2026 but still remains well above the 2025 low. The demand side pressure for lithium is maintained.
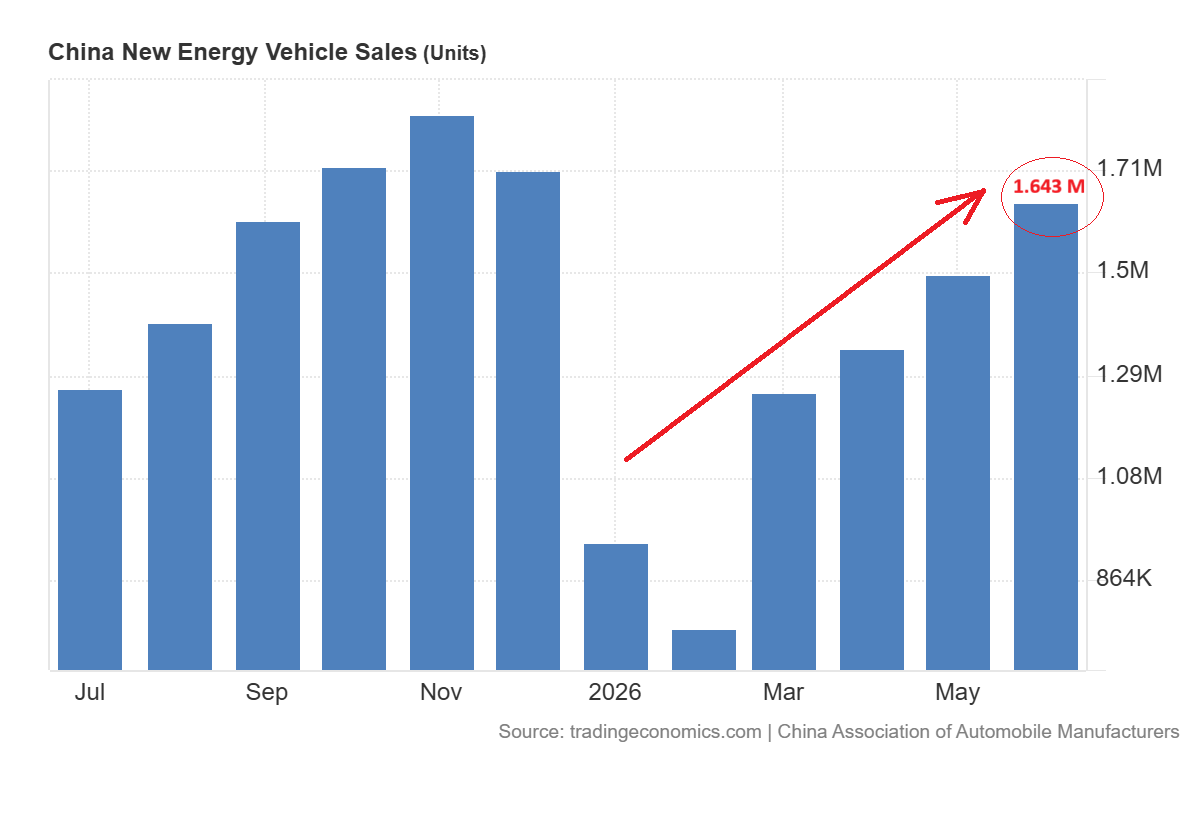
The chart below confirms that China sold 1.643 million new energy vehicles, an increase of 23.6% compared with the previous year. The sales of energy vehicles have been continuously increasing since February 2026.
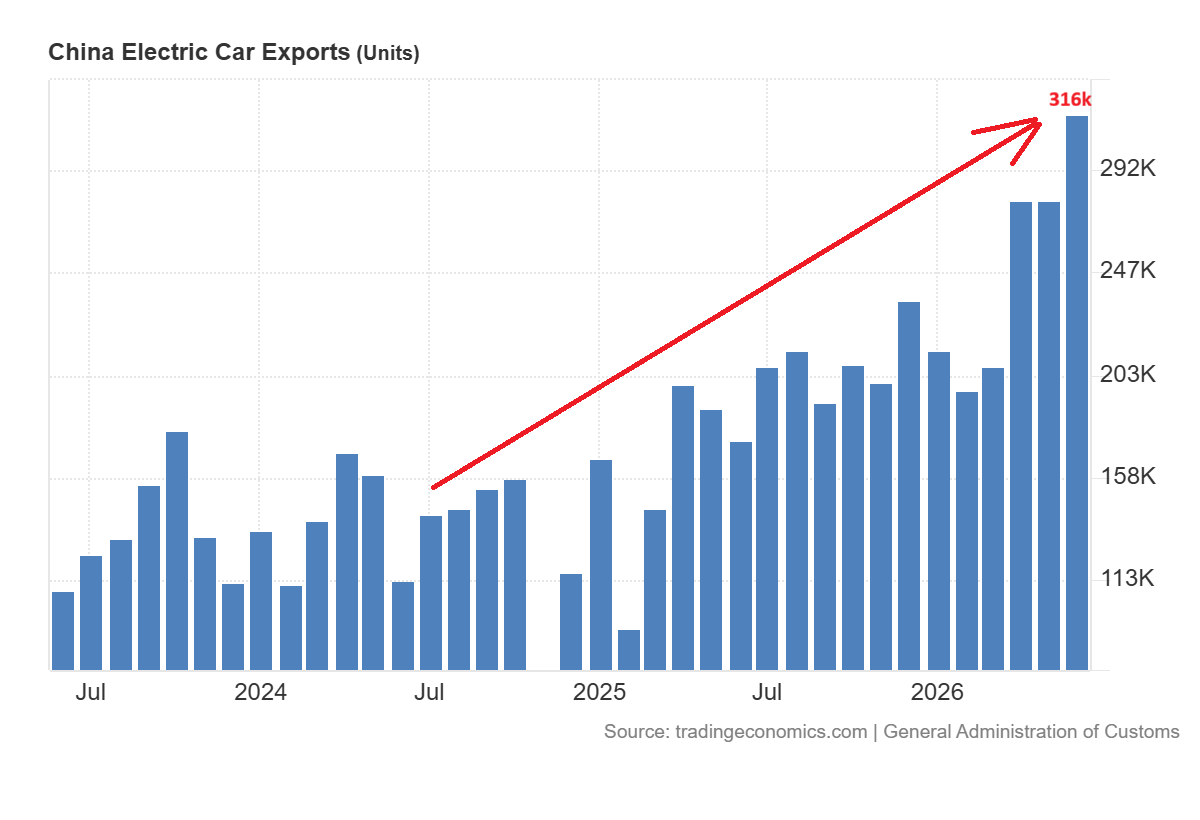
The electric car exports are also soaring, rising to a record 315,590 units in June as compared to 278,688 units in May. This trend has gained strength over the past three months following the US-Iran war as concerns about petrol and diesel have increased.
The other source of demand is battery storage. CATL’s battery storage revenue surged 88% to CNY 53 billion in the first half of 2026 and accounts for almost a quarter of the company’s revenue. But CATL has been given the right to resume its lithium mining operation at Jianxiawo.
The mine will have an annual production capacity of about 46,000 tonnes of lithium carbonate, which is about 3% of the estimated global demand in 2025. Bald Hill and Finniss are also reopening for production in Australia. This may maintain the pressure on lithium until the demand absorbs the extra supply.
Lithium Technical Analysis: Bearish Pressure Remains
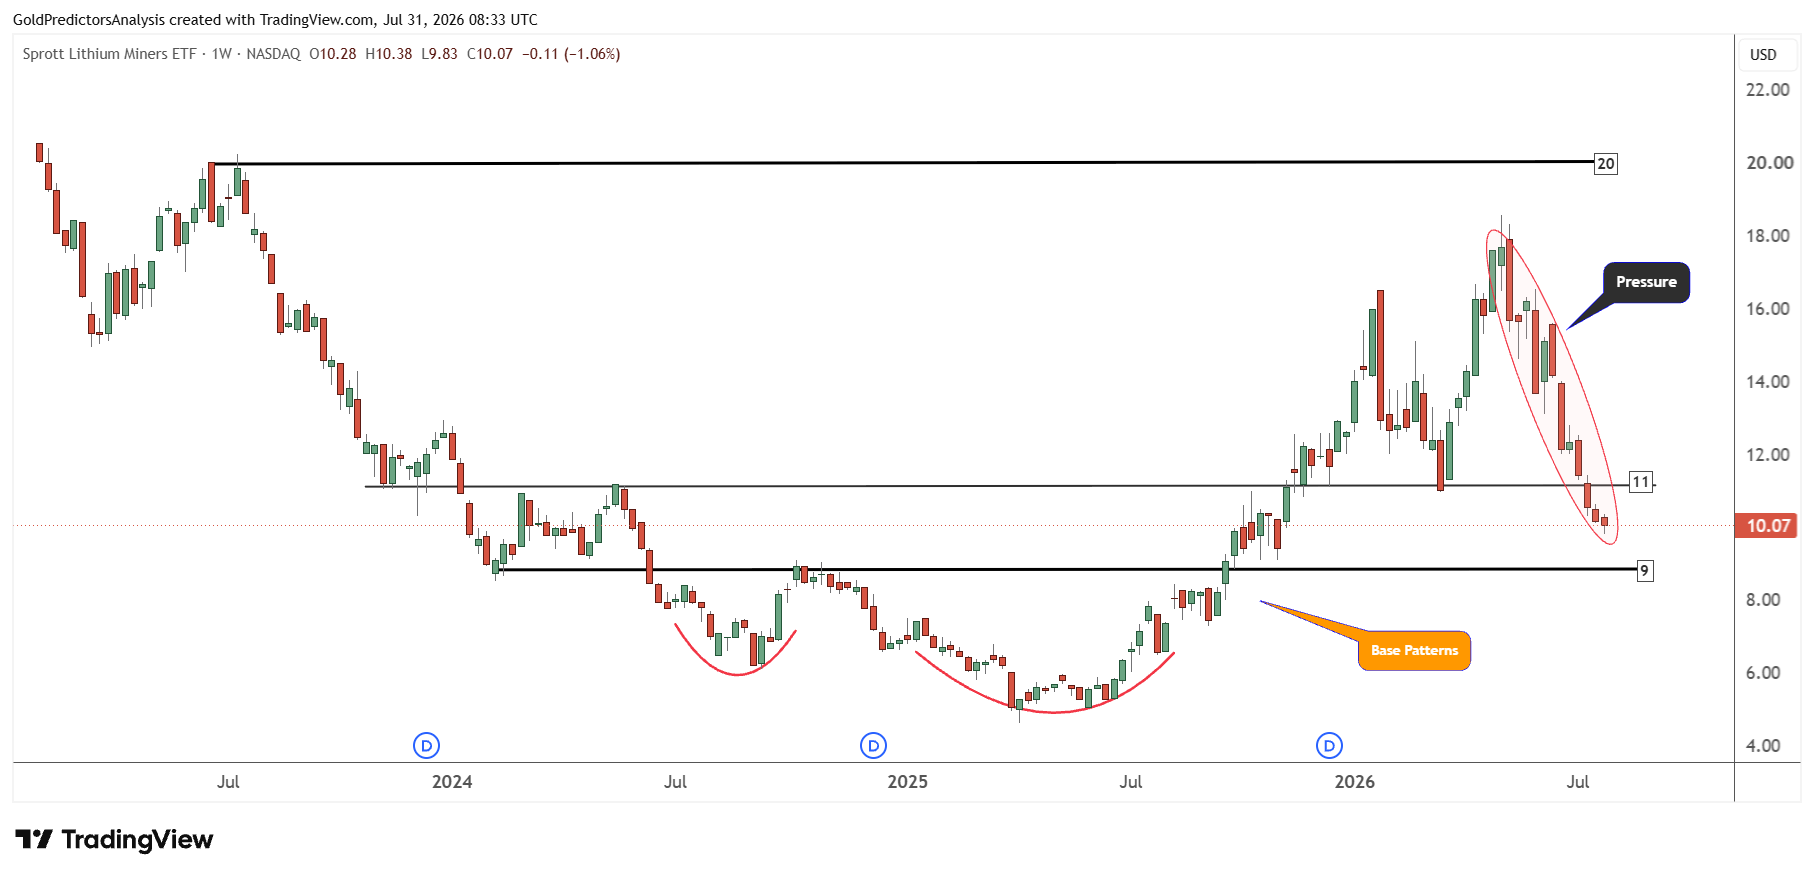
Lithium prices have remained under pressure since the peak on May 4, 2026. This weakness in the lithium market is observed using Sprott Lithium Miners, which shows that the price has already breached the $11 support.
A recovery above $11 will push prices higher. Despite this strong support, the lithium market remains under extreme bearish pressure as seen in the highlighted red shaded area.
Uranium Price Forecast: Nuclear Expansion Supports Long-Term Demand
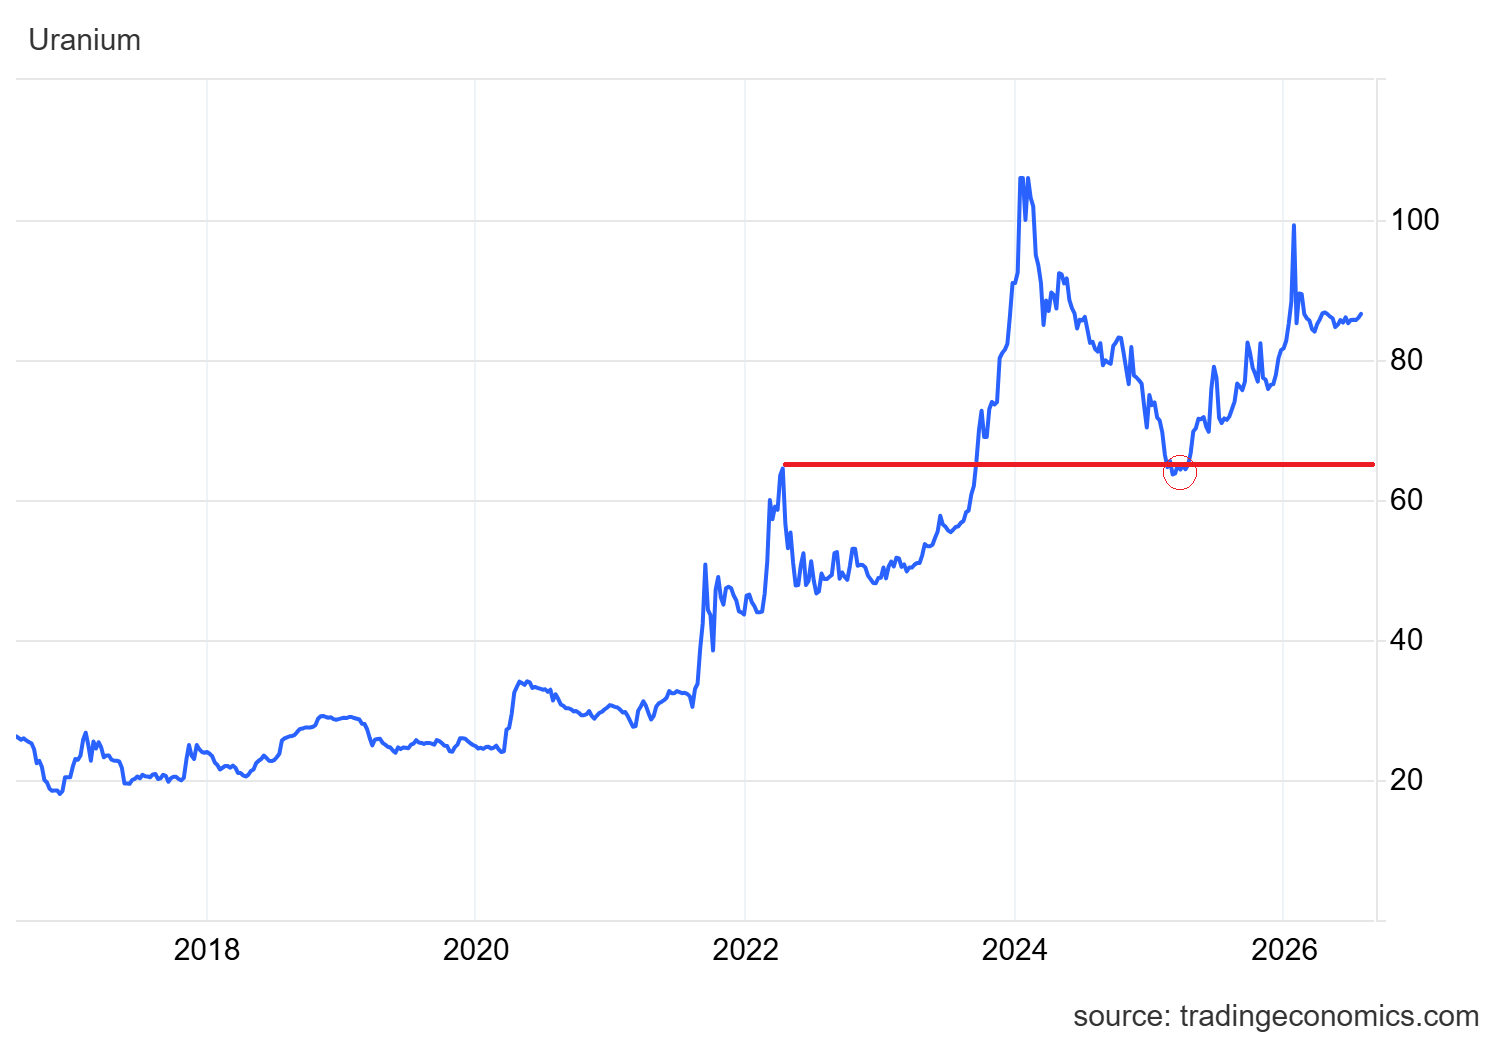
Uranium is more stable than lithium. The price stood at around $86.60/lb and remains over 20% above a year ago. The slowdown in short-term spot demand is due to many of the utilities having long term contracts in place. But the overall demand picture is good. According to the data from World Nuclear Association, 80 nuclear reactors are being built worldwide and 120 more are in the planning phase.
China aims to begin its commercial production of SMRs by the end of 2026. Cameco has restarted production at Cigar Lake and confirmed it would keep its 2026 production outlook of 17.5-18 million pounds. This has reduced the immediate supply concerns. But Kazakhstan’s proposed 10% production reduction could help to maintain the tightness in the long term uranium market.
Uranium Technical Analysis: Key Support Signals a Rebound
Uranium prices have remained in a strong bullish trend since the bottom in 2020. The recent surge in uranium prices in 2025 pushed prices toward the $100 area. However, the recent recovery in 2026 is attempting to form a bottom and is ready to move higher again.
The strength in the uranium market and the importance of the current support region are further observed using the uranium equity basket as shown in the chart below.
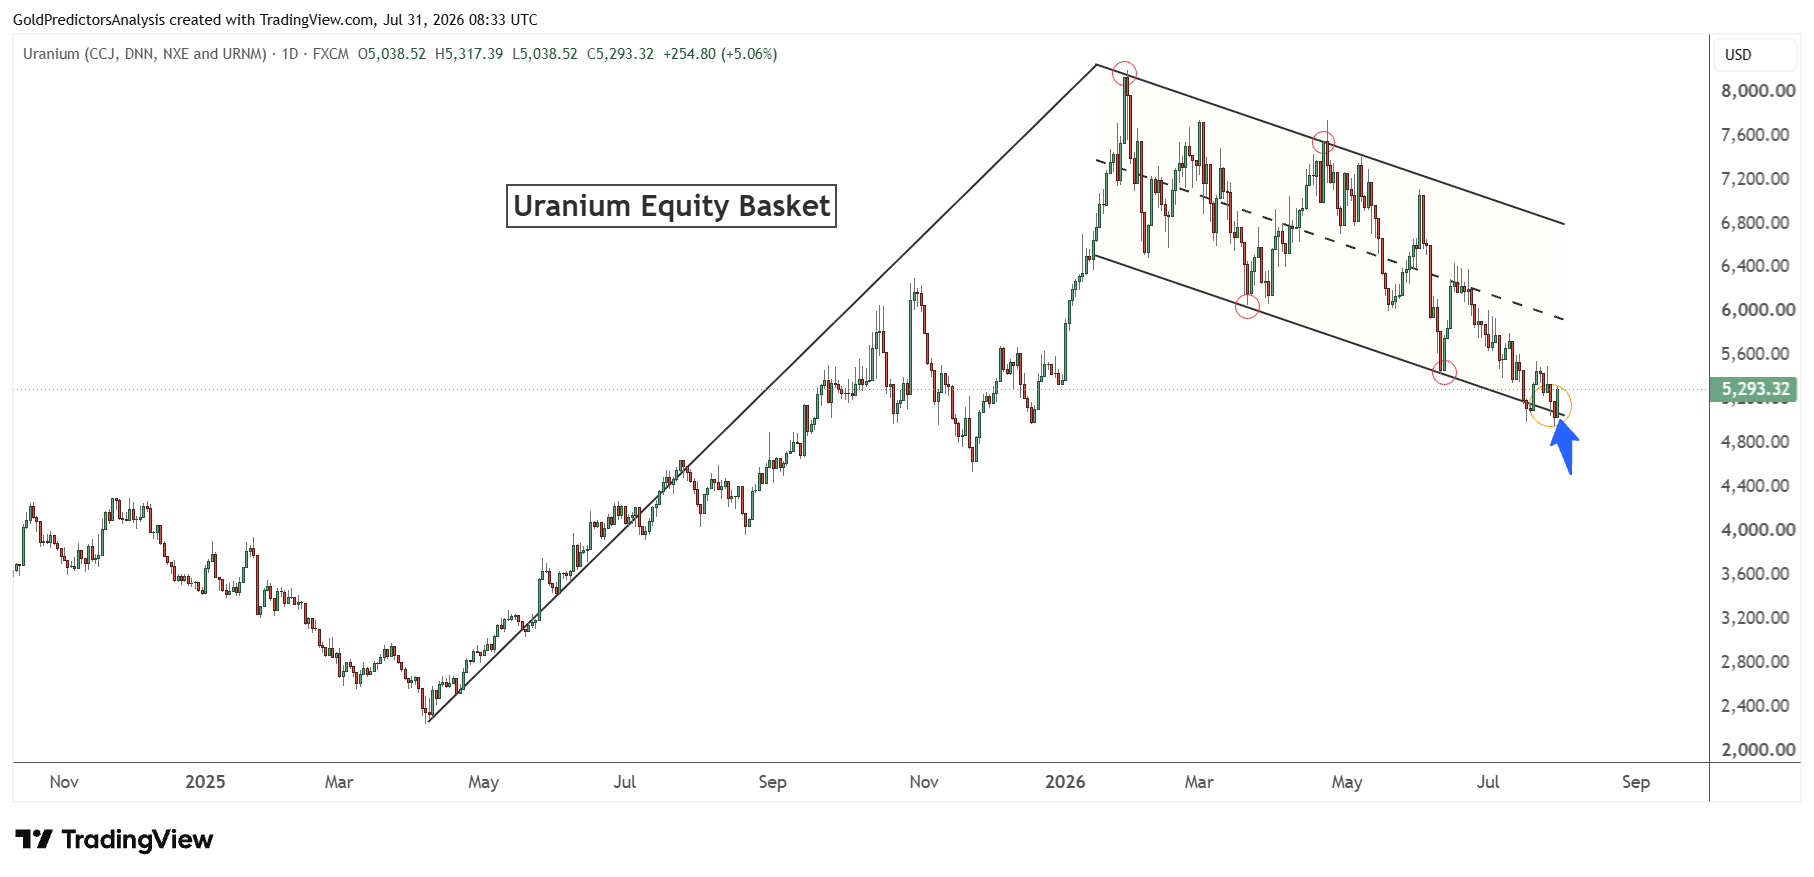
The prices have reached the lower boundary of support near the 5,000 level, as discussed in the previous analysis. The price is now forming support and initiating a rebound from the current region. If the price recovers above the 6,900 level, it will likely confirm a bottom in the uranium market and initiate another surge.
What is Next?
Copper, lithium and uranium face different short term conditions. Copper retains the strongest outlook because tight inventories, weak Chilean supply, power infrastructure demand and bullish technical momentum support higher prices. A break above $6.70 could open the way toward the $7 region.
Lithium remains under pressure as mine restarts increase supply but the strong electric vehicle exports and battery storage demand may limit the downside. Uranium has a more stable long term outlook as reactor construction continues to support demand. The technical structure for uranium is also more bullish as compared to the lithium and copper markets due to the consecutive rallies on each correction during the past ten years.
The slowdown in China and the possibility of Fed rate hike may keep all three markets volatile in the short term. But the weaker US dollar, rising electricity demand and continued investment in AI, renewable energy and nuclear power provide the long term positive support for these commodities.
Read more: Copper, Uranium and Lithium Forecast: Bearish Pressure Builds Before the Next Rally