


Copper (XCU) has pulled back from the recent high near $6.95, despite the drop in inventories in China. US Treasury yields have broken above 5%, which makes it harder for metals to rally in the short term. Uranium has a stronger demand outlook in the long term as Italy and Poland advance nuclear plans, but uranium ETFs remain weak in the short term. On the other hand, lithium also faces mixed signals from the EV market in China. This article presents the developments and key price levels that could shape the next move in copper, uranium and lithium.
Copper Outlook: Escondida Restarts as China Inventories Fall
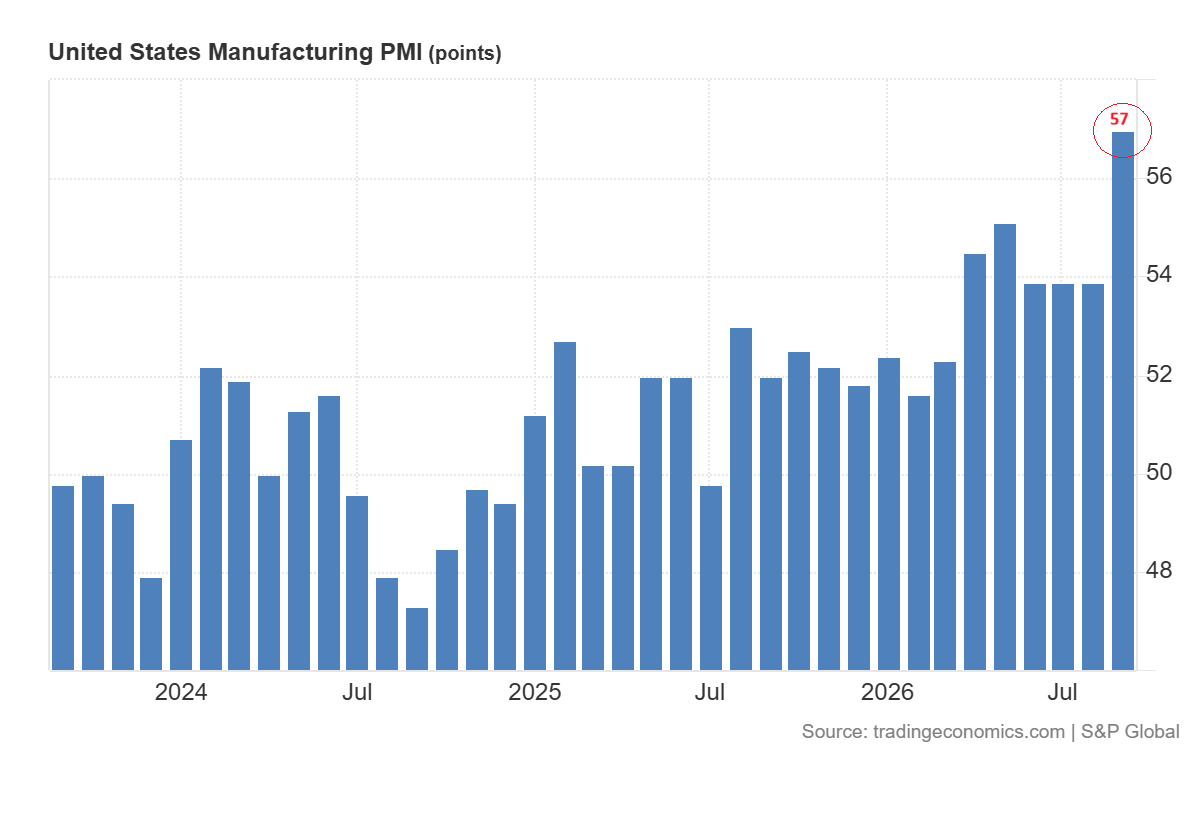
The factory activity in the US strengthened in September. The S&P Global manufacturing PMI increased to 57.0 from 53.9 in August. The strength in new orders suggests strong demand for industries, but businesses also reported an increase in costs.
Treasury yields moved above 5%, which increases the risk of further tightening by the Fed. The increase in costs of borrowing could weigh on the demand for metals. The trade truce between the US and China has been extended to January 10, 2027. This eases the immediate trade risk without settling longer-term tensions.
Copper faces a fresh supply test. Escondida is the largest copper mine in the world, which stopped working after fatal accident on September 23. It began a gradual restart the next day but the amount of lost output remains unclear.
In China, Shanghai Metals Market reported that inventories across major regions dropped by 16,500 tonnes in a week to about 70,000 tonnes. That tight supply supports copper but the latest survey found that high prices were already discouraging new orders from copper rod buyers. A faster mine restart or weaker buying after the holiday could limit the gains in copper.
Copper Price Forecast
Every new Copper analysis as it publishes, today's technical signal and key levels, live price — on one page.
See all Copper forecastsNuclear Plans Support Uranium Demand as Lithium Awaits Stronger EV Sales.
Uranium received two signals of future demand. The Senate of Italy approved a framework for the country’s return to nuclear power on September 23. Westinghouse, Bechtel and Poland’s PEJ agreed on the main commercial terms for the planned three-reactor plant in Poland.
Italy must still develop the nuclear rules while the Polish partners must finish their construction contract. Both steps improve the case for uranium demand in the long term. But it does not represent an immediate fuel purchase.
Lithium has a more mixed outlook. The new energy vehicle retail sales in China reached 596,000, down 9% from a year earlier. But the wholesale shipments rose 8% to 740,000. Battery demand may benefit from higher factory shipments but weaker sales to drivers could leave vehicles in inventory.
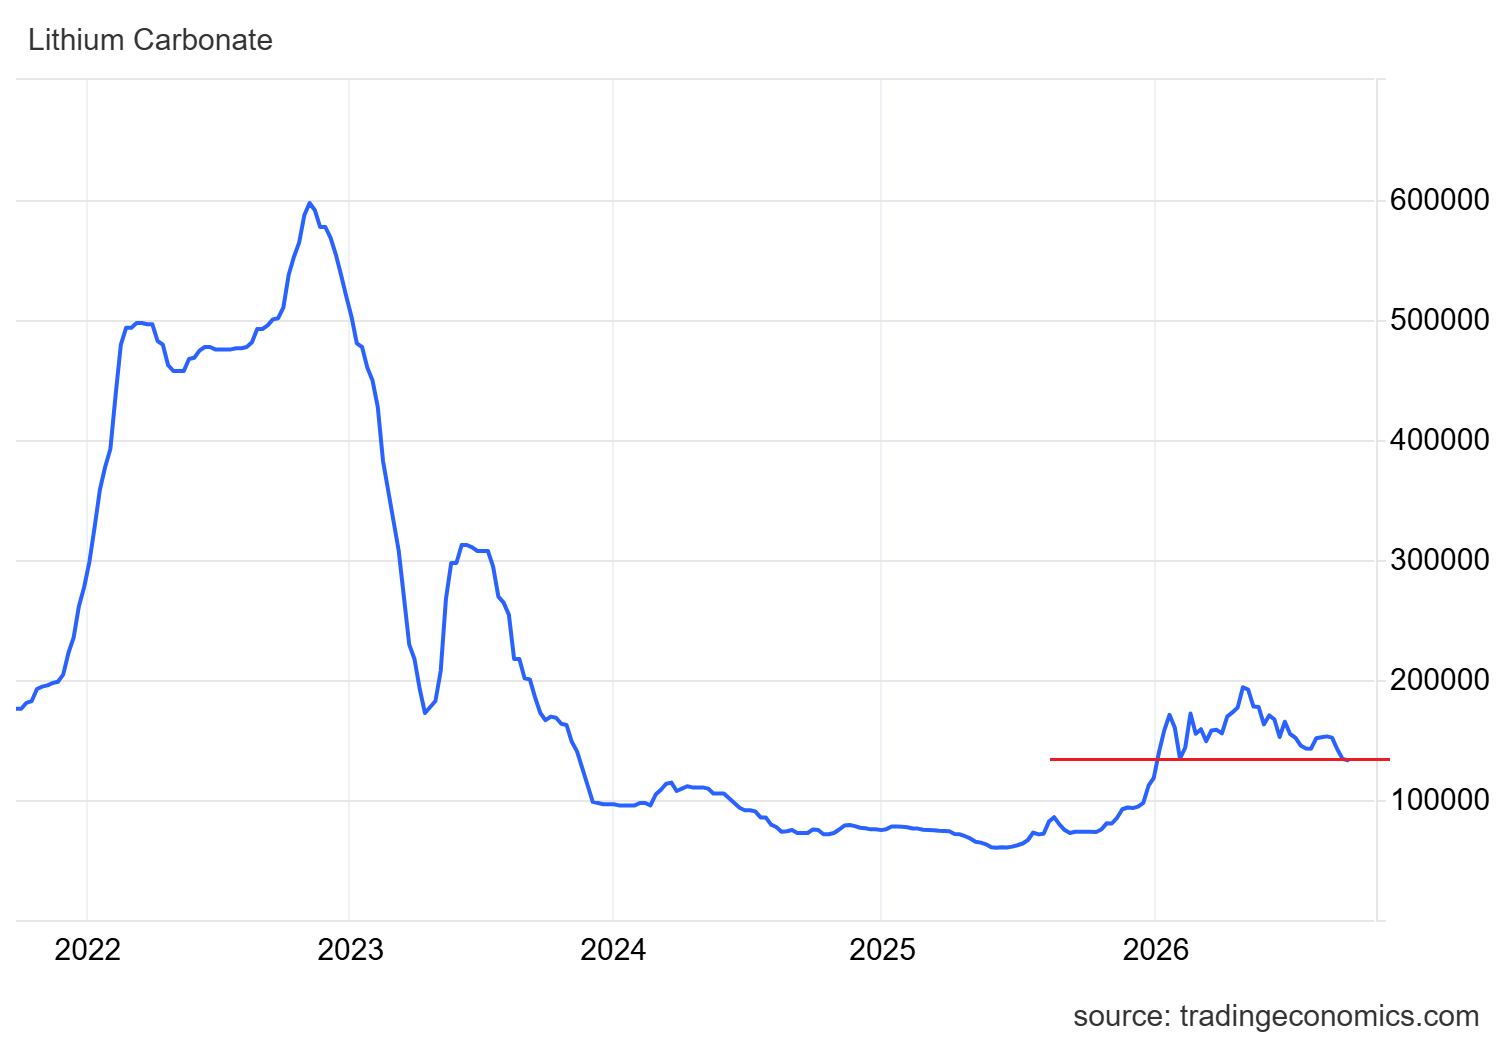
Shanghai Metals Market reported delays in spodumene deliveries and maintenance at some lithium processors on September 24. Battery makers bought on price dips. Lithium carbonate prices rose early in the week and then pulled back. The chart below shows that lithium carbonate prices trade at the key level of 133.150 CNY/T. In my view, stronger EV retail sales are needed to drive a recovery in lithium.
Copper Holds Above $6.60 as Prices Consolidate
The daily chart for copper prices shows that the price reached a high of $6.95 on September 22 and then dropped back toward the $6.77 level. The price has been consolidating within a rising wedge pattern and is looking for the next move. The significant support in copper remains at $6.60. A break below this level could trigger a drop toward the $6.30 area.
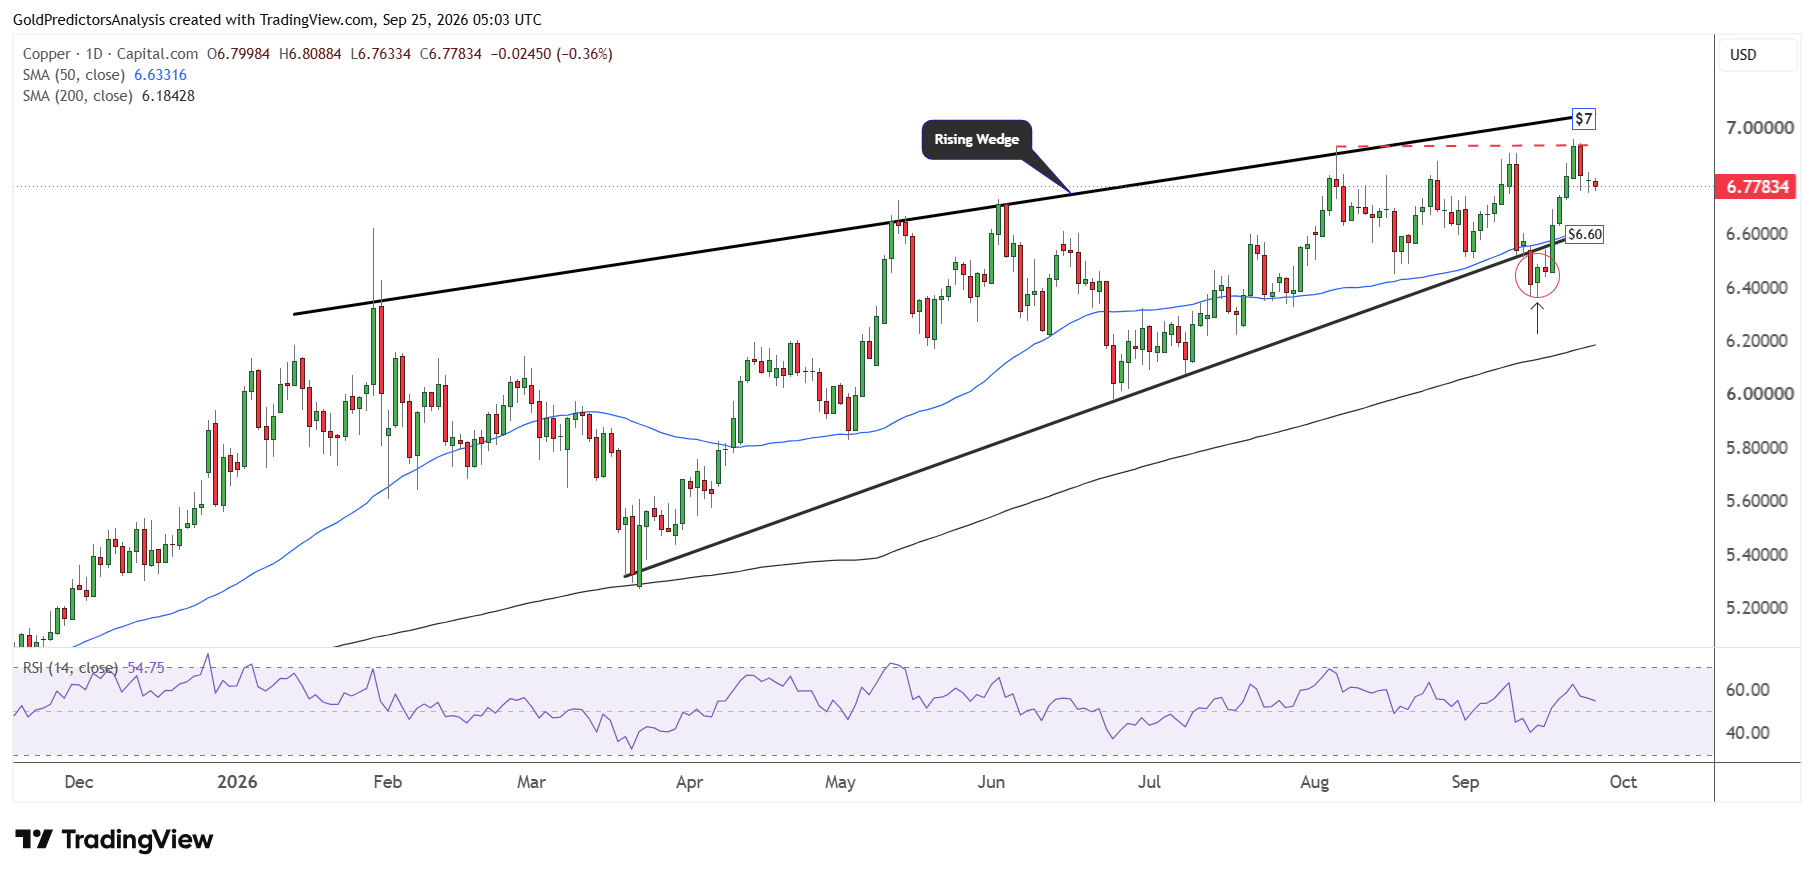
On the other hand, a break above $6.90 could trigger a quick rally toward the $7.10 area. The RSI remains above the midline and the price remains above the 50- and 200-day SMAs. This configuration indicates a positive trend in the short term despite the strong US dollar and Treasury yields.
The copper price may consolidate between $6.30 and $6.90 before finding the next direction.
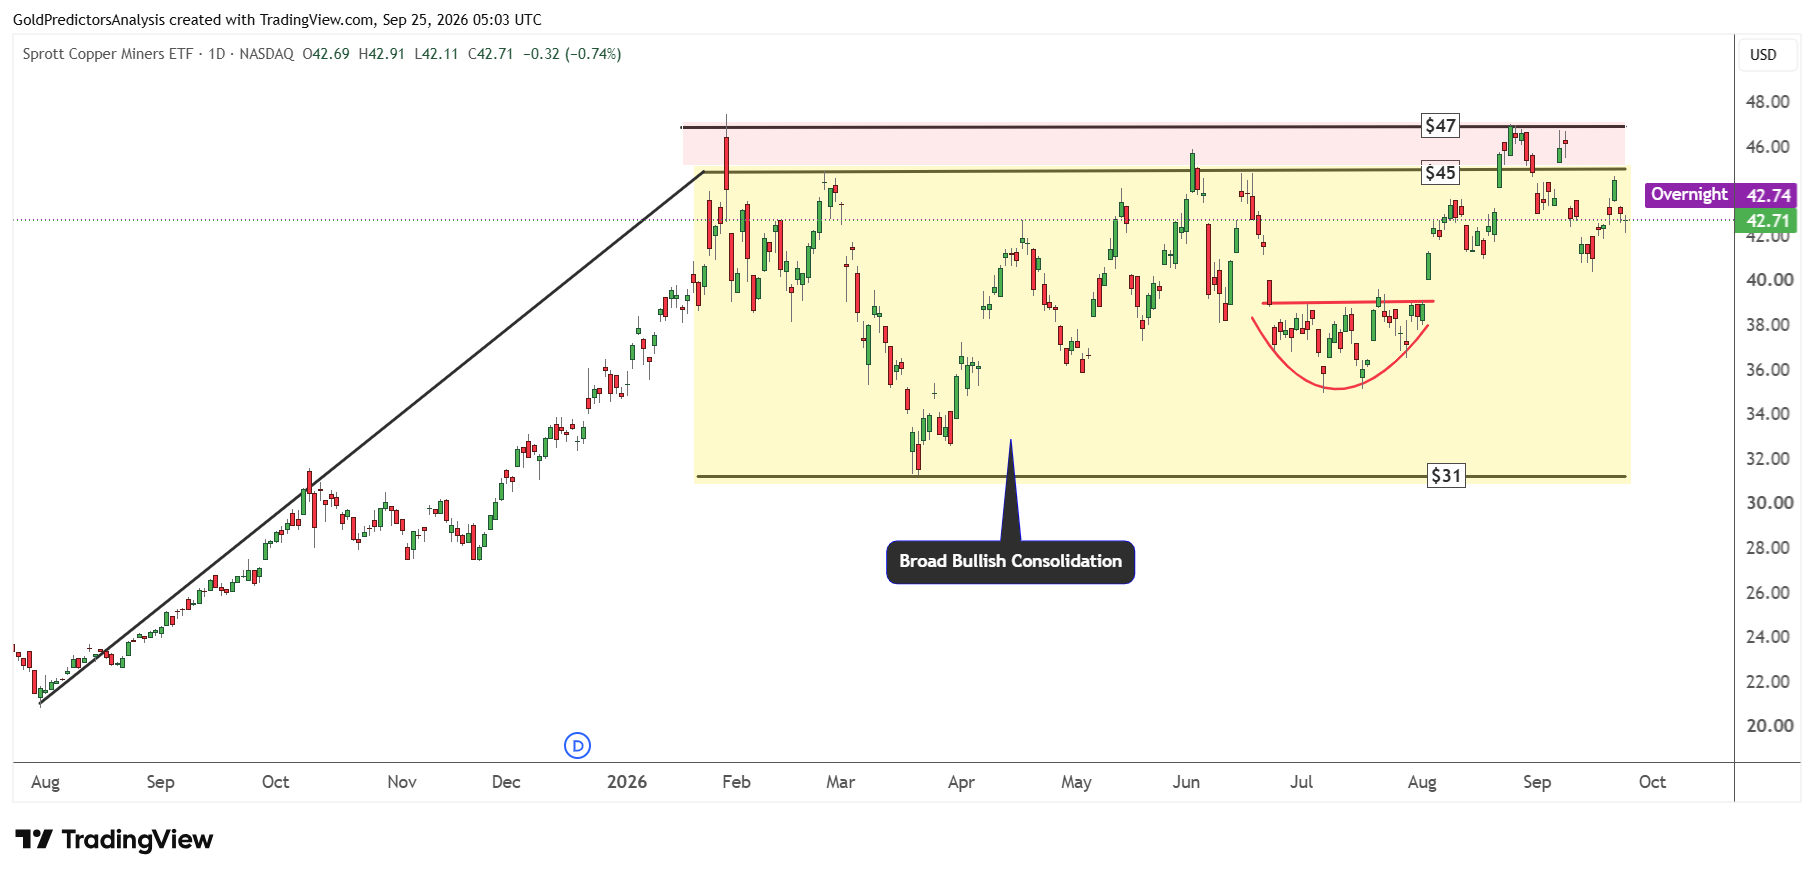
The Sprott Copper Miners ETF also shows constructive price action as the price has been consolidating between $31 and $45 since January 2026. But the overall price consolidation remains bullish and a break above $47 could trigger the next move.
Uranium ETFs Approach Key Support Levels
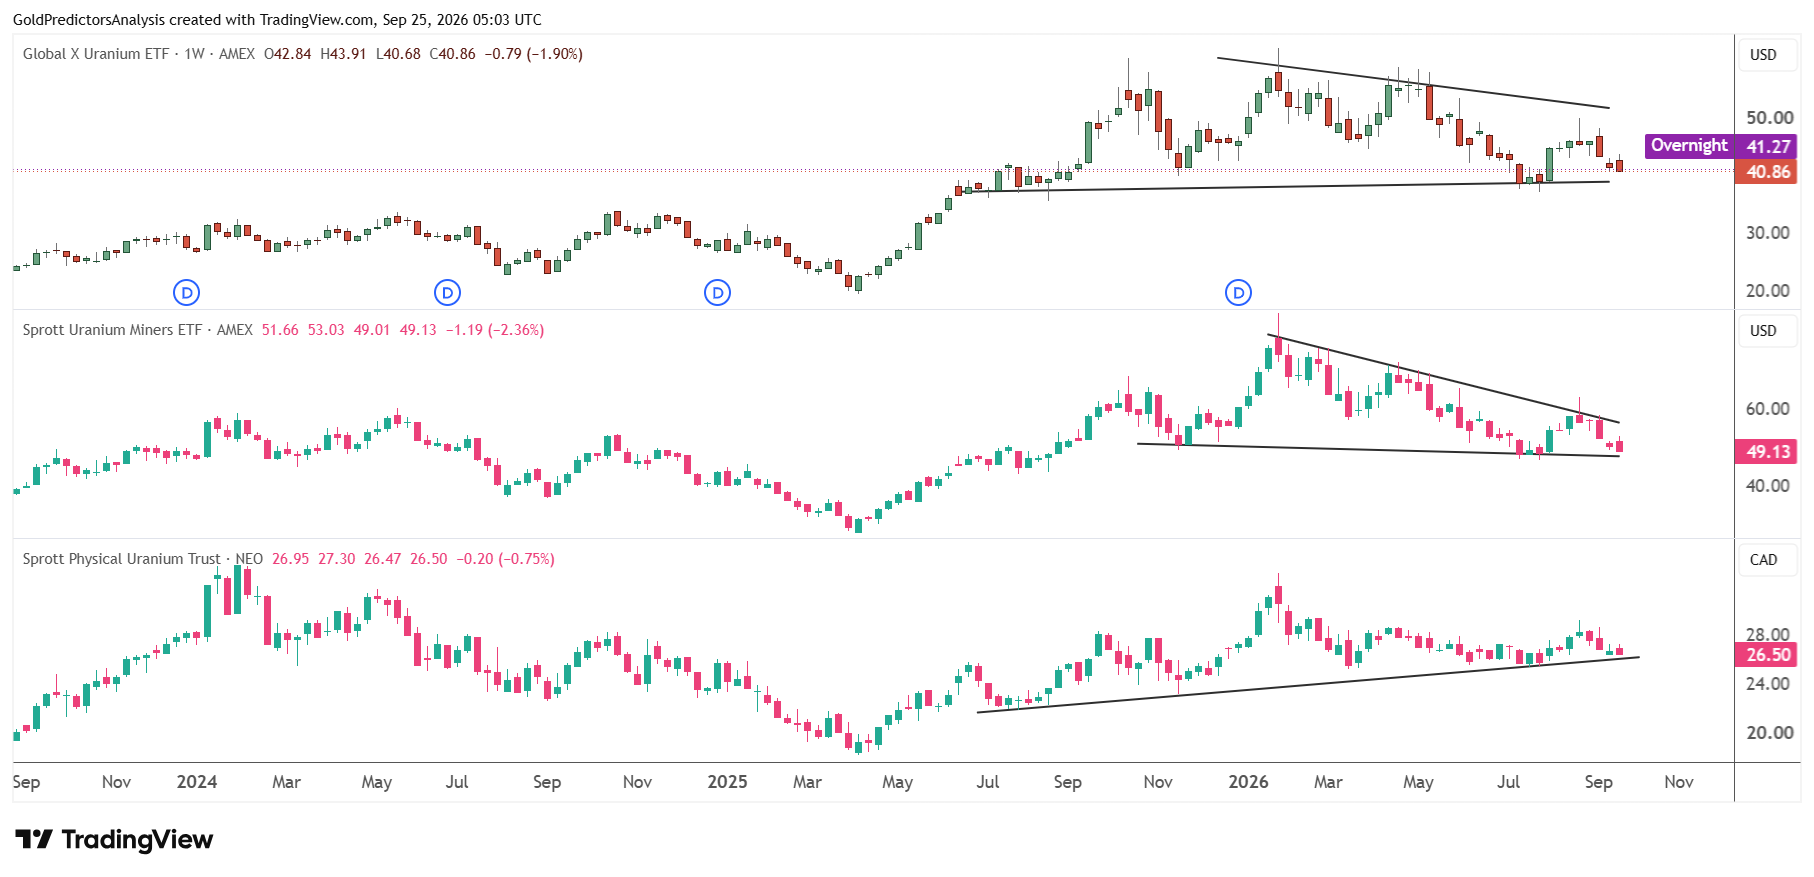
The uranium market remains in a bearish trend in the short term, as seen in the chart below. The Global X Uranium ETF is approaching the key support level of the triangle at around $37.50. A break below this level will likely trigger another strong drop toward the $34 area. On the other hand, a recovery above $51.50 is required to push the ETF price higher.
Similarly, the Sprott Uranium Miners ETF is approaching key support at $48. A break below this level will likely push the ETF price toward the $37.30 area. The ETF is trading within a triangle pattern and a break from this triangle is required to define the next move.
The Sprott Physical Uranium Trust is also approaching key support, defined by the ascending trend line that stretches from the July 2025 lows. A break below $26 will likely trigger another drop toward $23.50. On the other hand, a break above $29.50 will open the way for a rally toward the $35 area.
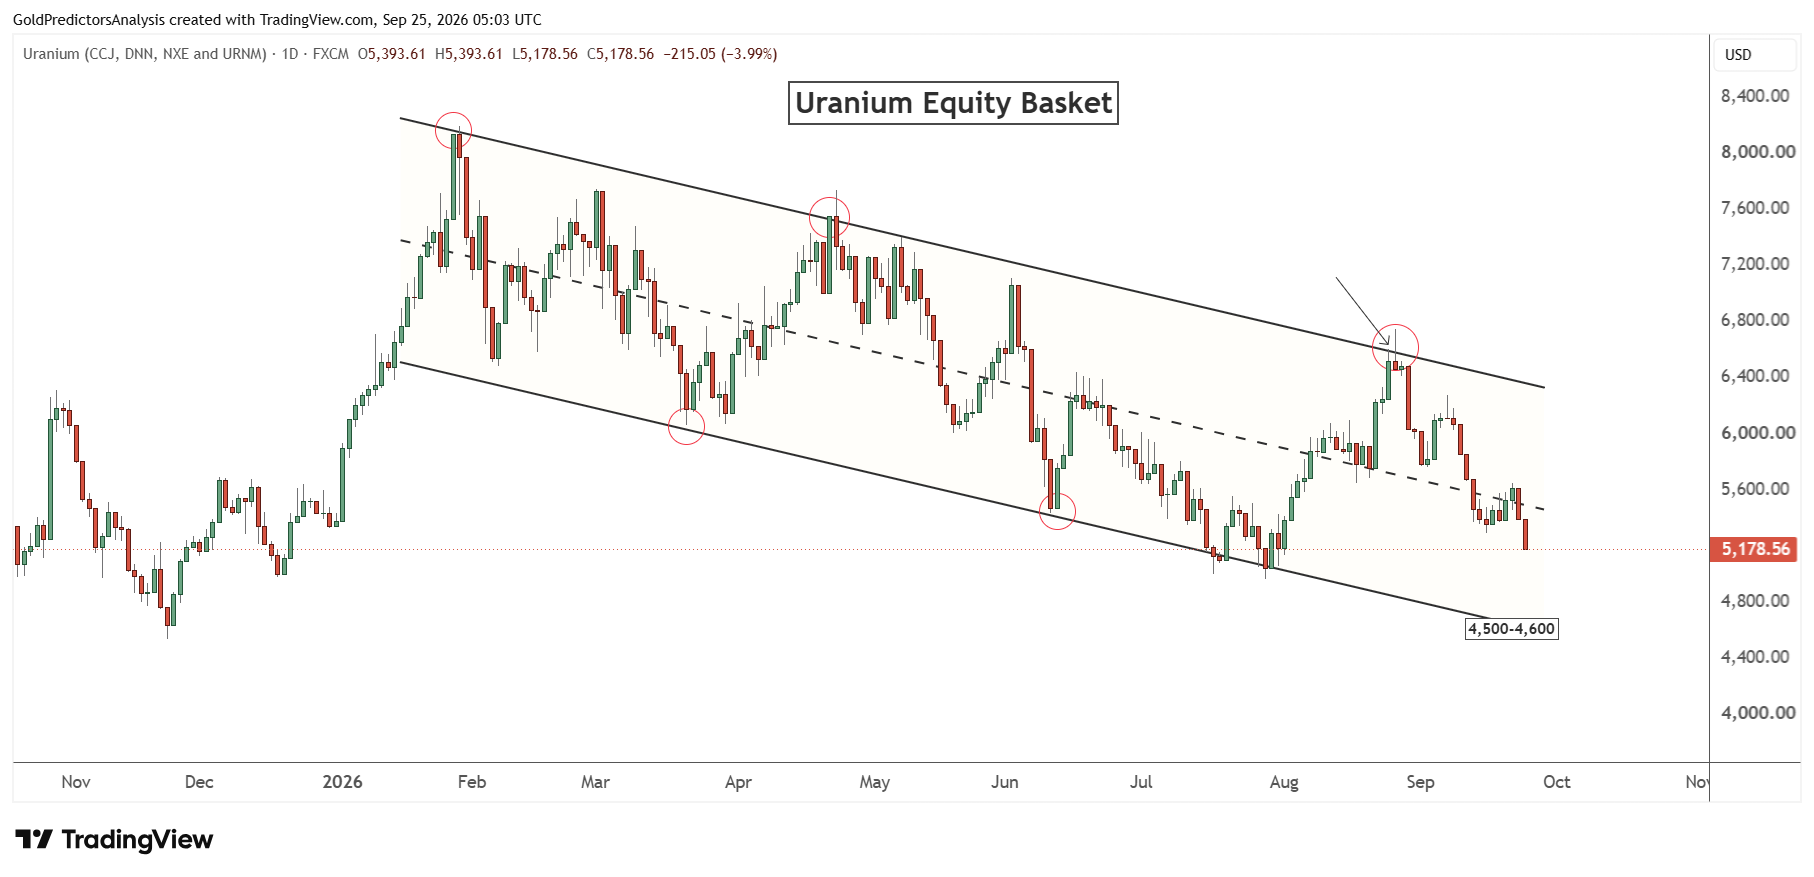
The uranium equity basket also remains in a negative trend after hitting strong resistance at $6,700. This resistance is defined by the descending channel pattern that stretches from the January 2026 highs.
The uranium equity basket is now looking for immediate support at $5,000. A break below $5,000 will open the way for another drop toward the $4,500-$4,600 area. But a strong recovery from this support is likely.
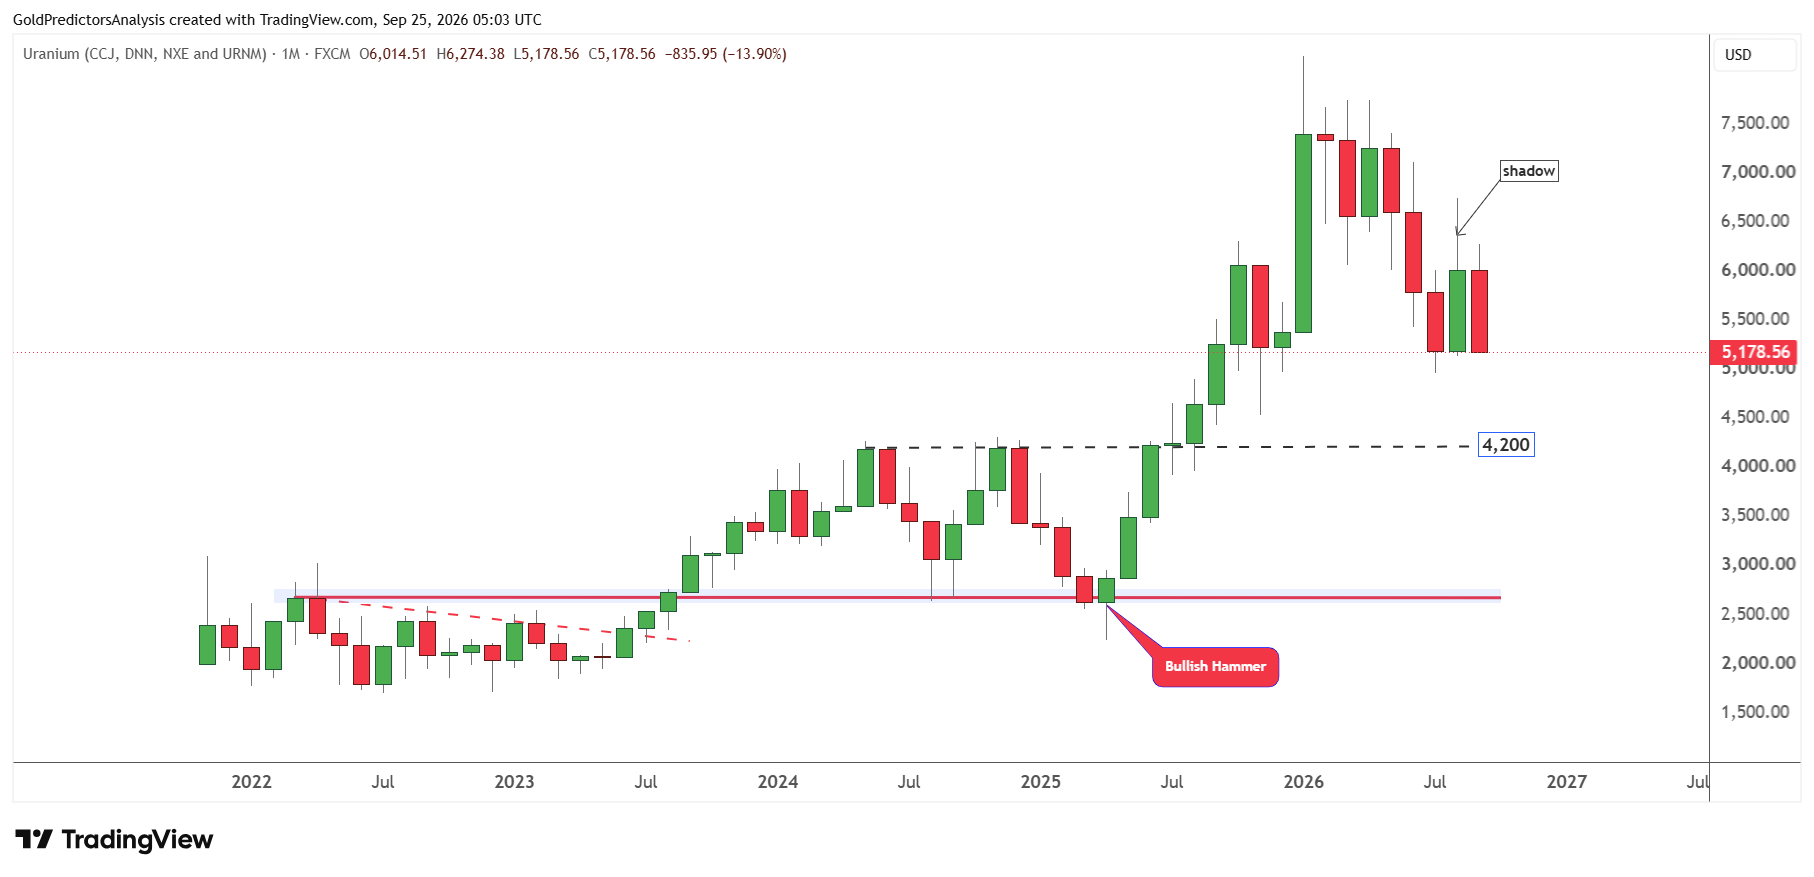
A break below $4,500 will trigger another strong drop toward long-term support at $4,200. This support is visible on the long-term monthly chart below and is marked by the November 2024 highs. The emergence of sharp shadows on the monthly candle of August 2026 suggests a strong negative trend in the uranium market.
Lithium ETFs Near Key Support as Selling Continues
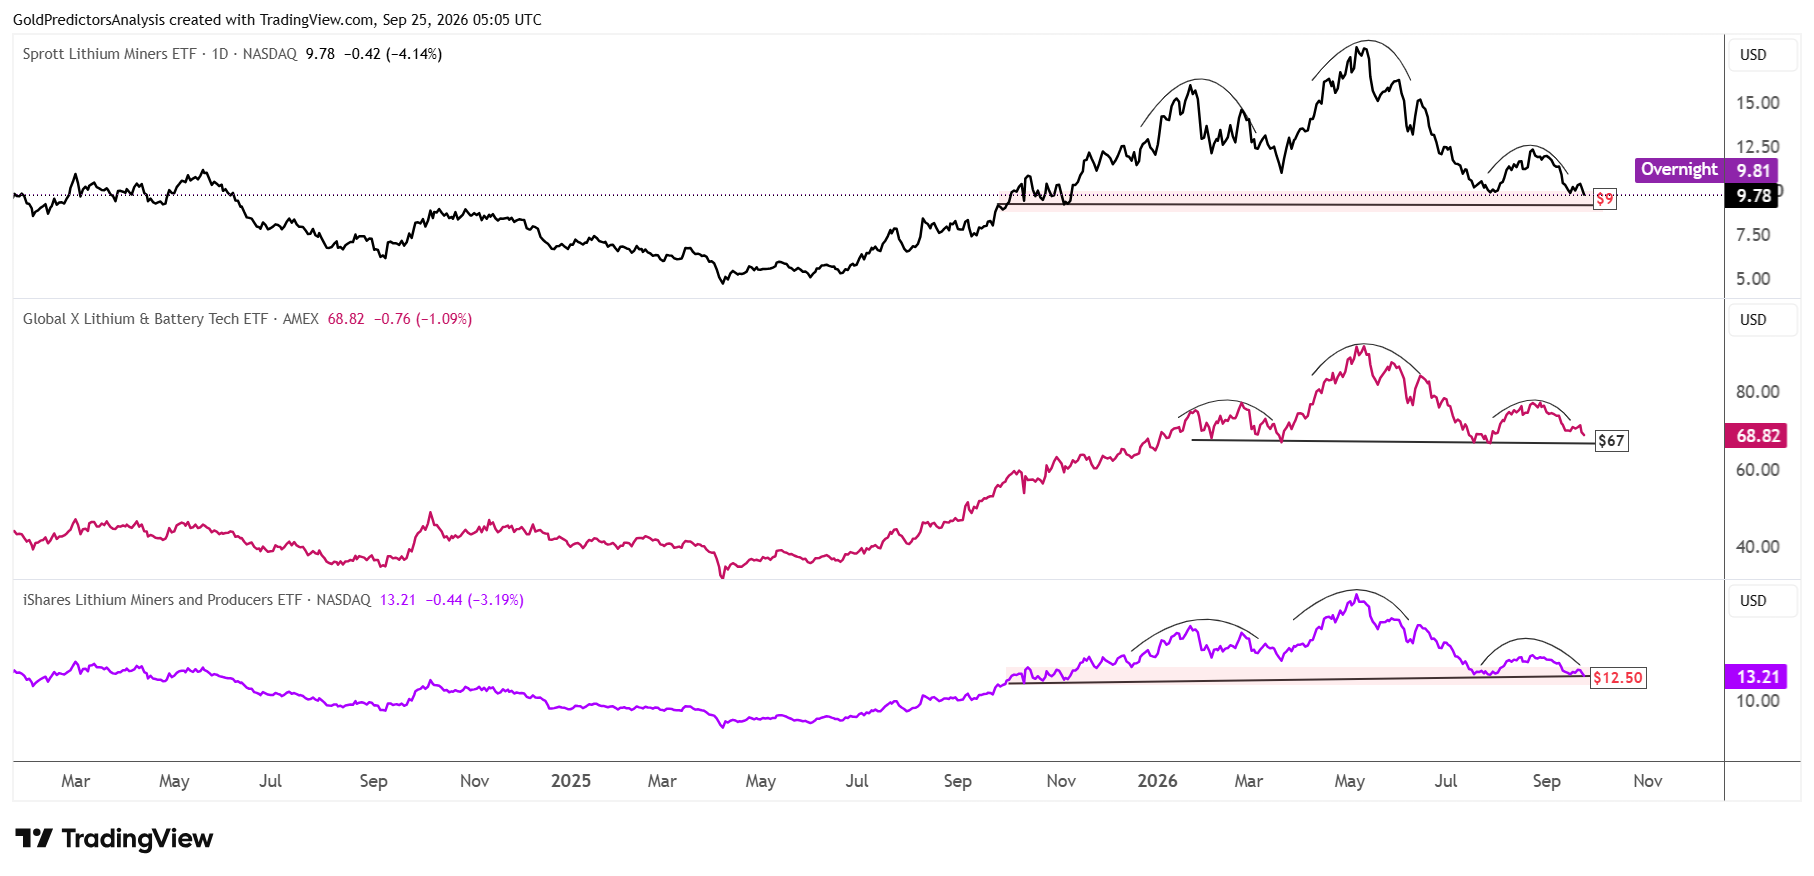
Lithium prices also continue to decline as seen in the chart below. The Sprott Lithium Miners ETF is approaching key support at $9.00. A break below this level will trigger another strong drop toward the $7.00 area. On the other hand, a break above $12.50 is required to push the ETF price higher.
Similarly, the Global X Lithium and Battery Tech ETF is approaching support at $67. The emergence of bearish patterns since January 2026 suggests that the market may break lower. A break below $67 will likely open the way for another drop toward $49.50.
The iShares Lithium Miners and Producers ETF is also approaching key support at $12.50. A break below this level, followed by a break below $12, will open the way for another drop toward the $10 area.
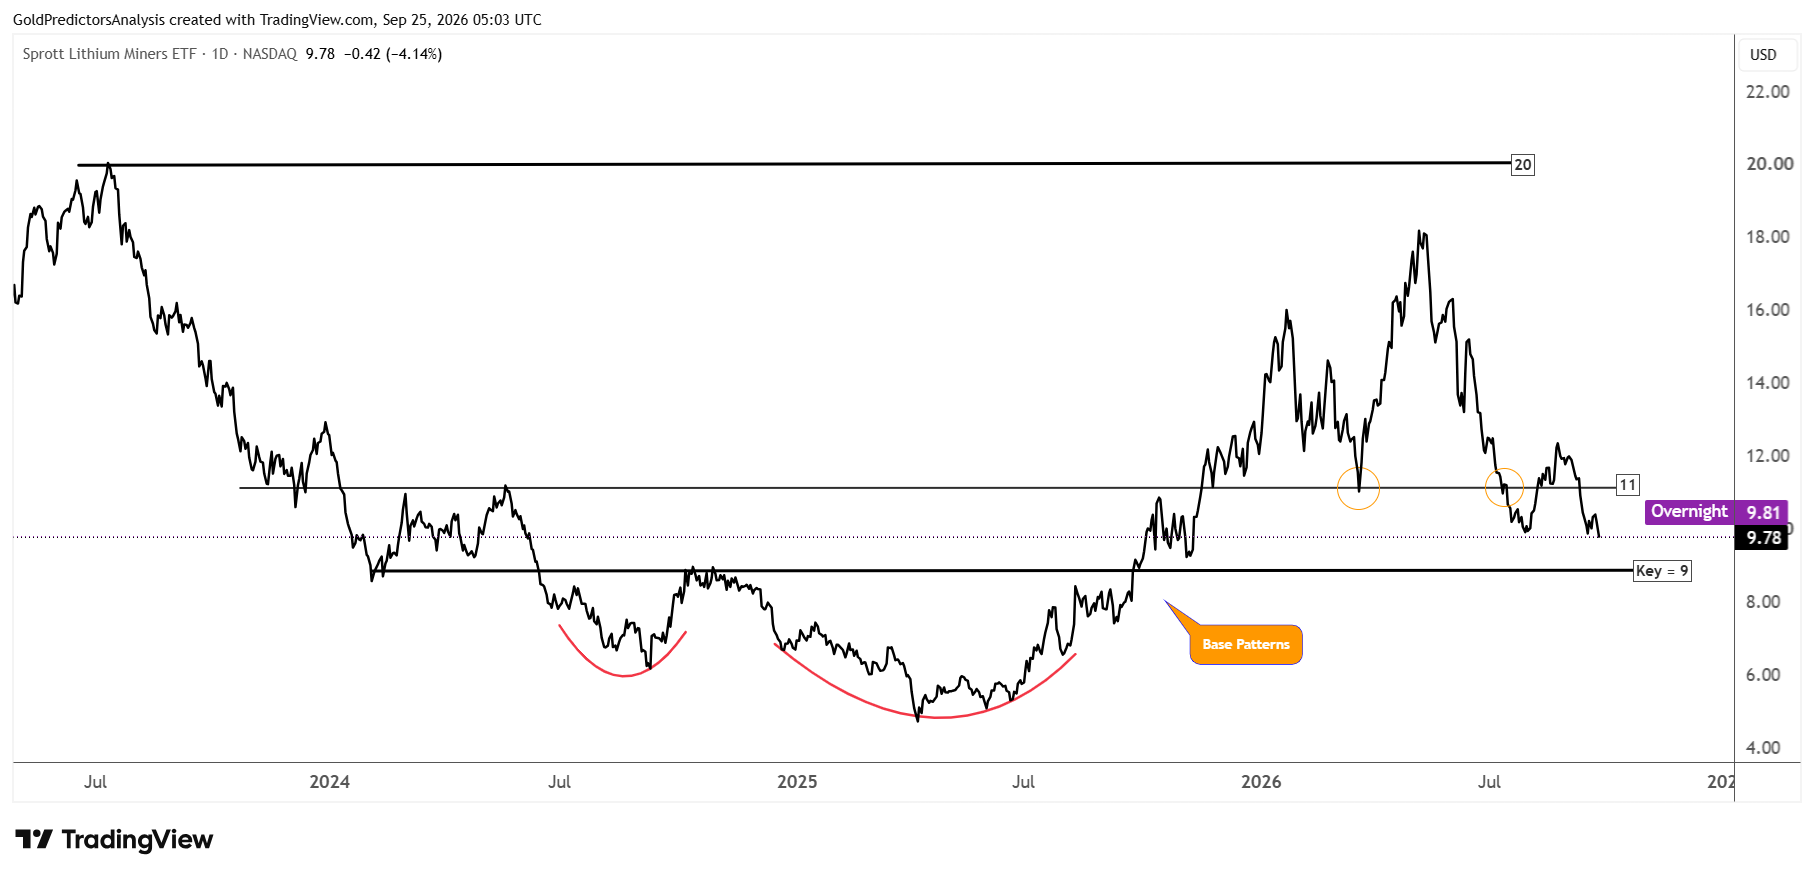
The importance of the $9 level for the Sprott Lithium Miners ETF is shown in the chart below. The ETF formed bullish price action in 2024 and 2025. But a break below $9 will invalidate this bullish formation and trigger a strong drop toward the $5-$7 area.
What to Watch Next
Copper has support from falling inventories in China and uncertainty over how much output Escondida lost. But the high Treasury yields and weaker orders from copper buyers could limit the rally. A break above $6.90 will suggest a move to $7.10. But a break below $6.60 will indicate a move to $6.30.
The outlook for uranium has improved over the long term as Italy and Poland advance their nuclear plans. But those plans will take time to create the demand for fuel. Lithium also needs stronger EV sales to drivers in China before a recovery looks convincing. For now, watch the support at $37.50 in the Global X Uranium ETF and $9 in the Sprott Lithium Miners ETF. A break below either level would add further pressure in these markets.
Read more: Copper Leads as Lithium Weakens