


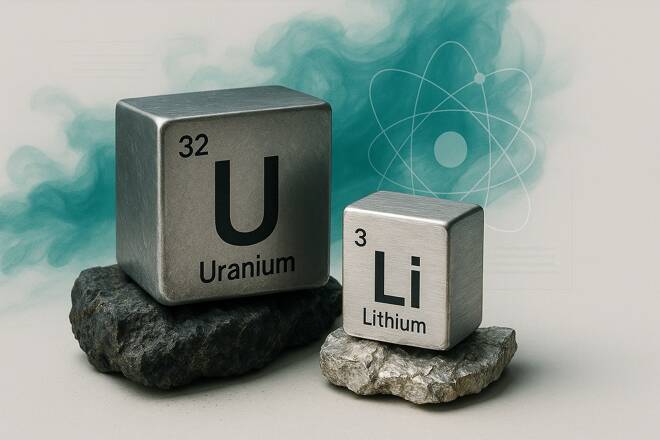
Copper (XCU), uranium and lithium are not moving together. These markets face a different balance between demand and supply. Copper price remains strong near $6.65 on Friday as strong buying from China and investment in power grids support the outlook. Uranium remains positive near $90 because buyers want reliable fuel for nuclear plants. Lithium remains under pressure as production in Australia returns but the demand from battery storage and delays at CATL’s mine are helping to limit this decline. In my view, copper has the strongest setup of the three. Uranium still has a positive outlook in the long term while lithium may remain weak in the short term. This article presents fundamental drivers, market trends and technical levels that may shape the next move in these markets.
Copper Price Forecast: China Buying and AI Demand Support Prices
Copper price trades near $6.65 per pound on Friday after three straight daily gains. The Yangshan import premium in China reached $121 per tonne on Thursday. This was the highest level since November 2022. The jump indicates that the demand for imported copper remains strong.
But the fresh LME warehouse inflows pushed London copper into contango. This suggests that nearby refined supply remains available and may slow the rally.
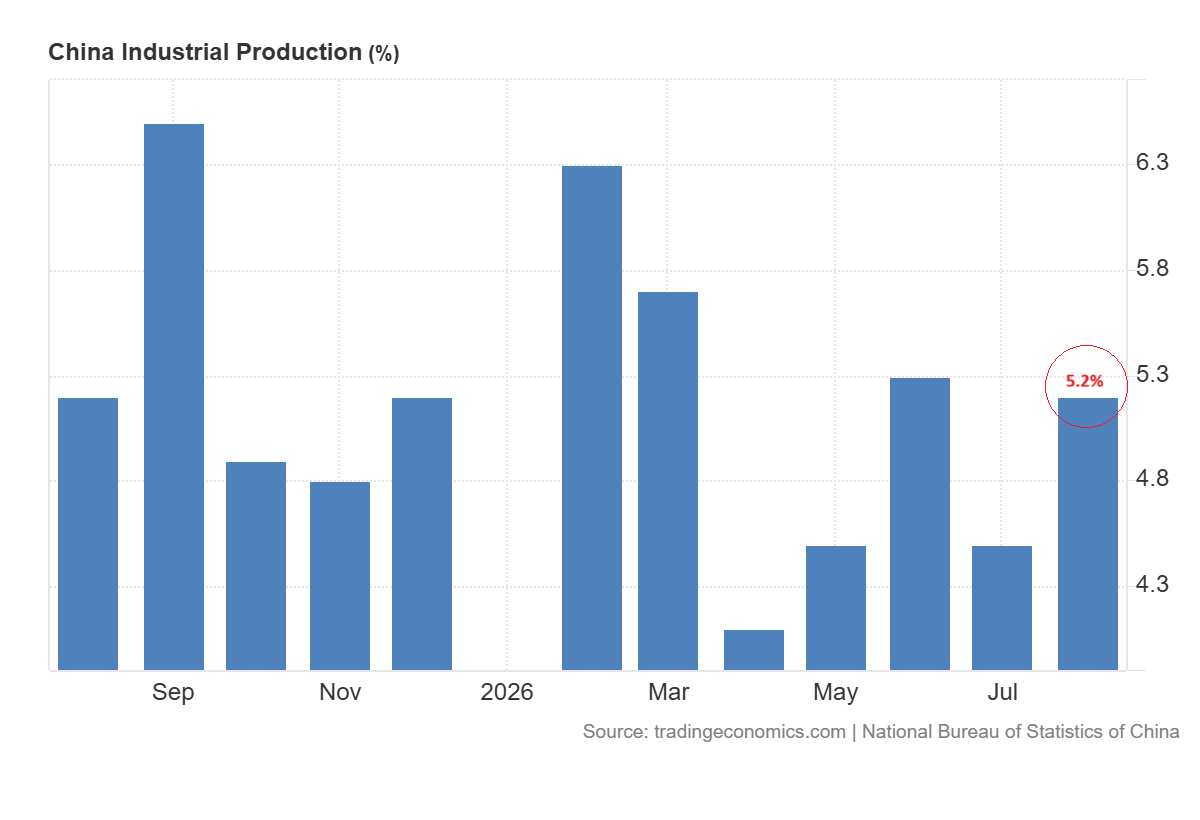
The latest economic data from China sent mixed signals to the copper market. Industrial output increased 5.2% in August from a year earlier. Manufacturing output increased 6.1%. This supported demand from equipment, electrical and technology producers.
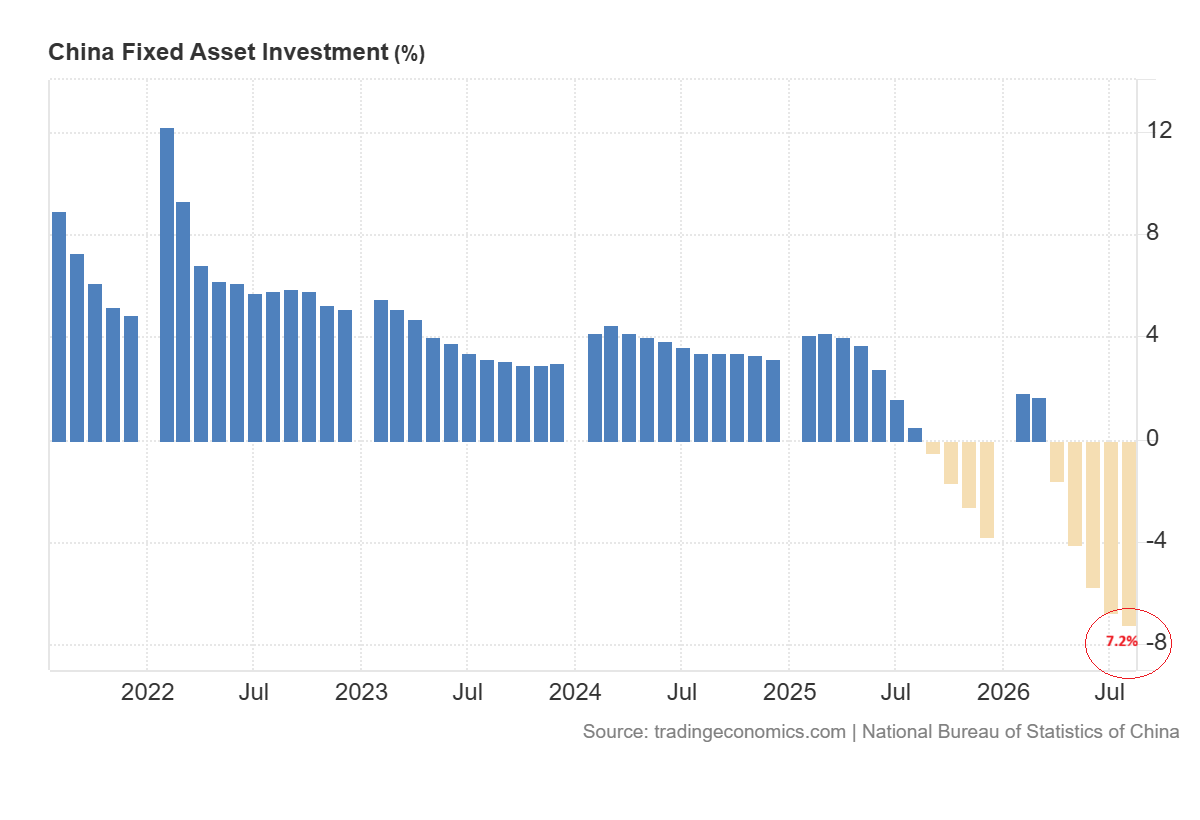
But fixed-asset investment dropped 7.2% during the first eight months of 2026 and property investment dropped 19.9%. This means that advanced manufacturing now supports copper more than construction and real estate.
The copper outlook remains positive in the long term as the world needs more power infrastructure. The IEA says that the electricity demand is growing three times faster than total energy demand.
Electricity also attracted 61% of global energy investment in 2026. Copper is significant for grids, cables and transformers. The IEA still expects 25% copper supply gap by 2035 based on announced projects.
In my view, AI investment and grid expansion may support copper prices in the long term. But the increase in inventories and property weakness in China could still cause sharp corrections in the short term.
Copper Price Forecast
Every new Copper analysis as it publishes, today's technical signal and key levels, live price — on one page.
See all Copper forecastsUranium Price Forecast: Nuclear Fuel Demand Supports Prices Near $90
Uranium remained near $89.75 per pound. It has gained more than 15% over the past year.
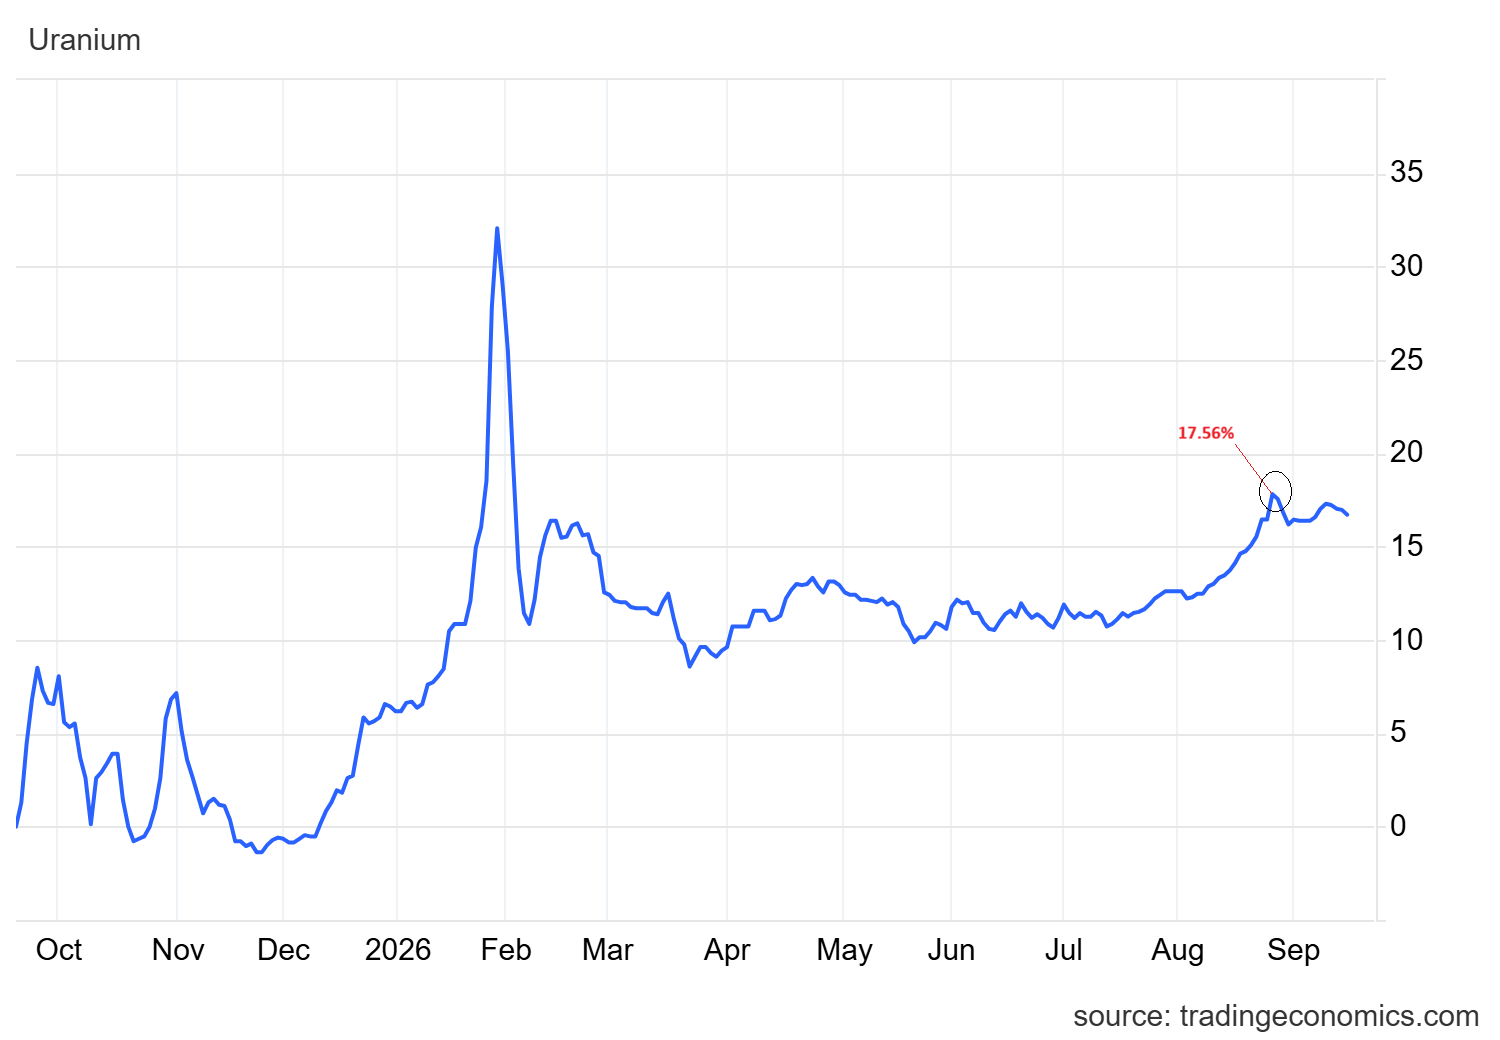
The August data from Cameco shows that the long term uranium price remains at $96.50. This was above the spot price of $89.68.
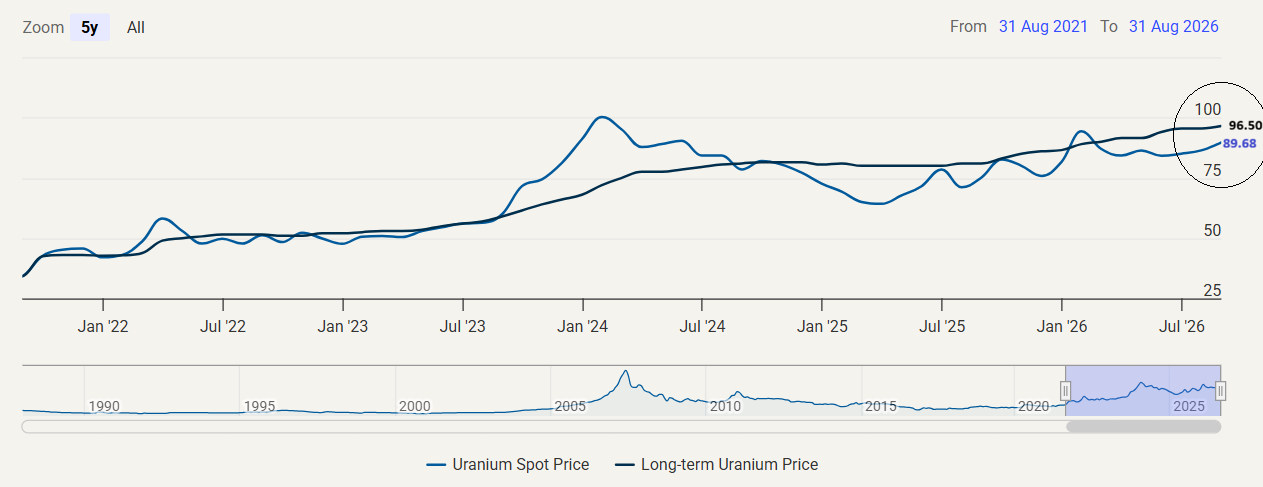
The premium shows that buyers will pay more to secure supply in future. Google also signed a 22-year agreement for up to half of the output from the Loviisa nuclear plant in Finland during 2030-2049. Meanwhile, the US approved up to $414 million for the Dasa uranium project in Niger. But security and transport risks suggest that this project will not solve supply concerns quickly. New uranium mines normally take 15 to 20 years to develop.
Lithium Price Forecast: Australian Supply Keeps Prices Under Pressure
Lithium carbonate trades near CNY 134,300 per tonne on Friday in China. The price has fallen about 12.5% over the past month. But it remains nearly 83% higher than a year ago.
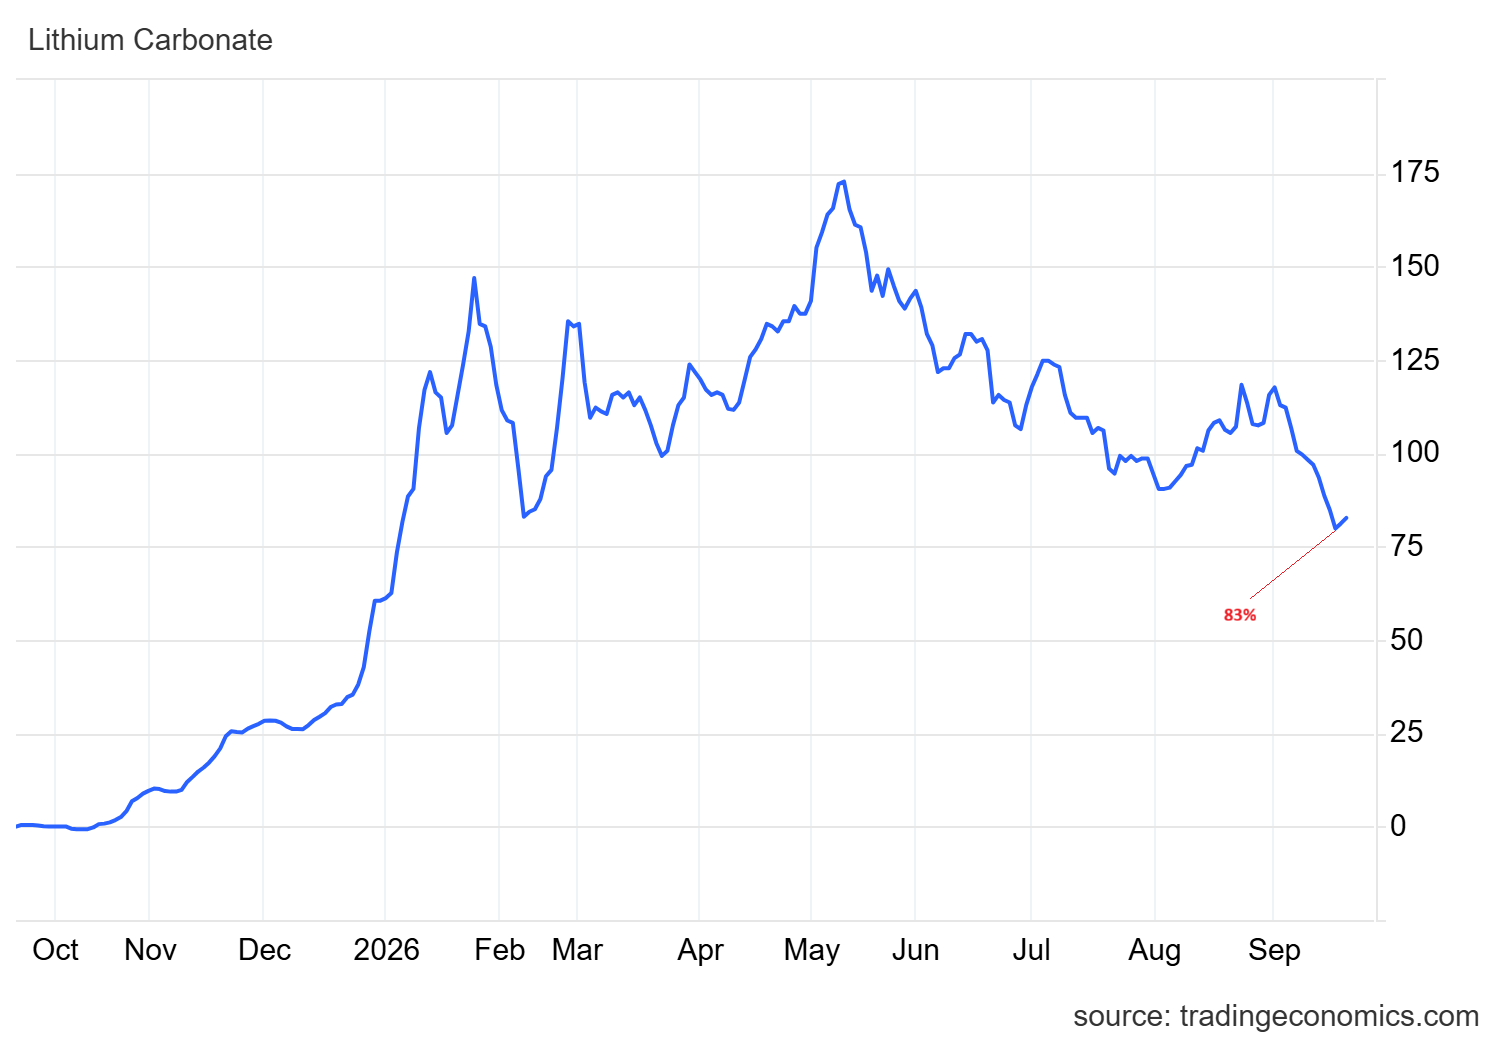
More Australian lithium is coming back to the market. Mineral Resources has restarted Bald Hill while Core Lithium has resumed production at Finniss. The extra tonnes could keep prices under pressure. But the regulatory problems continue to delay the large Jianxiawo mine of CATL in China. The market therefore faces more supply from Australia but continued uncertainty in China.
Lithium demand still receives support from batteries and energy storage. The lithium-ion battery output in China jumped 57.2% in August from a year earlier. The Google-Fortum agreement also includes 94 MW battery system beside a new data center. The IEA says that the energy storage demand helped lithium prices more than double earlier in 2026. It also expects the supply gap in lithium to continue through 2035.
In my view, uranium has the stronger supply picture because buyers are signing power and fuel agreements in the long term. Lithium may remain more volatile because Australian production is returning. But the battery storage demand and delays at the CATL mine may limit the downside.
Copper Technical Analysis: $7 Resistance Defines the Next Move
Copper prices have been trading within the $6 to $7 range since May 2026. The price hit a high of $6.92 on 6 August 2026 and then consolidated in a narrow range between $6.50 and $6.90. However, the price fell in September, marked a reversal candle on 15 September and recovered above the 50-day SMA.
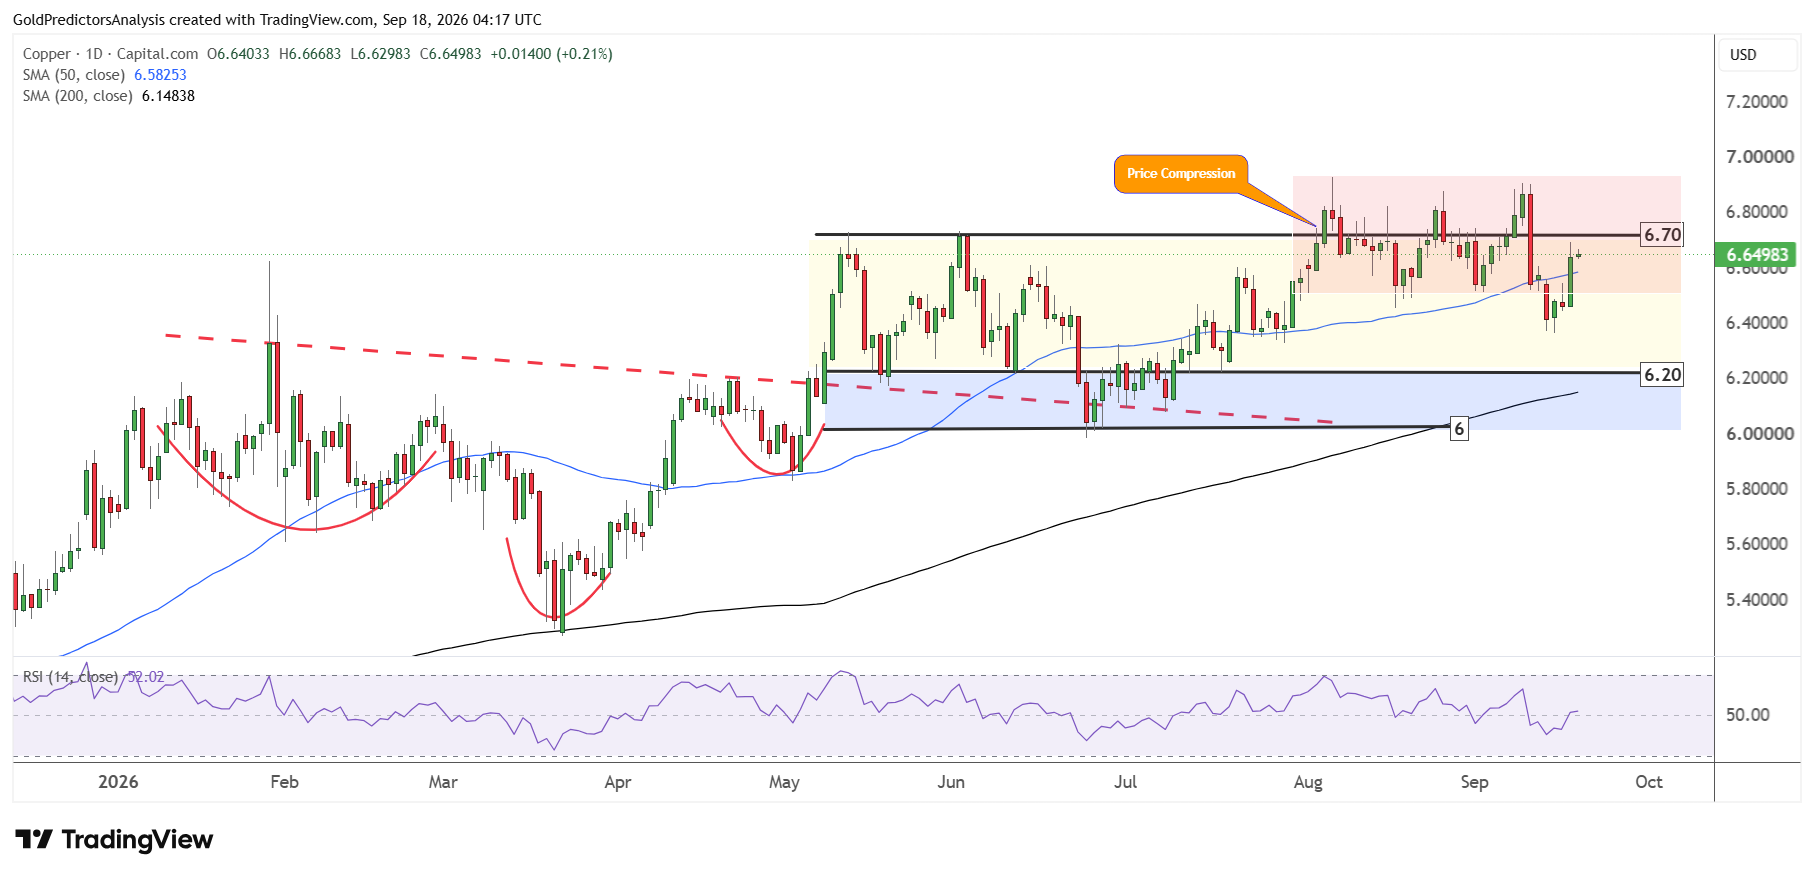
The strong reversal in September indicates positive momentum in the copper market. This positive action suggests that the price is moving toward $6.92 in the short term. A confirmed break above $6.92 will likely open the way for further upside in the copper market. The price remains above the 50- and 200-day SMAs and the RSI also remains above the midline. This indicates positive momentum in the copper market.
Despite this positive momentum, the price is currently trading near the resistance zone as seen on the quarterly chart below. However, the price has already broken above the $6 resistance. This resistance is defined by the ascending channel pattern.
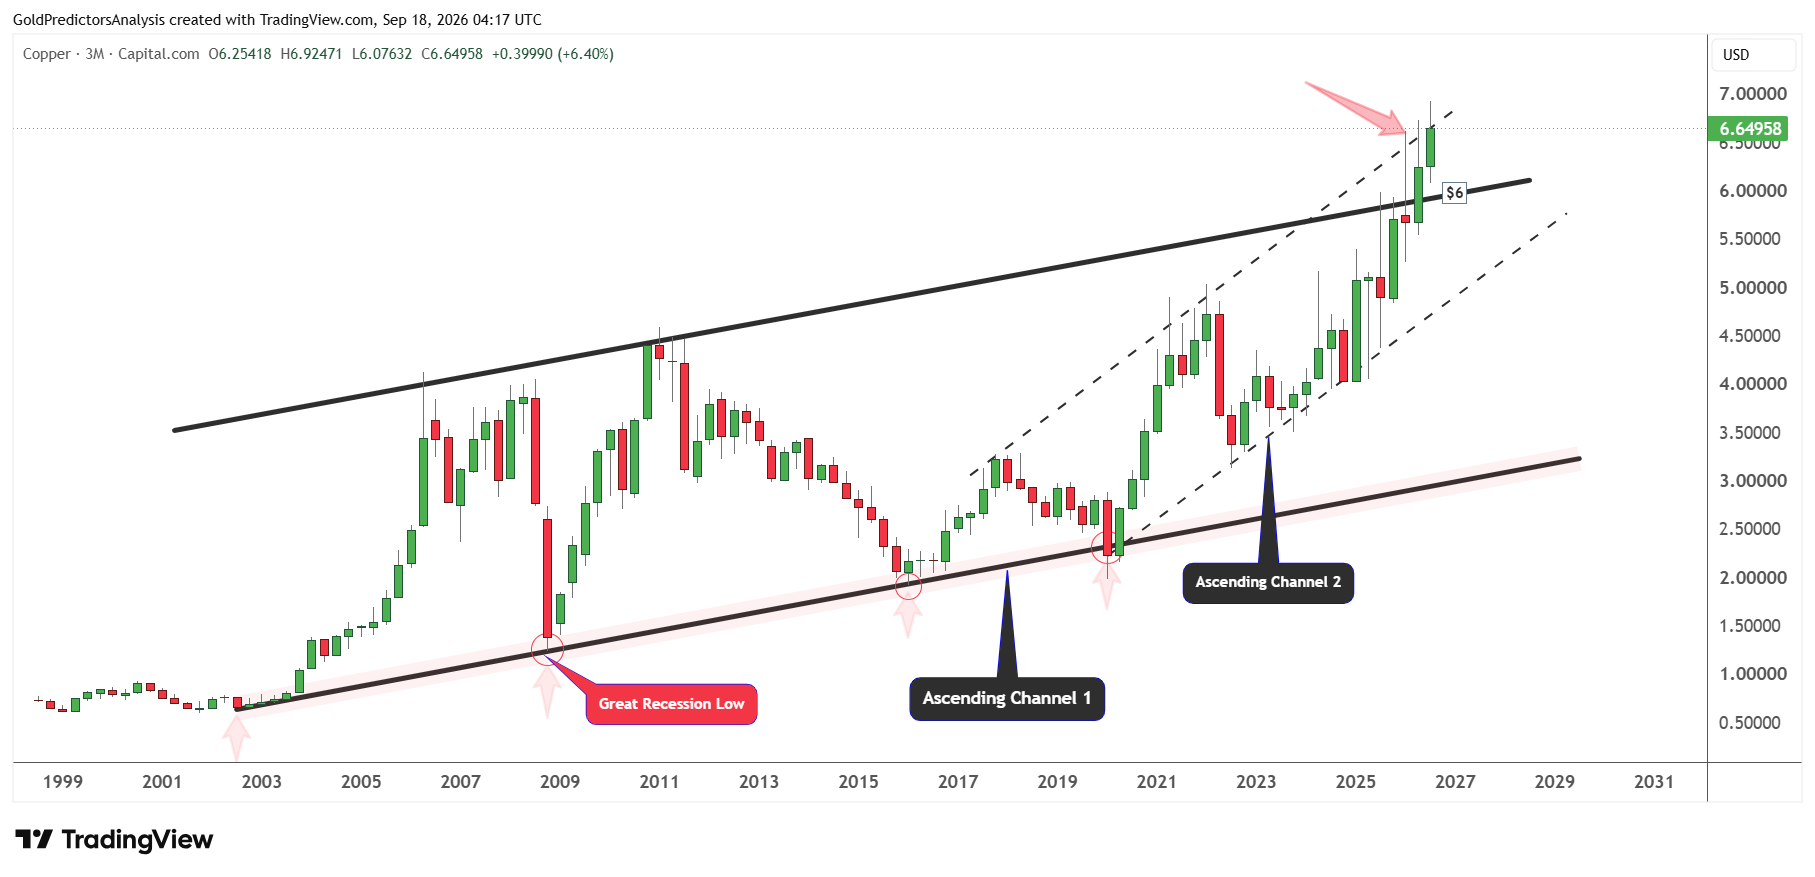
If price breaks above the $7 area, this will likely confirm stronger momentum in the copper market. But the immediate support for copper remains the $6 area. As long as the price remains above this zone, copper prices will likely continue to move higher. Overall, the price structure in copper suggests strong bullish momentum in the long term.
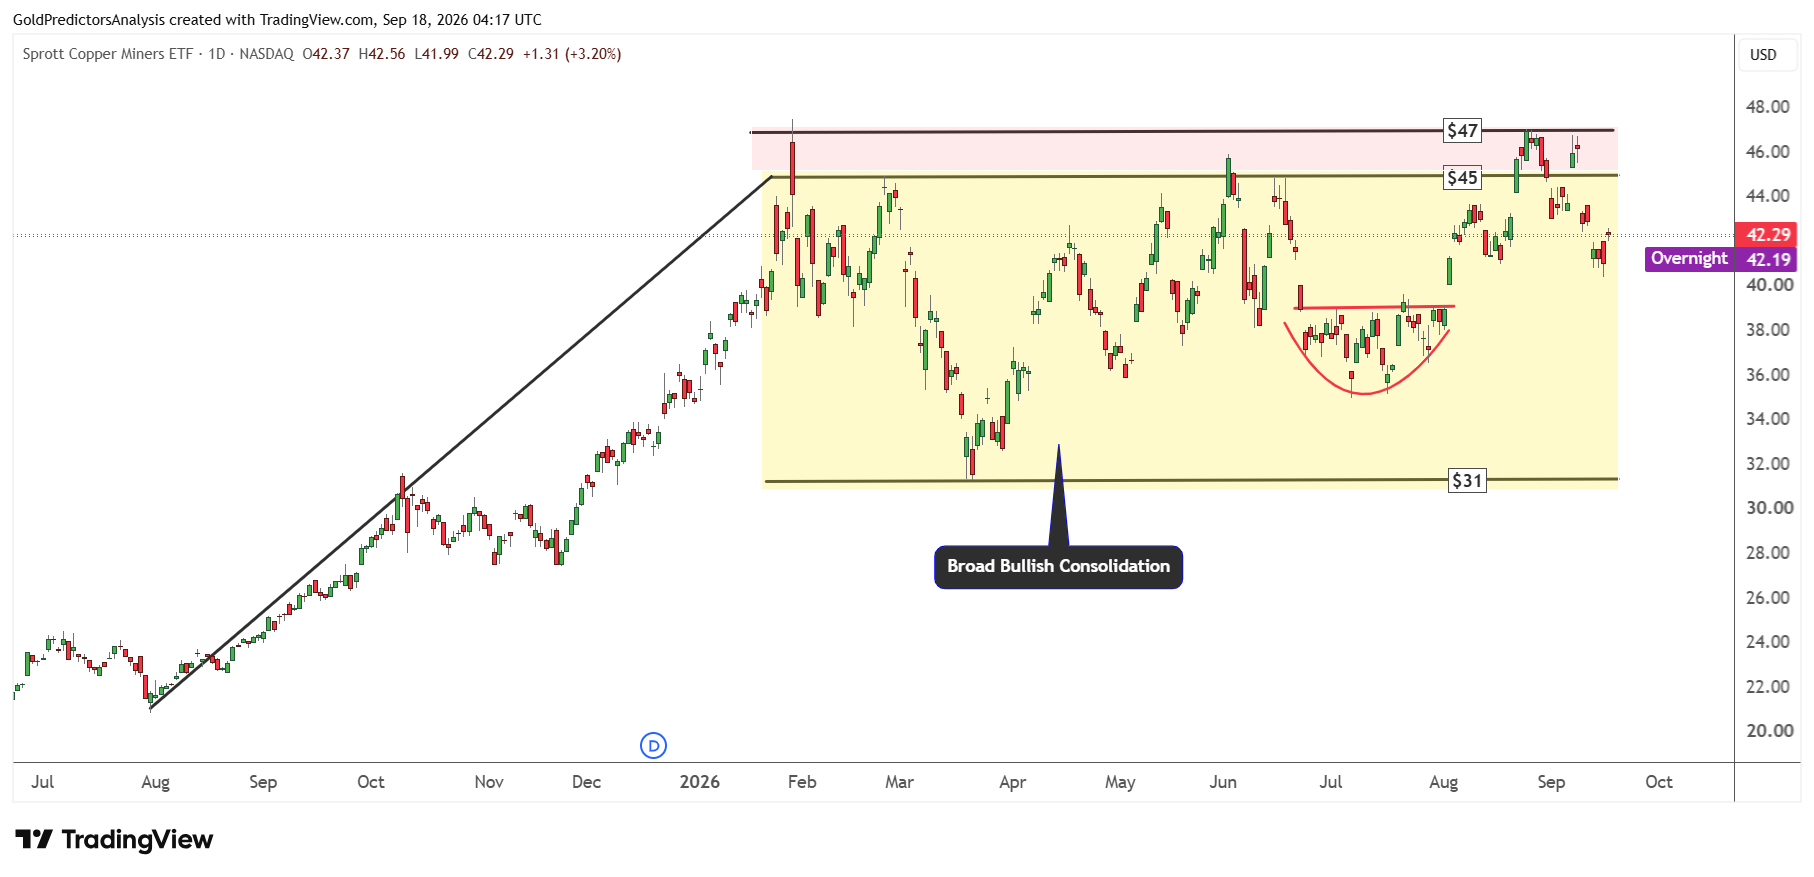
The strong positive structure in the copper market is also observed in the Sprott Copper Miners ETF. The ETF shows strong consolidation between $31 and $45. However, the price is showing bullish price action and a break above $47 in the miners ETF will likely open the way for strong surge.
Uranium Technical Analysis: Key ETF Breakout Levels
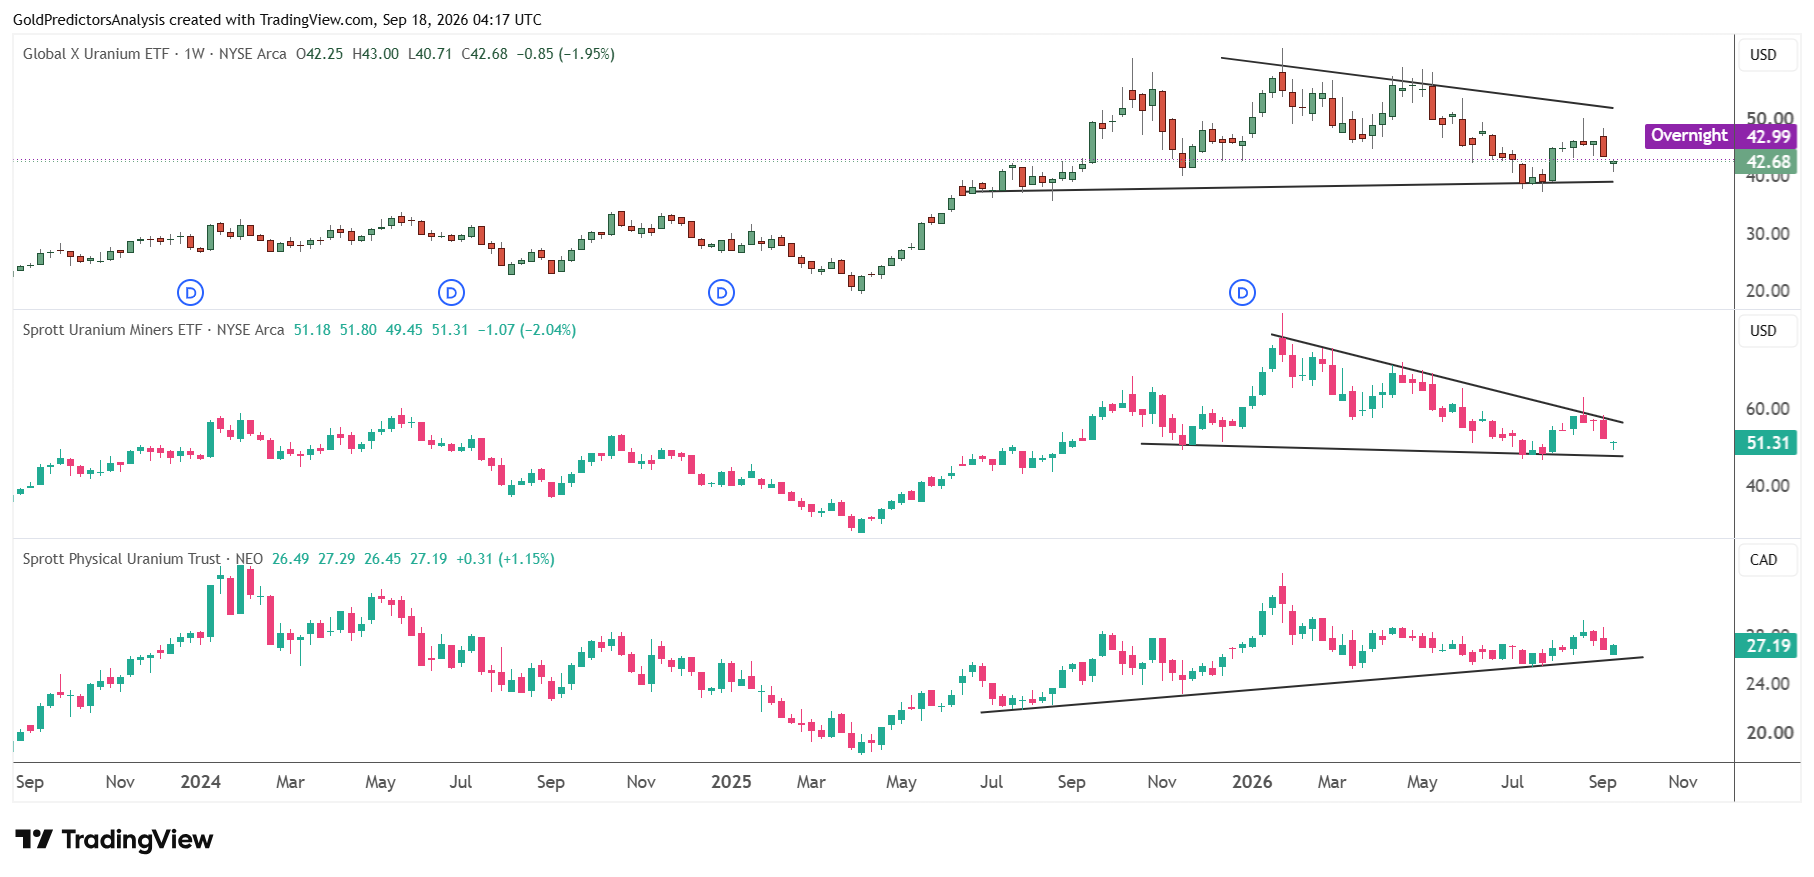
Uranium prices also show constructive price action in the short term as seen in the chart below. The Global X Uranium ETF is consolidating within triangle pattern between $38 and $52. A break above $52 will open the way for a strong rally toward $62. But a break below $38 will likely open the way for a further drop.
Meanwhile, the Sprott Uranium Miners ETF also trades within a triangle pattern. The immediate support remains at $47. A break below $47 will likely push the ETF toward $40. But a break above $60 will open the way for further upside toward $70 as the immediate target.
The Sprott Physical Uranium Trust also remains above the ascending trendline that stretches from the July 2025 lows. A break below $25.60 in the Sprott Physical Uranium Trust will open the way for further drop toward the $22 region. But a break above $29 will likely push the price toward $33.
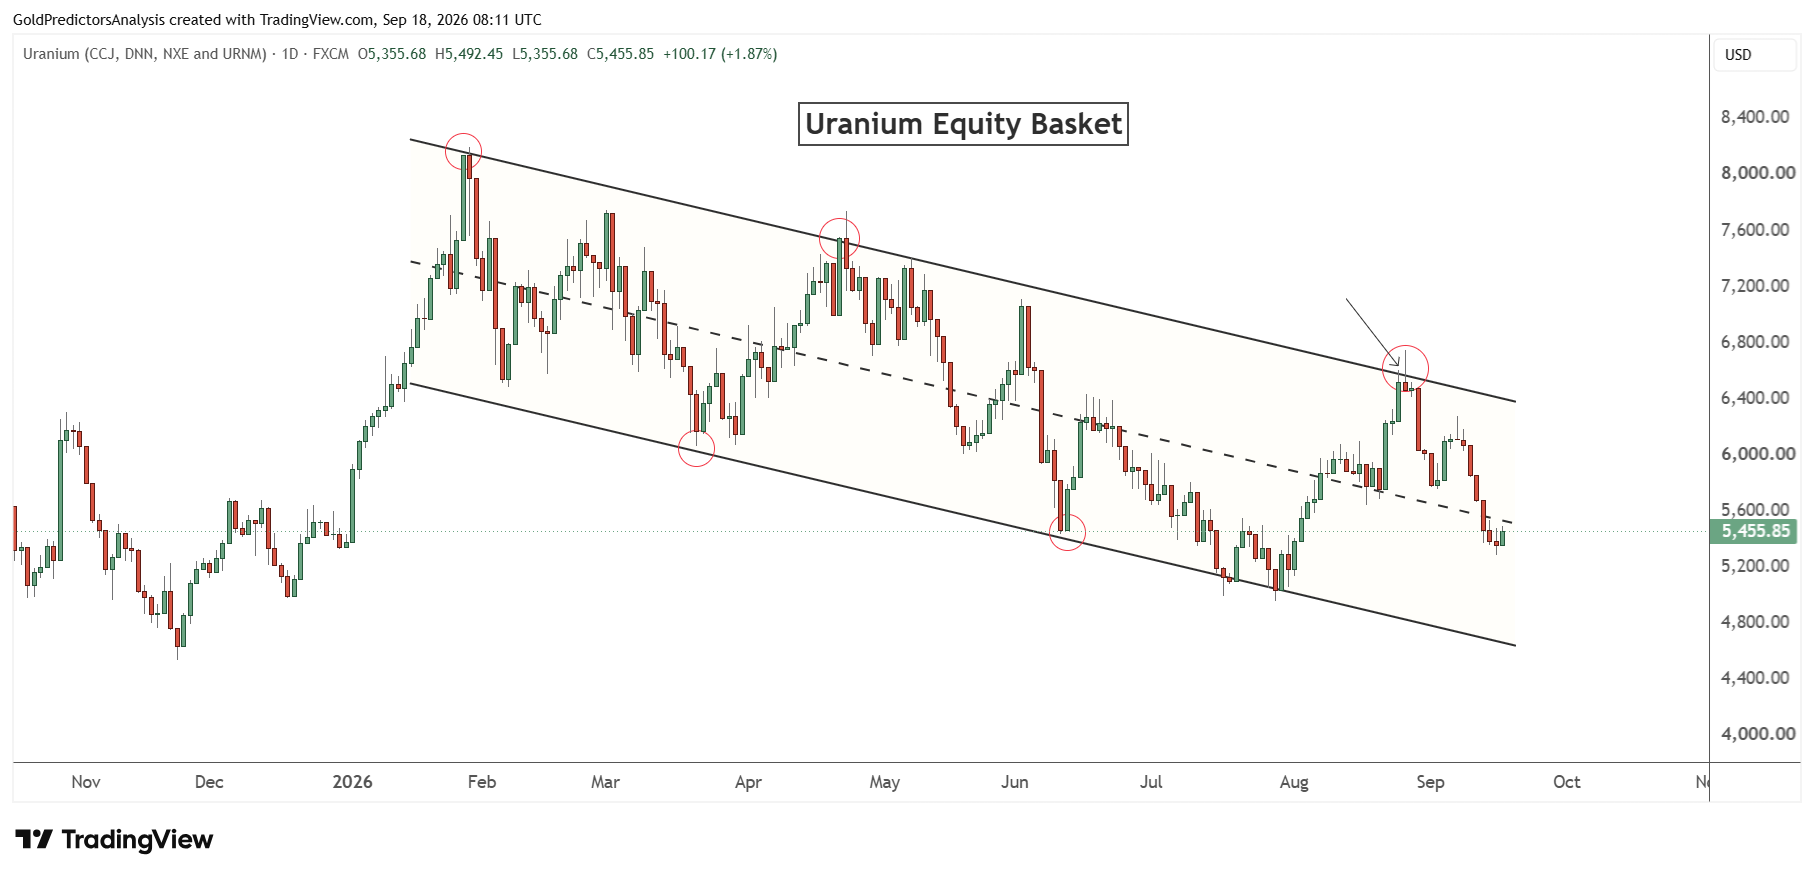
The uranium equity basket has also formed strong resistance at the 6,700 level and continues to move lower as discussed in the previous analysis. The price remains bearish in the short term. If the price breaks below 5,000, it will likely move toward the 4,200 level in the short term. This is considered strong support in the uranium equity basket in the long term.
On the other hand, a break above 6,500 is required to break the descending channel and open the way toward the 7,600 level.
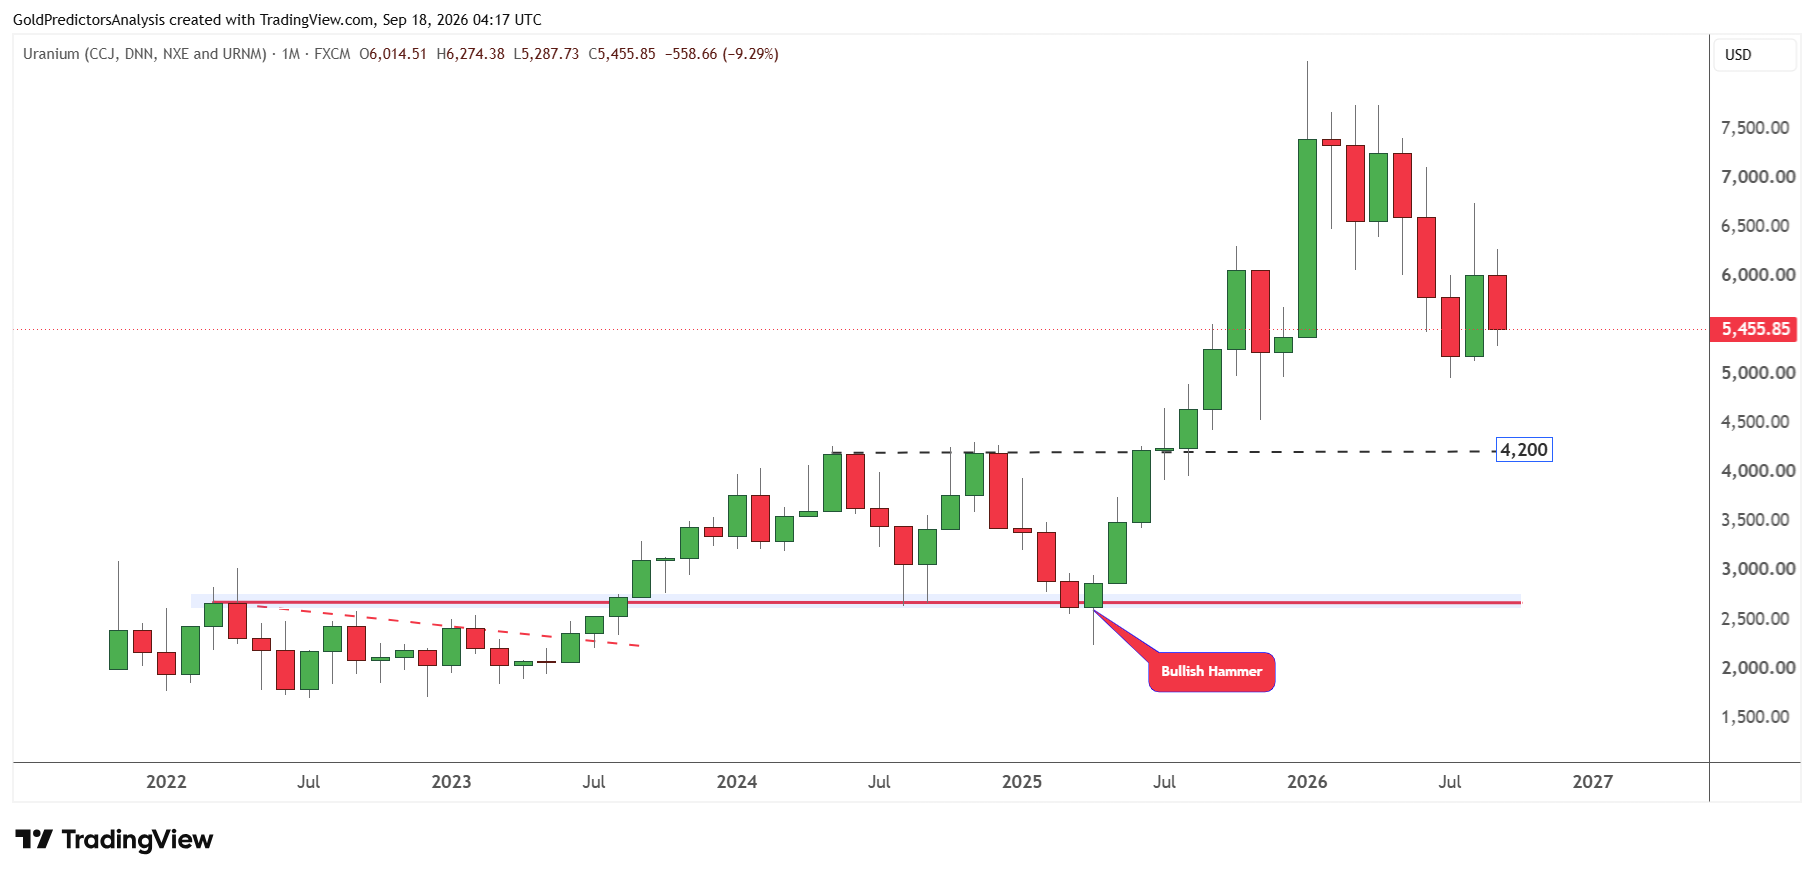
The weakness in the uranium equity basket is also evident on the monthly chart, which shows that the long term support remains at 4,200. If the uranium market remains weak and continues to drop, this level could mark the pivotal point for investors.
Lithium Technical Analysis: Mining ETFs Test Major Support
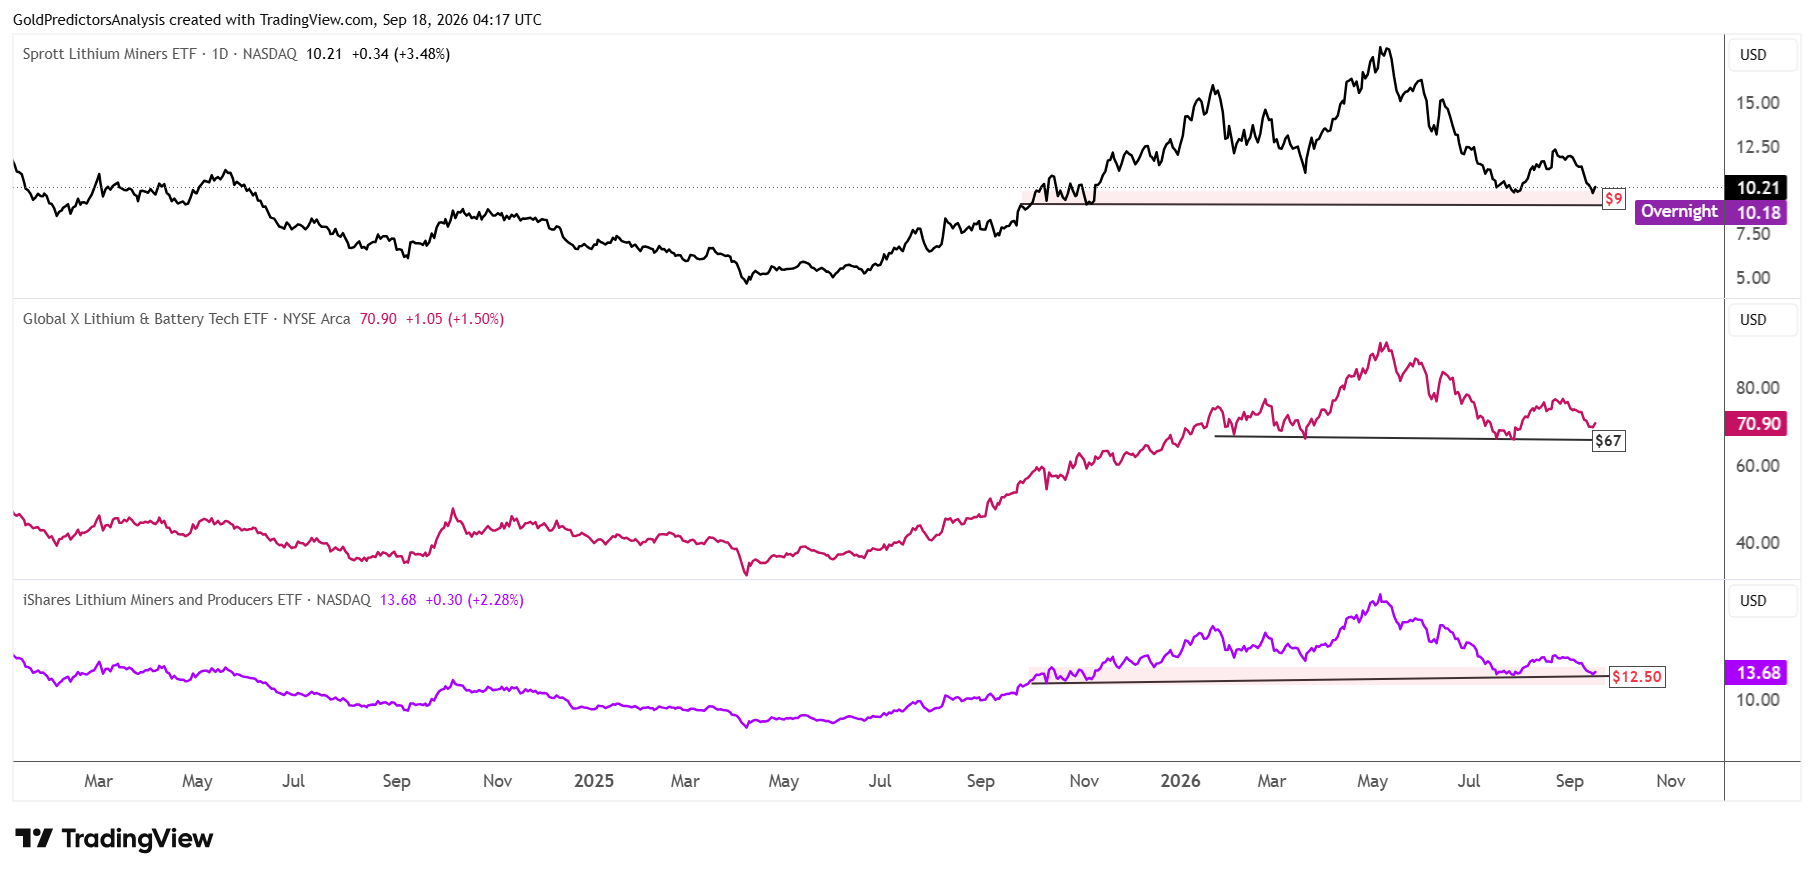
The lithium market also shows weakness in the short term despite the strong rally in the copper market. The Sprott Lithium Miners ETF has reached the key support zone near $9. A break below $9 will likely push the ETF price toward the $5 region. On the other hand, a break above $12.50 is required to keep the bullish structure in the lithium market.
Meanwhile, the Global X Lithium & Battery Tech ETF also shows strong support near $67. A break below $67 will likely push the ETF price lower toward $55. On the other hand, a break above $78 will likely push the ETF price toward $89.
Similarly, the iShares Lithium Miners and Producers ETF shows strong support near $12.50. A break below $12.50 will likely push the ETF price lower, while a rally back higher and confirmed break above $16 will likely push the ETF price toward the $20 area.
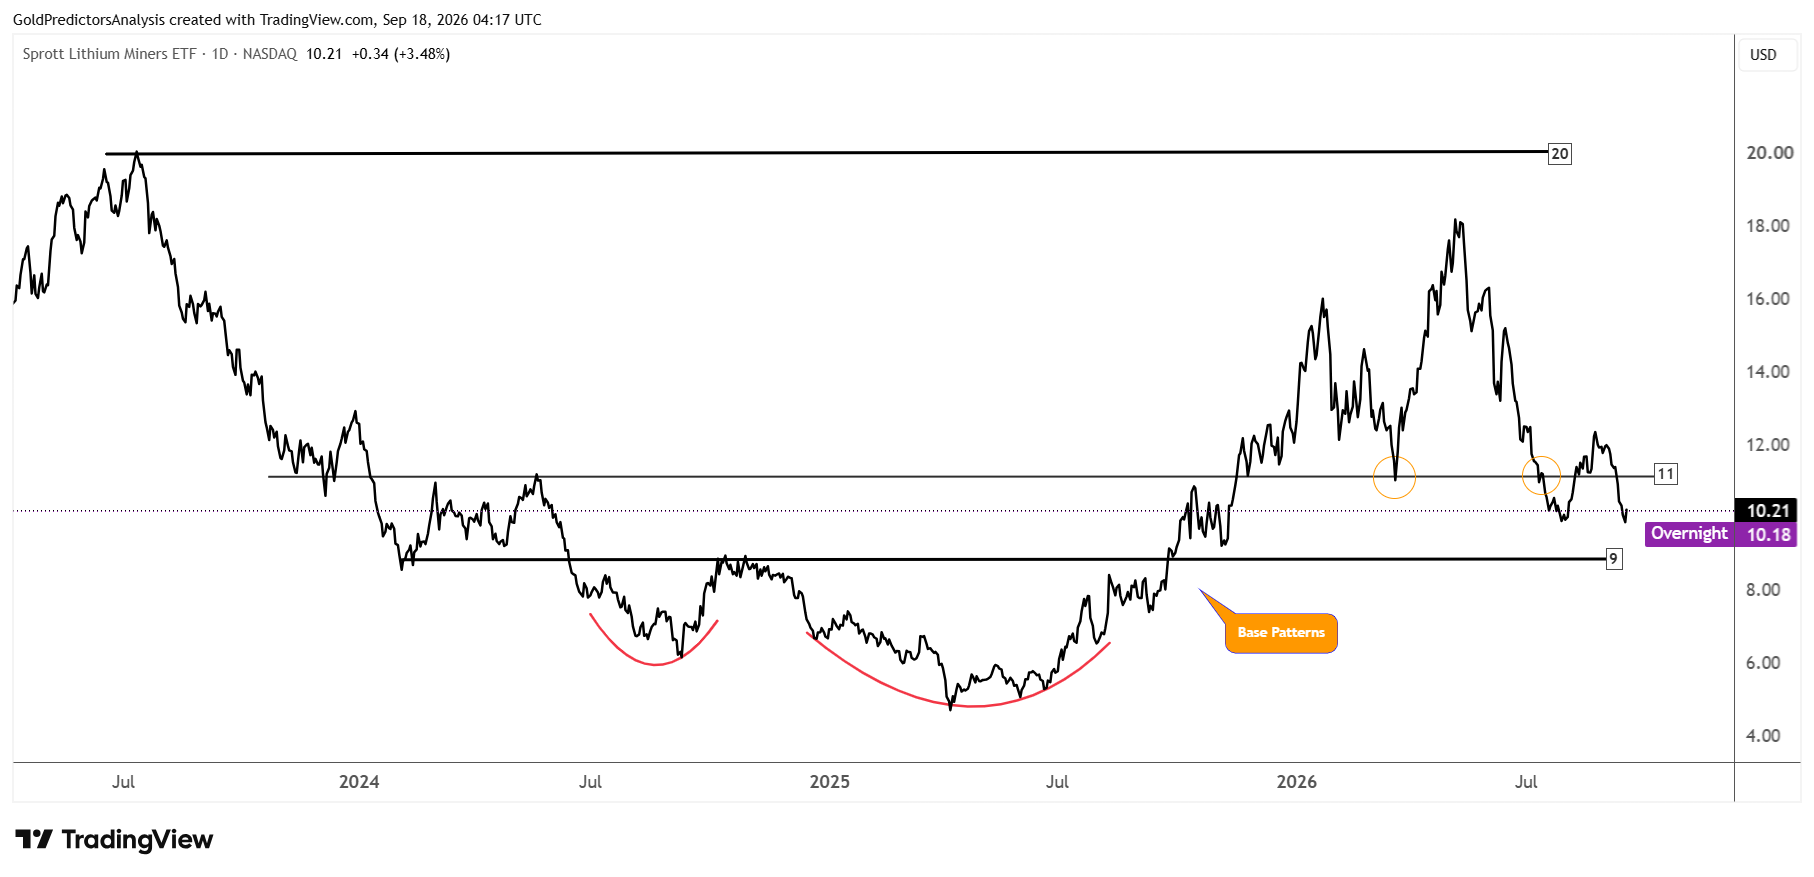
The chart below shows the weakness in the Sprott Lithium Miners ETF around the $9 level. If the $9 support holds, it will likely produce a rebound toward the $11 region. But a break below $9 will likely open the way for a drop toward the $5 region.
What to Watch in Copper, Uranium and Lithium
Copper, uranium and lithium show different market conditions. Copper has the strongest outlook as demand from China, spending on AI infrastructure and grid investment support consumption in the long term. A break above $7 would strengthen the bullish case but a break below $6 would weaken the structure.
Uranium also has supportive fundamentals as buyers are securing future supply and new mines take years to develop. But uranium funds must break the key resistance levels to initiate strong rally.
Lithium remains the weakest market as production in Australia returns and mining ETFs trade near major support. The demand from the battery storage and delays at CATL’s mine may limit the downside. But lithium needs clear breakout to confirm a recovery. In my view, copper has the strongest bullish structure, uranium maintains a positive outlook in the long term and lithium may remain under pressure in the short term.
Read more: China Data Support Recovery Near $6.50