


Copper (XCU), uranium and lithium enter September with positive momentum, but the outlook remains uncertain in the short term. The improvement in factory activity in China supports demand, while the U.S. jobs report may affect the dollar, Treasury yields and commodity prices. Grid investment, battery storage and nuclear expansion continue to strengthen the demand outlook in the long term. In my view, all three markets remain bullish but they must break the key resistance levels to extend their rallies. This article presents the key market catalysts, supply risks and technical levels that may determine the next move in copper, uranium and lithium.
China PMI and US Jobs Data Drive the Metals Outlook
The new factory data from China was modestly bullish indicator for copper and lithium. The official manufacturing PMI climbed from 49.2 to 49.8 in August. But it did not exceed the growth line of 50 points.
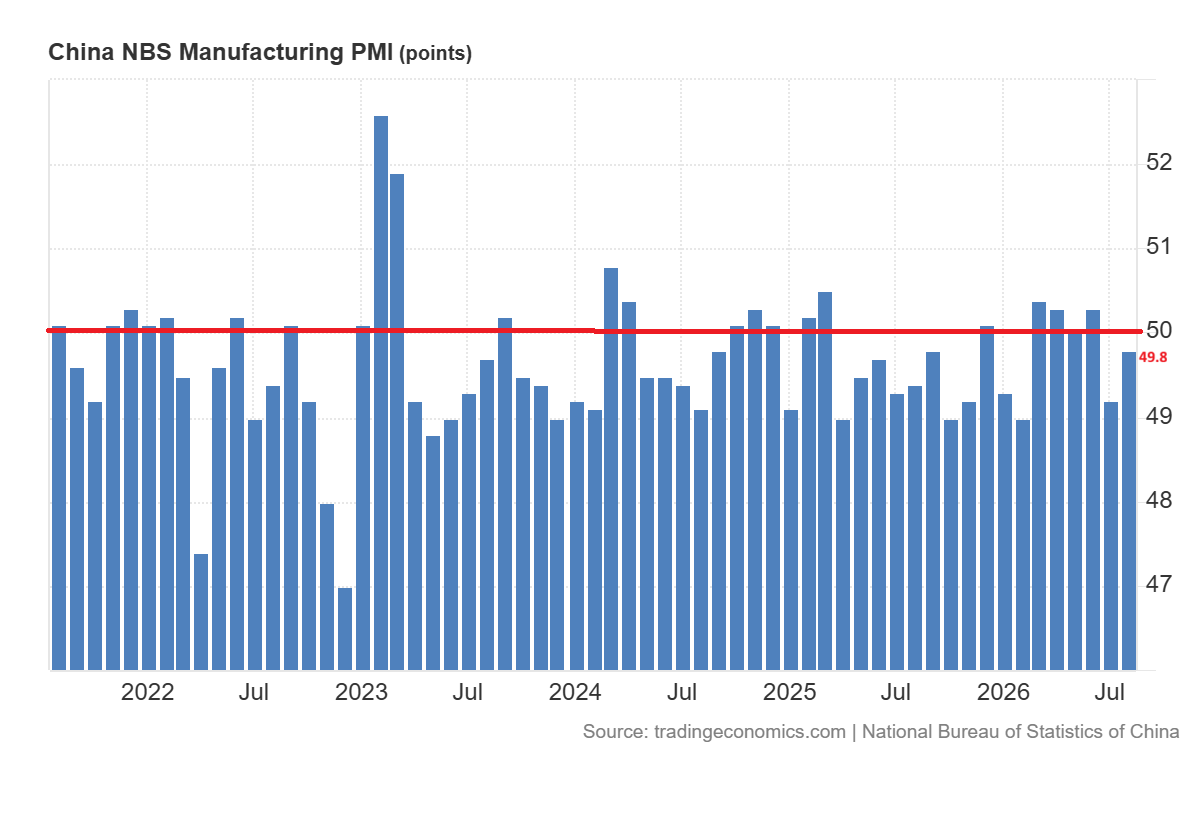
But output increased to 50.4 and new orders to 50.6. The private manufacturing PMI was higher at 51.5. These readings indicate that industrial demand is improving but not enough to eliminate the downside risk.
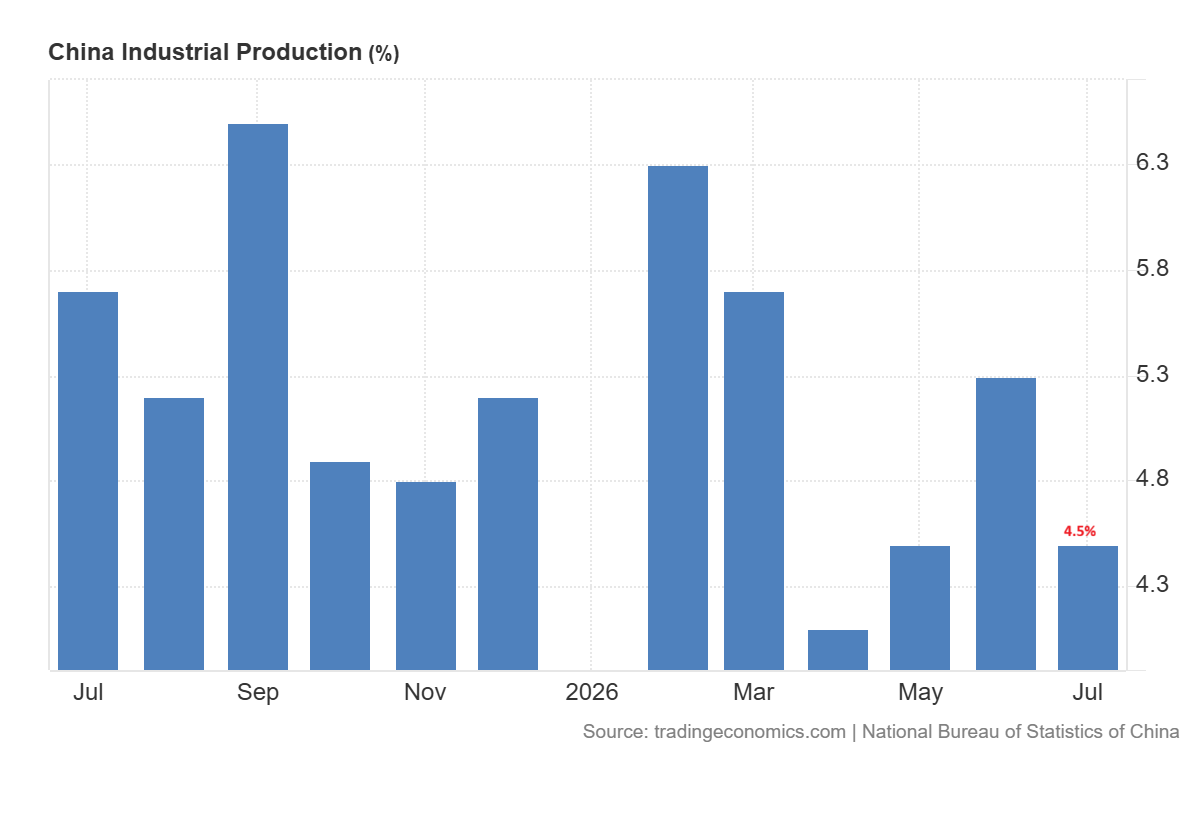
The market is now watching the US jobs data as the catalyst for the next move. Weak jobs data may push the US dollar and Treasury yields lower and support copper and lithium prices as it would relieve financial pressures on global demand. A strong jobs report will do the opposite. But the impact of this report will be less on Uranium, as purchasers use long term contracts.
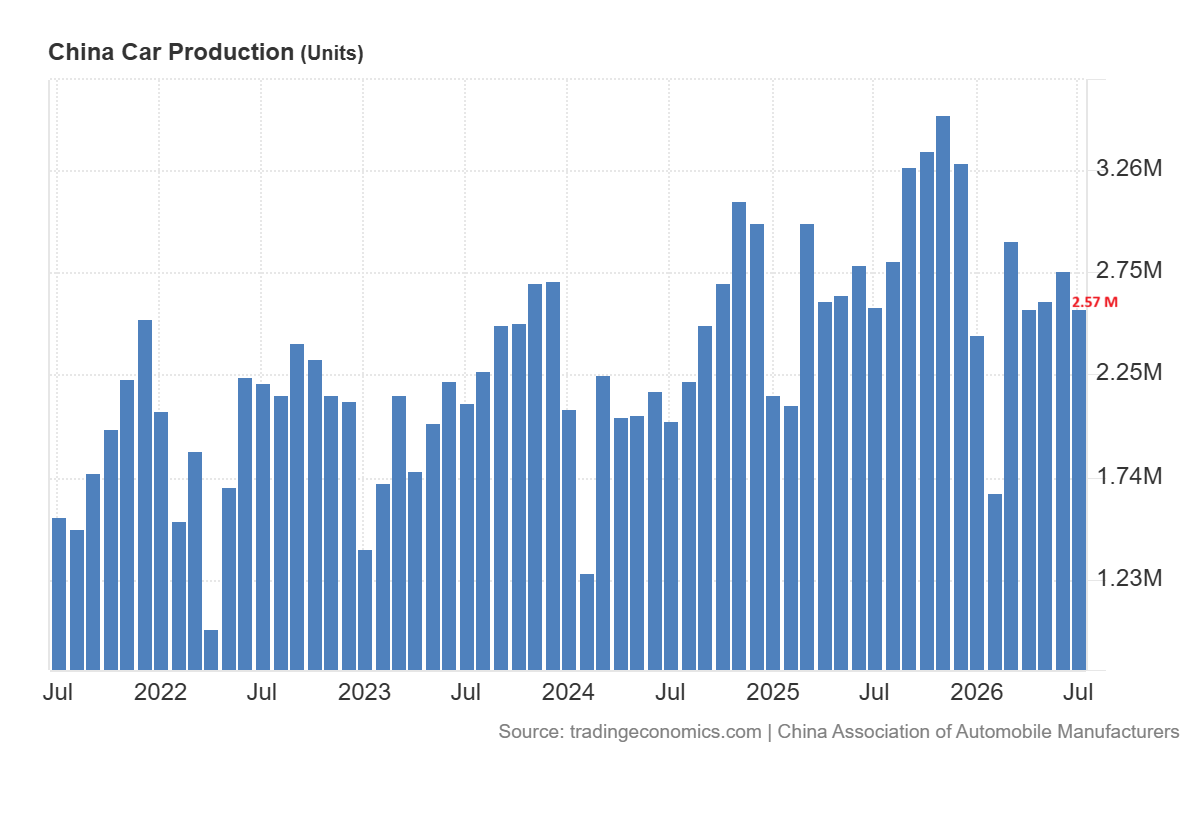
The long term demand for metals remains supportive. The demand for batteries and energy storage keeps growing as the investments in the grid and data centers consume large quantities of copper. The global battery demand increased by 35% in 2025 and lithium demand increased by approximately 25% a year over the past two years. Nuclear expansion also supports uranium demand. Around 80 nuclear reactors are under construction worldwide, while another 120 are planned, mostly in Asia.
Copper Price Forecast
Every new Copper analysis as it publishes, today's technical signal and key levels, live price — on one page.
See all Copper forecastsSupply Disruptions Support Copper, Uranium and Lithium Prices
Copper is currently trading at around $6.59 a pound after hitting record high price in August. The supply situation remains mixed. A shortage in the supply of concentrates has been seen due to disruptions in mining. There has been a refined surplus of 239,000 tonnes in the first four months of 2026 due to robust refining in China. U.S. buying and declining stocks overseas have reduced the supply of metal in some areas. In my opinion, this imbalance can keep copper prices volatile. Higher consumption in China would support another step up while higher inventories among refiners would dampen the short term prospects.
The price of lithium currently trades around 152,000 yuan per tonne and has risen over 8% over the last month. The latest support for lithium comes from another delay at CATL’s Jianxiawo mine. Due to regulatory concerns, Benchmark Mineral Intelligence has cut the 2026 lithium carbonate equivalent output forecast from 62,500 tonnes to 32,000 tonnes. China’s September market may also run a deficit if LFP production is strong.
Uranium is up to nearly $89.50 per pound and has increased nearly 4% in the last month. The production of the Russian Kazatomprom rose 9% in the first half while output from Cameco dropped 5% in Canada. The producers are still on track to achieve their annual targets. The construction of reactors, life extensions and utility contracting continue to support the demand in the future. This supports a stronger outlook for uranium in the long term.
Copper Price Forecast: $6.50 Support Keeps $7 in Focus
The daily chart for copper prices shows the formation of a rising wedge in 2026. Prices are trading between the $6.50 and $7.00 region and looking for the next direction. A break below $6.50 will open the way for a strong drop towards the $6 area, which is defined by the 200-day SMA. But a break above $7 will indicate a strong move toward $7.50. The RSI has recovered above the midline, which indicates a move toward $7 in the short term.
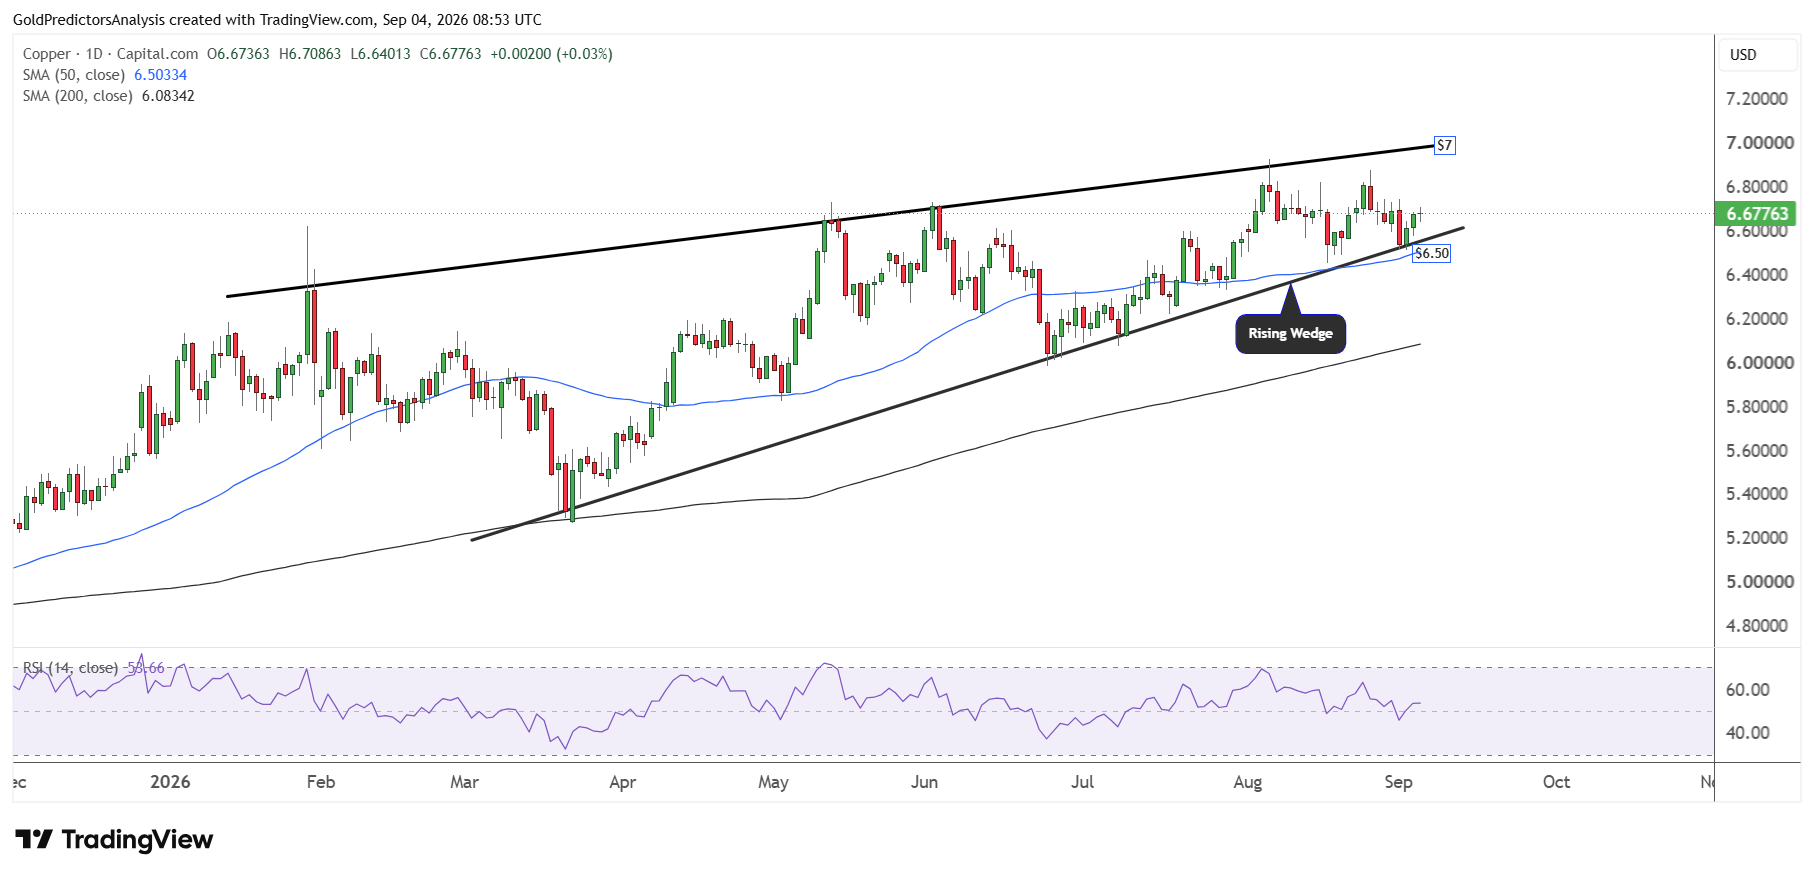
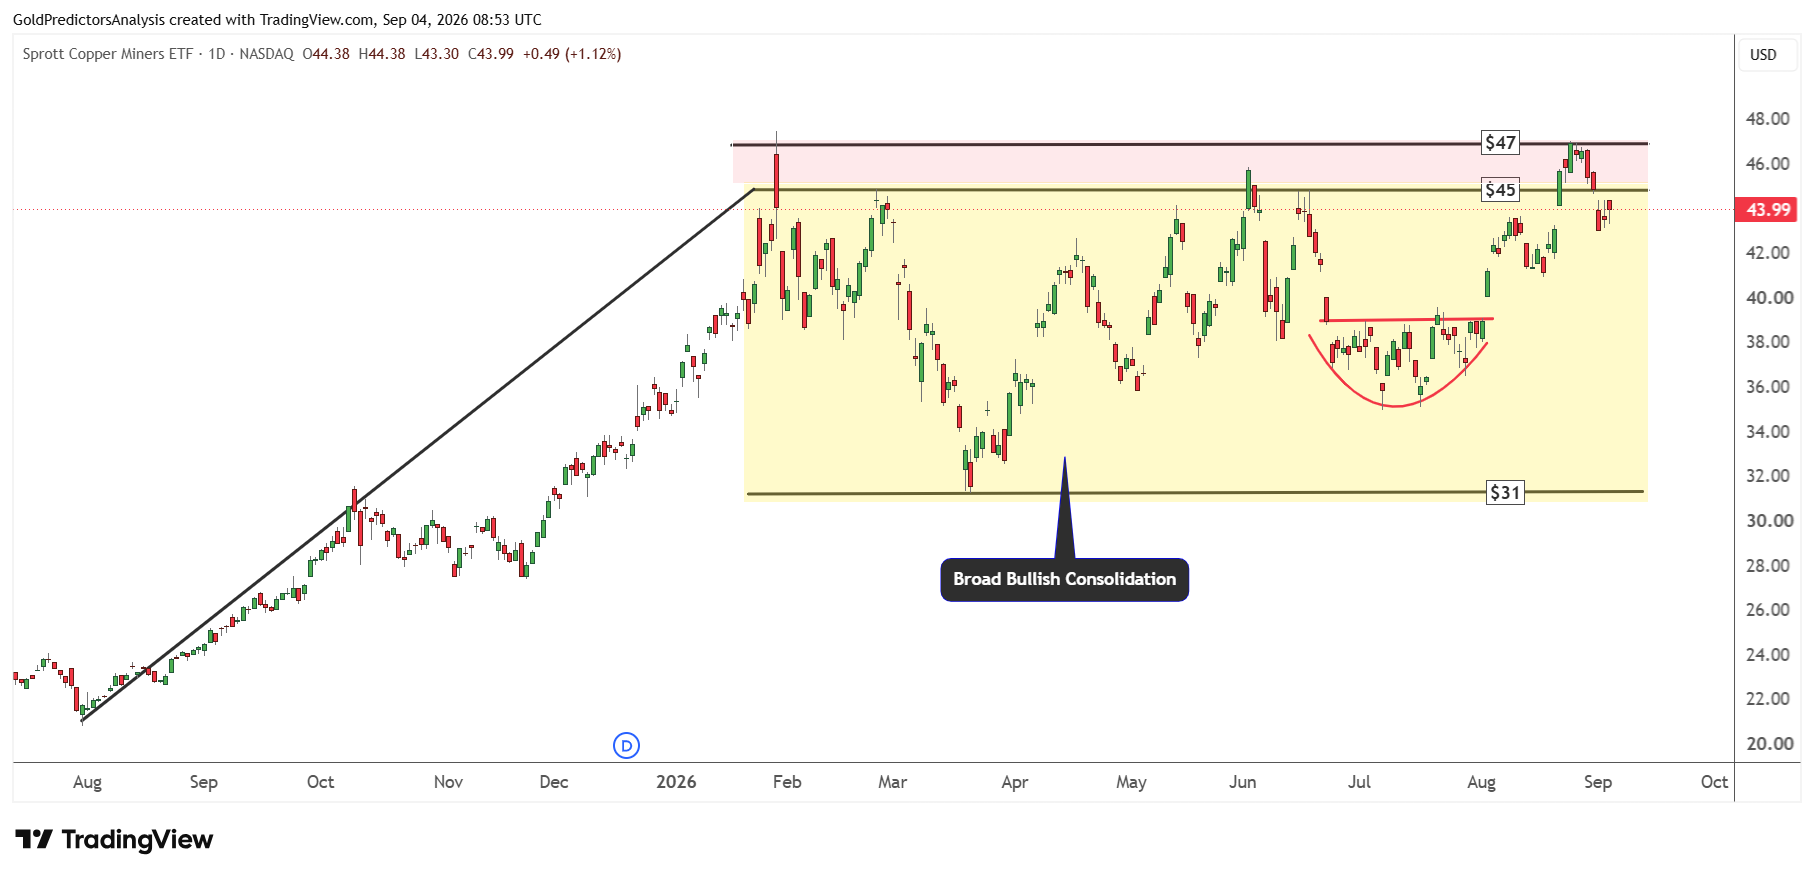
However, the formation of a rising wedge indicates strong consolidation in copper prices in the short term between $6.50 and $7.00. Strong bullish price action in the copper market is also evident in the Sprott Copper Miners ETF. The ETF has broken the $45 area and pushed toward $47. The $47 region remains the critical level for the Sprott Copper Miners ETF. A break above $47 will open the way towards $50. But a break below $40 will push prices towards the $31 region.
Uranium Price Forecast: Bullish Breakouts Target Higher Levels
Uranium ETFs Test Key Breakout Levels
The chart below shows that the Uranium ETFs produced a strong rally in August. The Global X Uranium ETF has rebounded from the strong support at $37 and pushed toward the resistance of the descending trendline that stretches from the January 2026 highs. A break above $53.40 in the ETF will push prices toward the $62 area. But a break below $37 will open the way for further downside towards the $30 area.
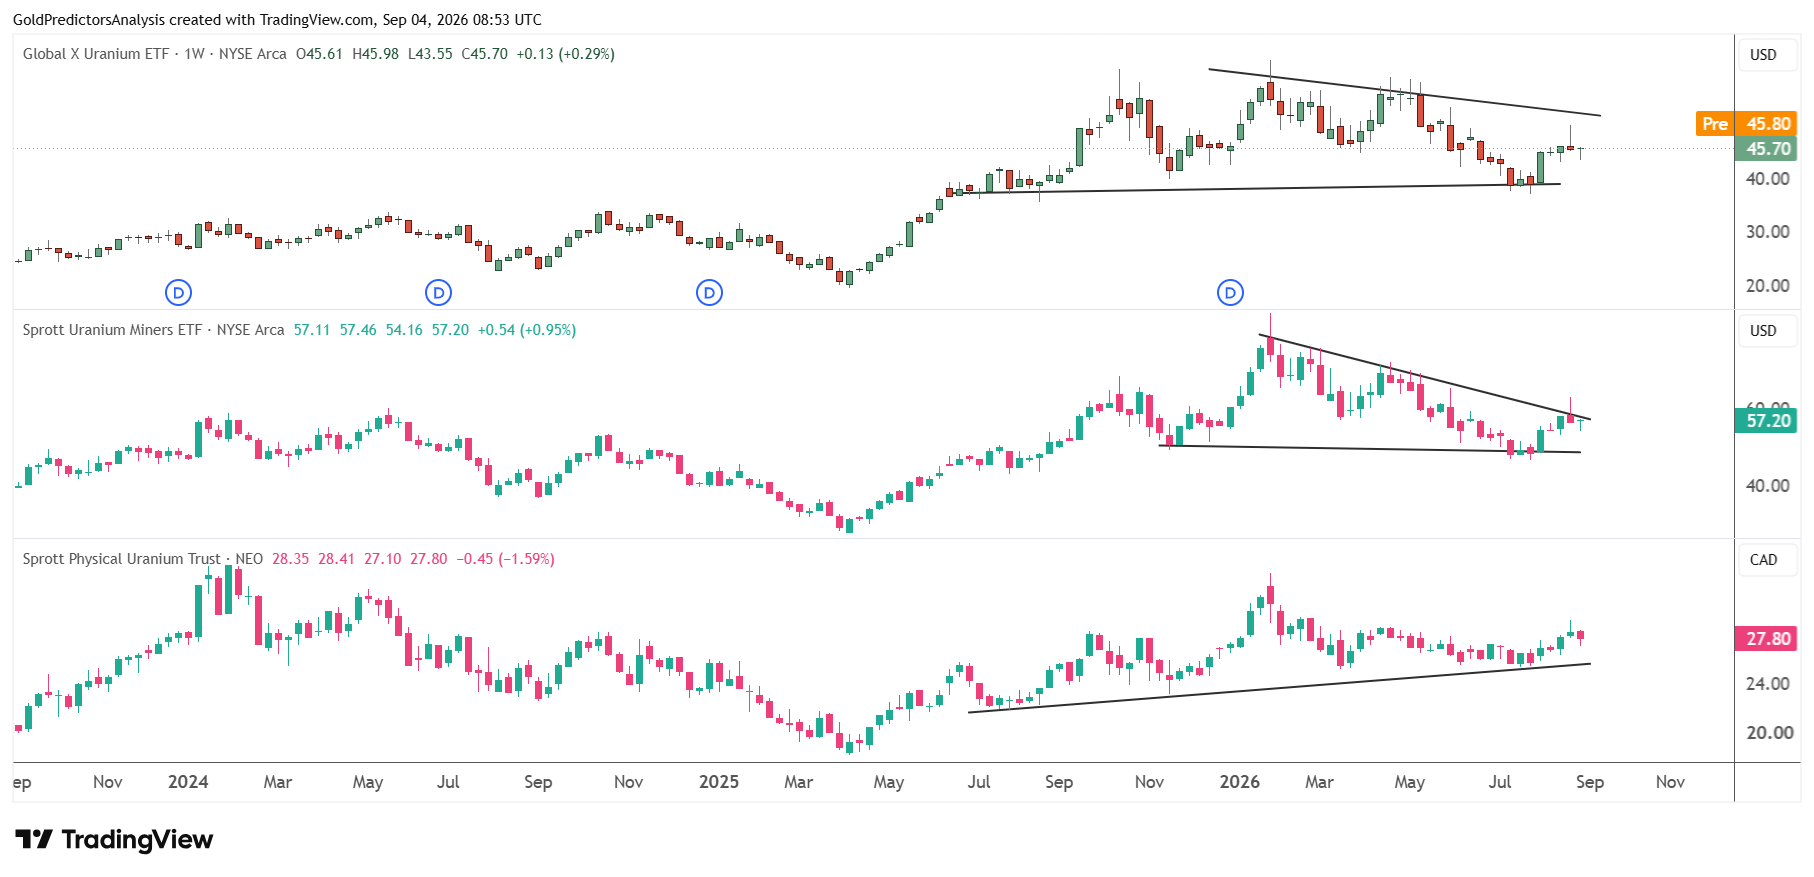
The Sprott Uranium Miners ETF has also faced strong resistance at the descending trendline that stretches from the January 2026 highs. The ETF formed bearish hammer candle during the last week of August. This bearish candle indicates uncertainty in the short term. A break above $62.50 will push the ETF towards the $80 area. But a break below $47 will likely push the ETF towards the $35 area.
The Sprott Physical Uranium Trust has also rebounded from the strong support at $25.50 which has pushed the price toward the immediate resistance at $28.50. A break above $28.50 will likely push it towards the $32 region.
Uranium Equity Basket Forms a Bull Flag
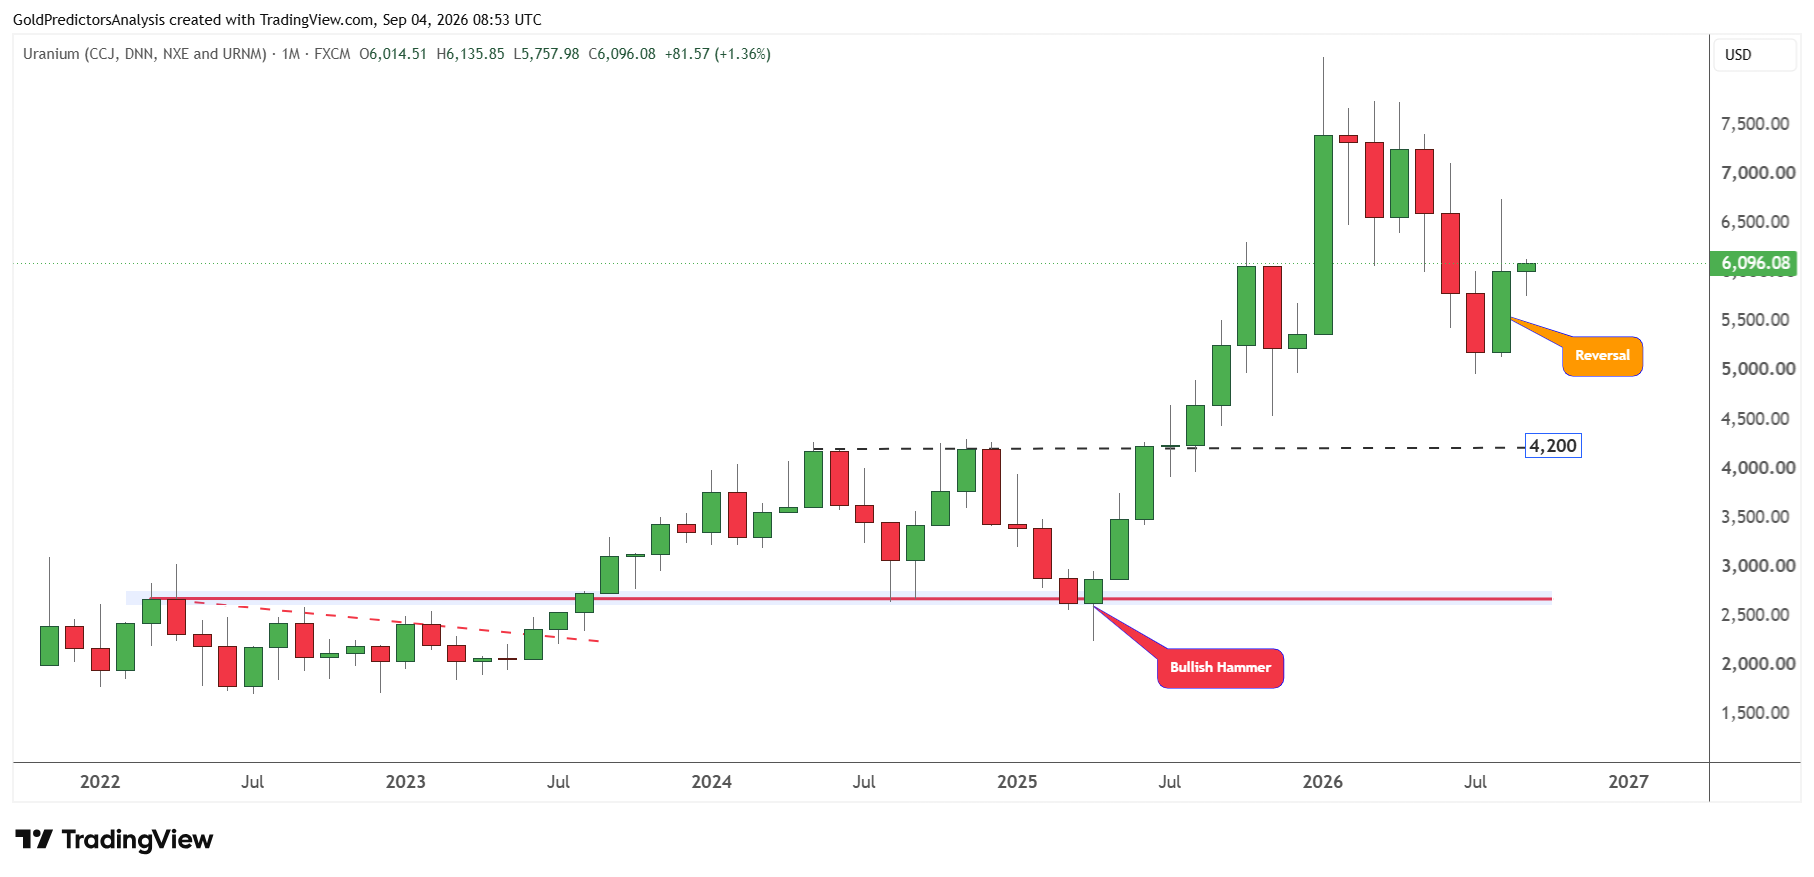
The uranium equity basket also met strong resistance at the 6,700 level and triggered a strong drop towards the next support level. The uranium equity basket is now rebounding from the 5,600 level and moving towards the 6,500 area. The formation of a double bottom pattern above the 5,000 level indicates a strong bullish foundation. A break above 6,700 will confirm a bull flag formation and open the way for a strong move towards the 8,000 level. The bull flag formation suggests that the uranium market is showing strong bullish momentum and will likely remain strong over the next few weeks.
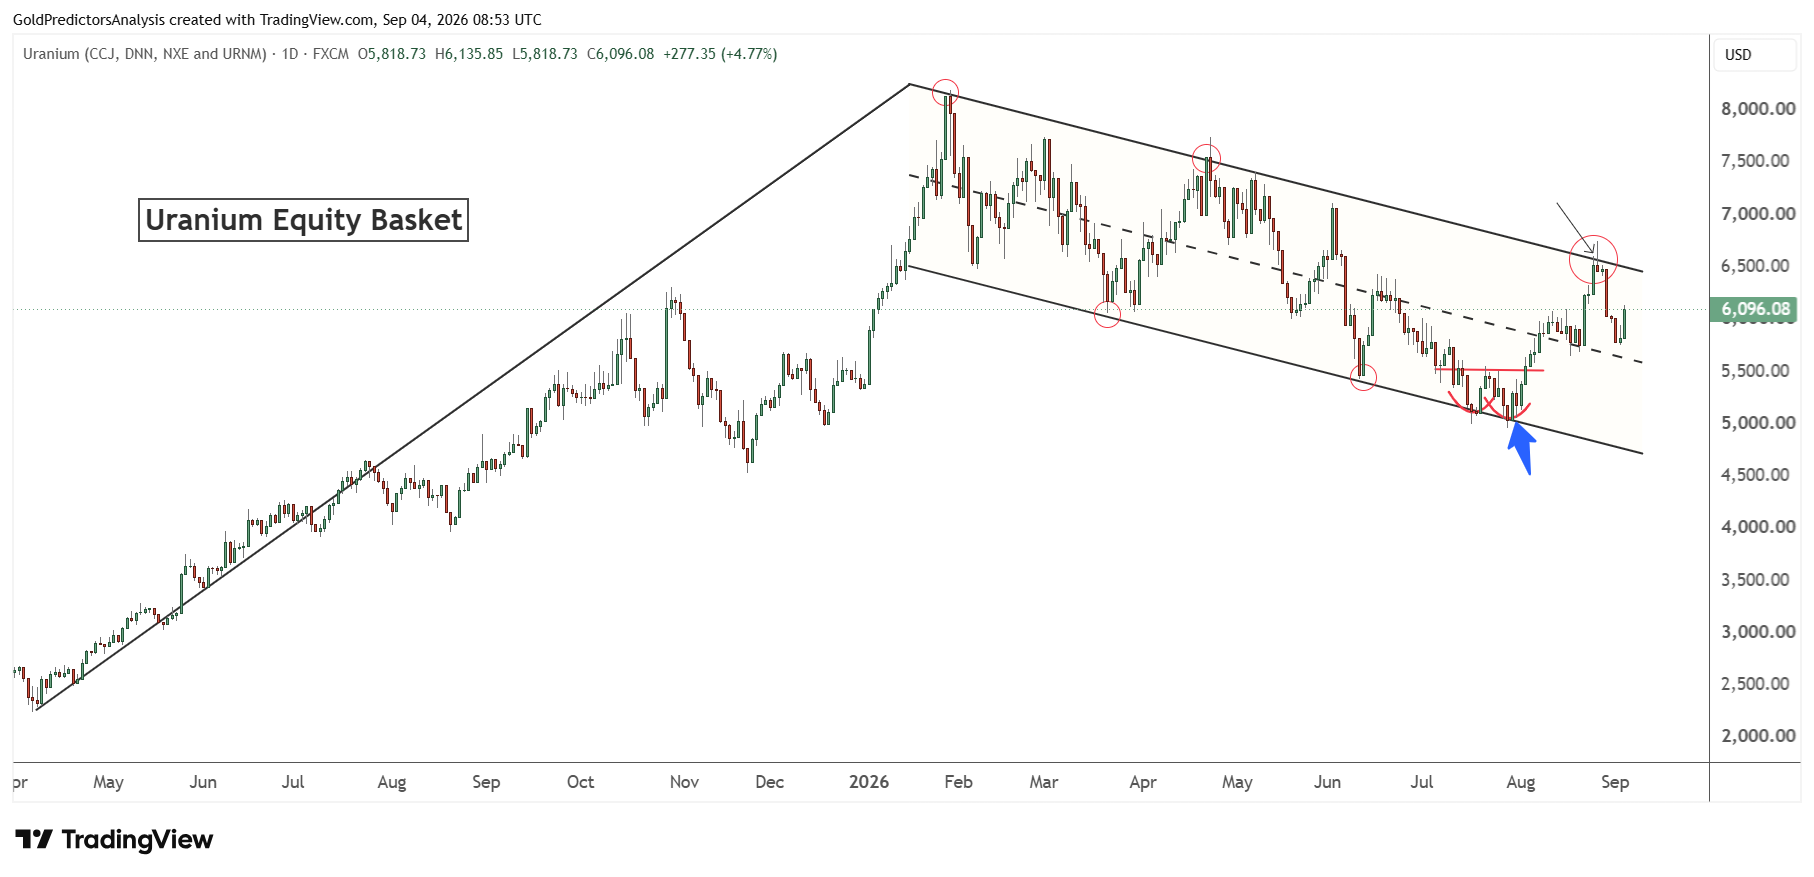
The strength in uranium is also evident on the monthly chart, which shows a strong reversal candle in August 2026. The uranium equity basket gained 16.02% in August which further suggests a positive shift. Uranium prices were strong in 2025 and the positive shift in August suggests that a bottom has formed. In my view, the strong fundamental and technical developments in the uranium market suggest a higher chance of an upside breakout.
Lithium Price Forecast: Rounding Bottom Supports Further Gains
Lithium prices also produced a strong rebound in August after forming a strong bottom in July. This strength is evident in the Sprott Lithium Miners ETF, which formed a bottom at the long term support of $9. The ETF has now rallied above the $12 area and is consolidating to find the next move. As long as the $9 support holds in the Sprott Lithium Miners ETF, prices may push towards the $15 area. But a break below $9 will likely open the way for further downside.
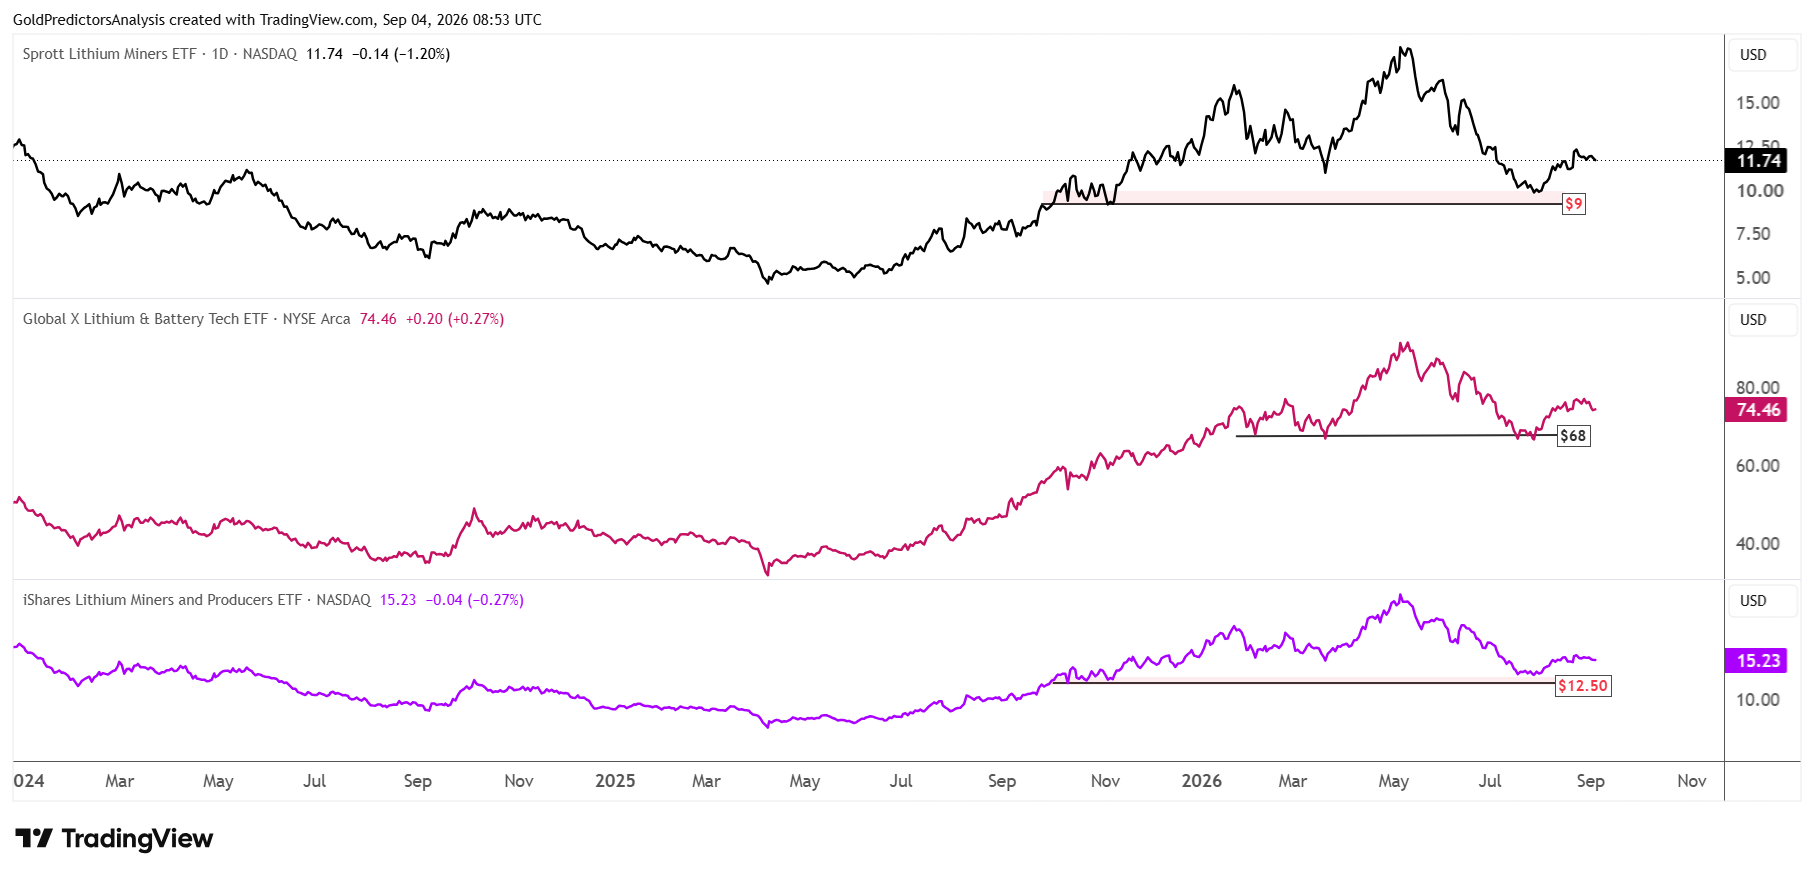
The Global X Lithium & Battery Tech ETF also rebounded from the strong support at the $58 level. This rebound faced strong resistance at the $77 region. A break above this level is required to push the ETF towards the $84 region. As long as the $68 support holds, the possibility of a strong rally toward $85 is higher.
Similarly, the iShares Lithium Miners and Producers ETF also rebounded from the $12.50 support level. Prices are consolidating in tight range in the short term to find the next move. As long as the $12.50 support holds, the possibility of a strong rally towards the $20 level is high.
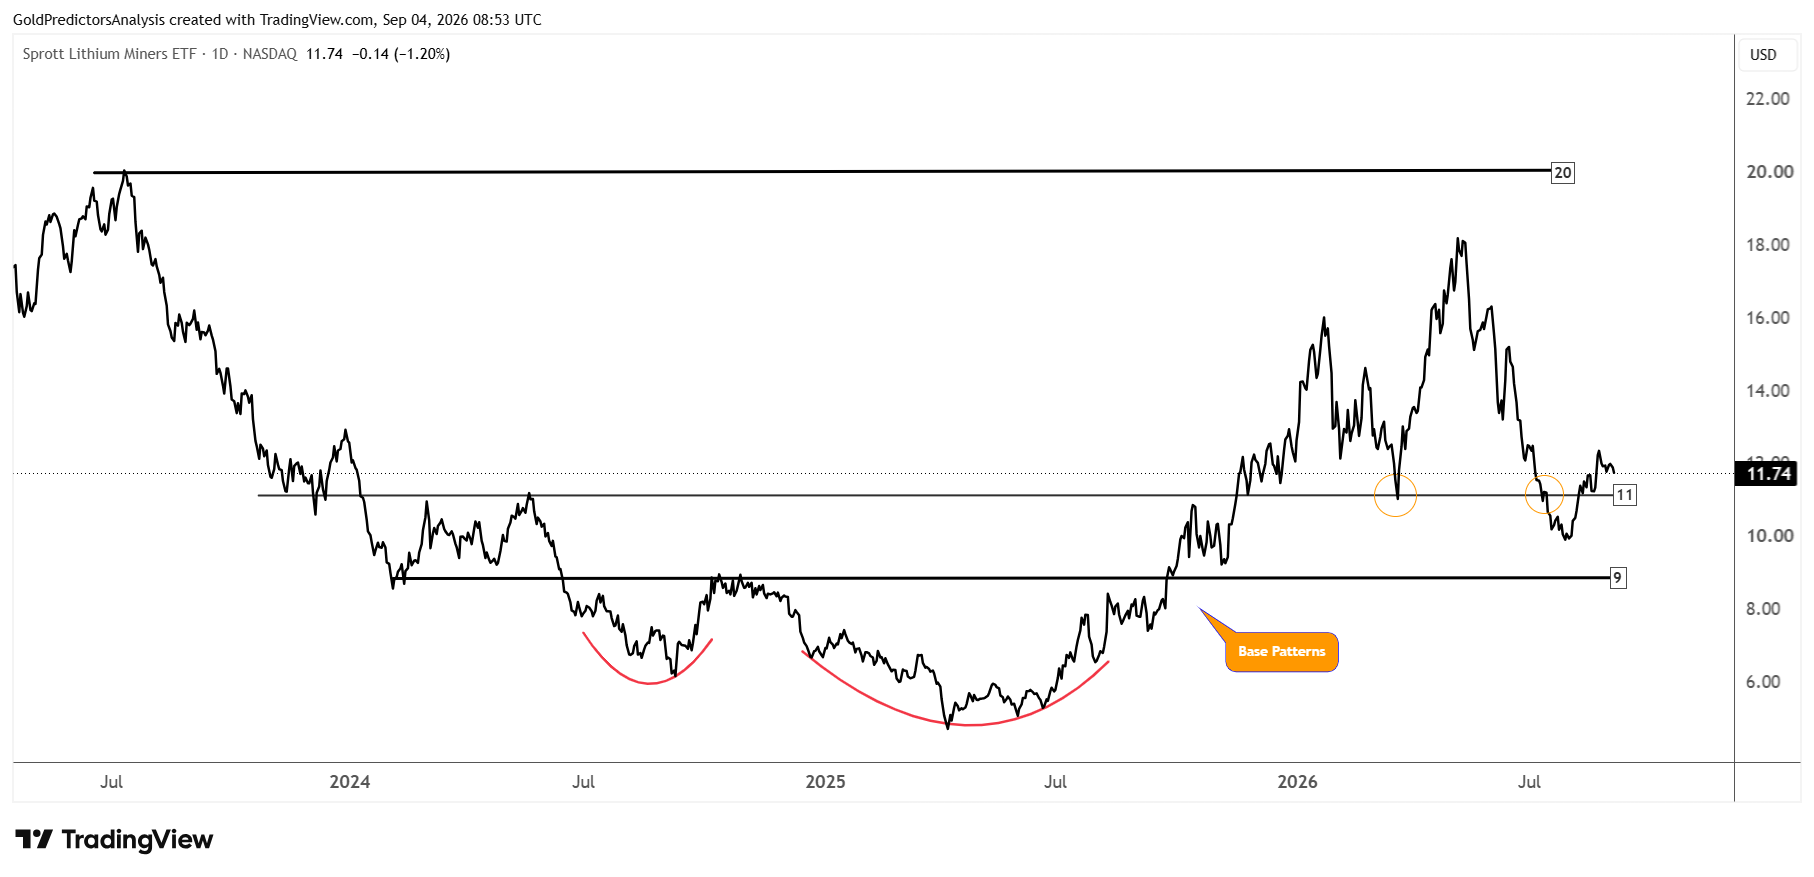
Lithium prices formed a strong positive structure in 2025 as seen by the formation of a rounding bottom pattern in the chart below. Lithium prices corrected in May, June and July to form a low within the $9-$11 support zone. Now the prices are rebounding after forming this support. The immediate support remains at the $11 level. As long as this support holds, the possibility of a strong rally toward the $15 level is high. The formation of rounding bottoms in 2025 suggests a strong rally in the lithium market in 2026.
What to Watch Next for Copper, Uranium and Lithium
Copper, uranium and lithium maintain a positive outlook in the long term, but they may remain volatile in the short term. Factory activity in China is improving, while grid investment, battery storage and nuclear expansion continue to support demand. The supply disruption provides further support. But the U.S. jobs report may influence the next move in the short term as it may affect the dollar and Treasury yields.
The technical outlook also remains constructive. Copper could test $7 if the $6.50 support holds, while uranium is showing signs of bullish reversal after its strong August rally. Lithium has formed several rounding bottoms and is recovering from the long term support. In my view, copper, uranium and lithium remain bullish and confirmed breakouts above their key resistance levels would strengthen the bullish outlook for all three markets.
Read more: Copper Eyes a $7 Breakout