


Gold (XAU) and silver (XAG) prices rebound from the support zones as lower oil prices pull the US Treasury yields. But the short-term bearish pressure on precious metals has not eased. In my view, rising US debt, falling yields and the gold-to-silver ratio continue to support the long-term bull case for both metals. This article presents the key macro drivers, long-term technical structure and gold-to-silver ratio levels that may shape the next move in precious metals.
Treasury Yields and Oil Prices Drive the Gold and Silver Rebound
Inflation is spreading throughout the economy and putting pressure on the Federal Reserve to hike interest rates. When price pressure becomes broader, the Fed may keep rates higher to slow demand. But the bond market is already responding to the drop in oil prices. The chart below shows that the strong drop in WTI oil to $70 has pushed the 10-year US Treasury yields to 4.37%.
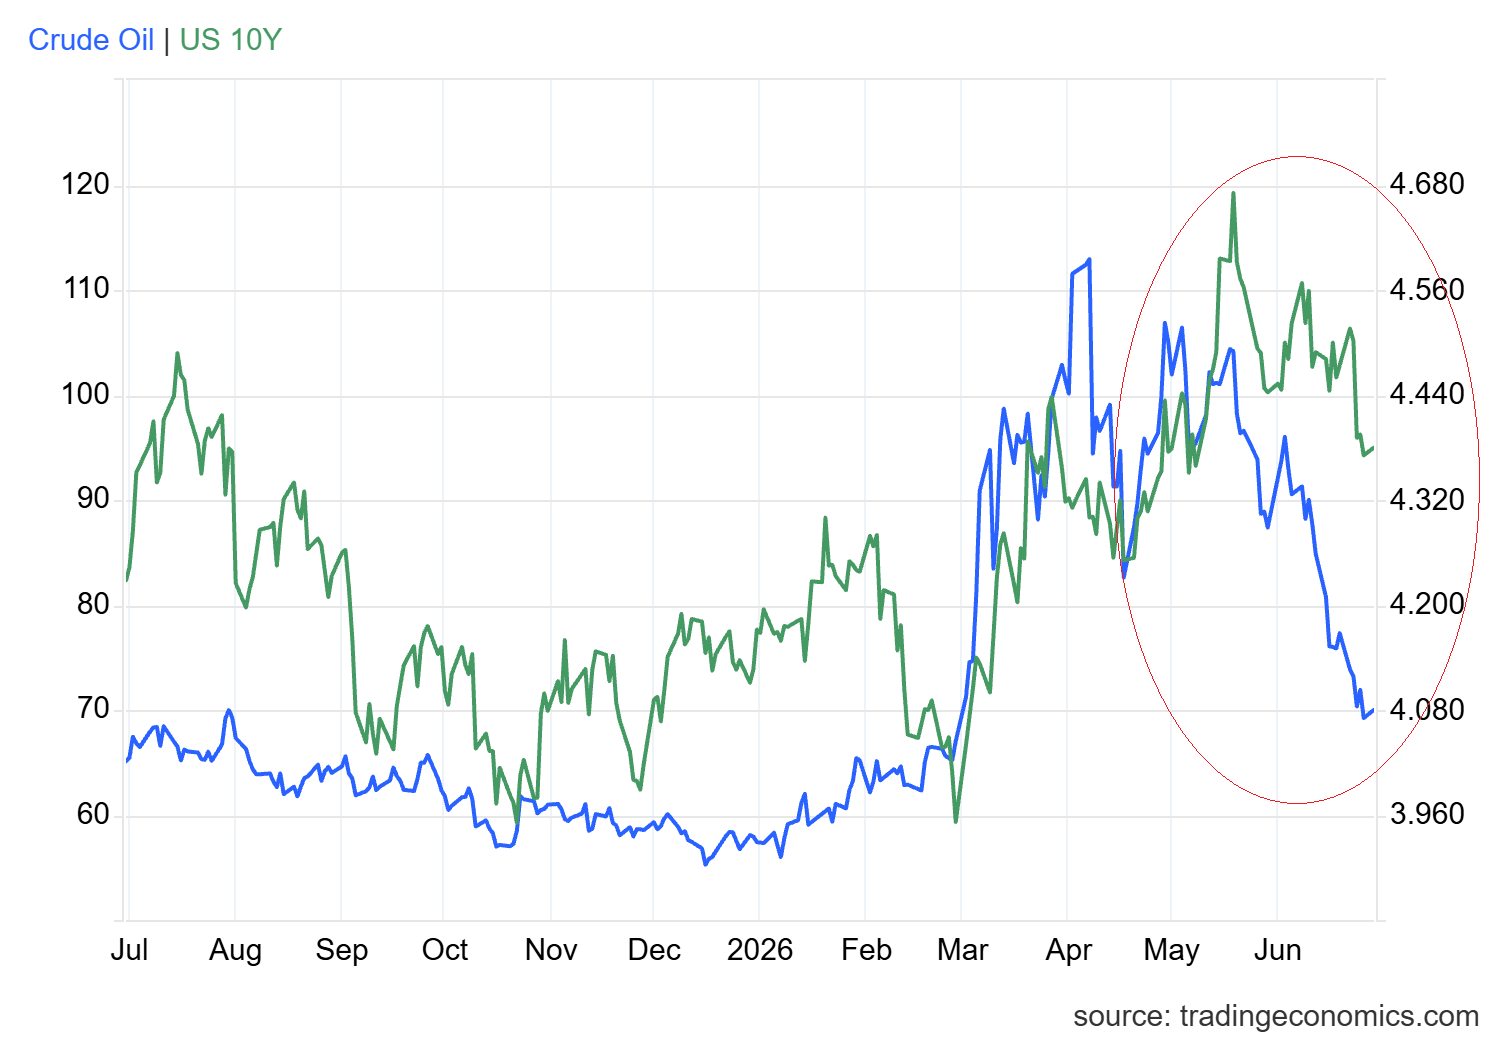
This move has supported the gold rebound from the key support level of $3,950. The broad DJ-UBS Commodity Index has remained under pressure since May 2026 due to the steep rise in the 10-year Treasury yields after the US-Iran war. The expectations of higher interest rates reduced the attractiveness of commodities as investors would gain more from bonds.
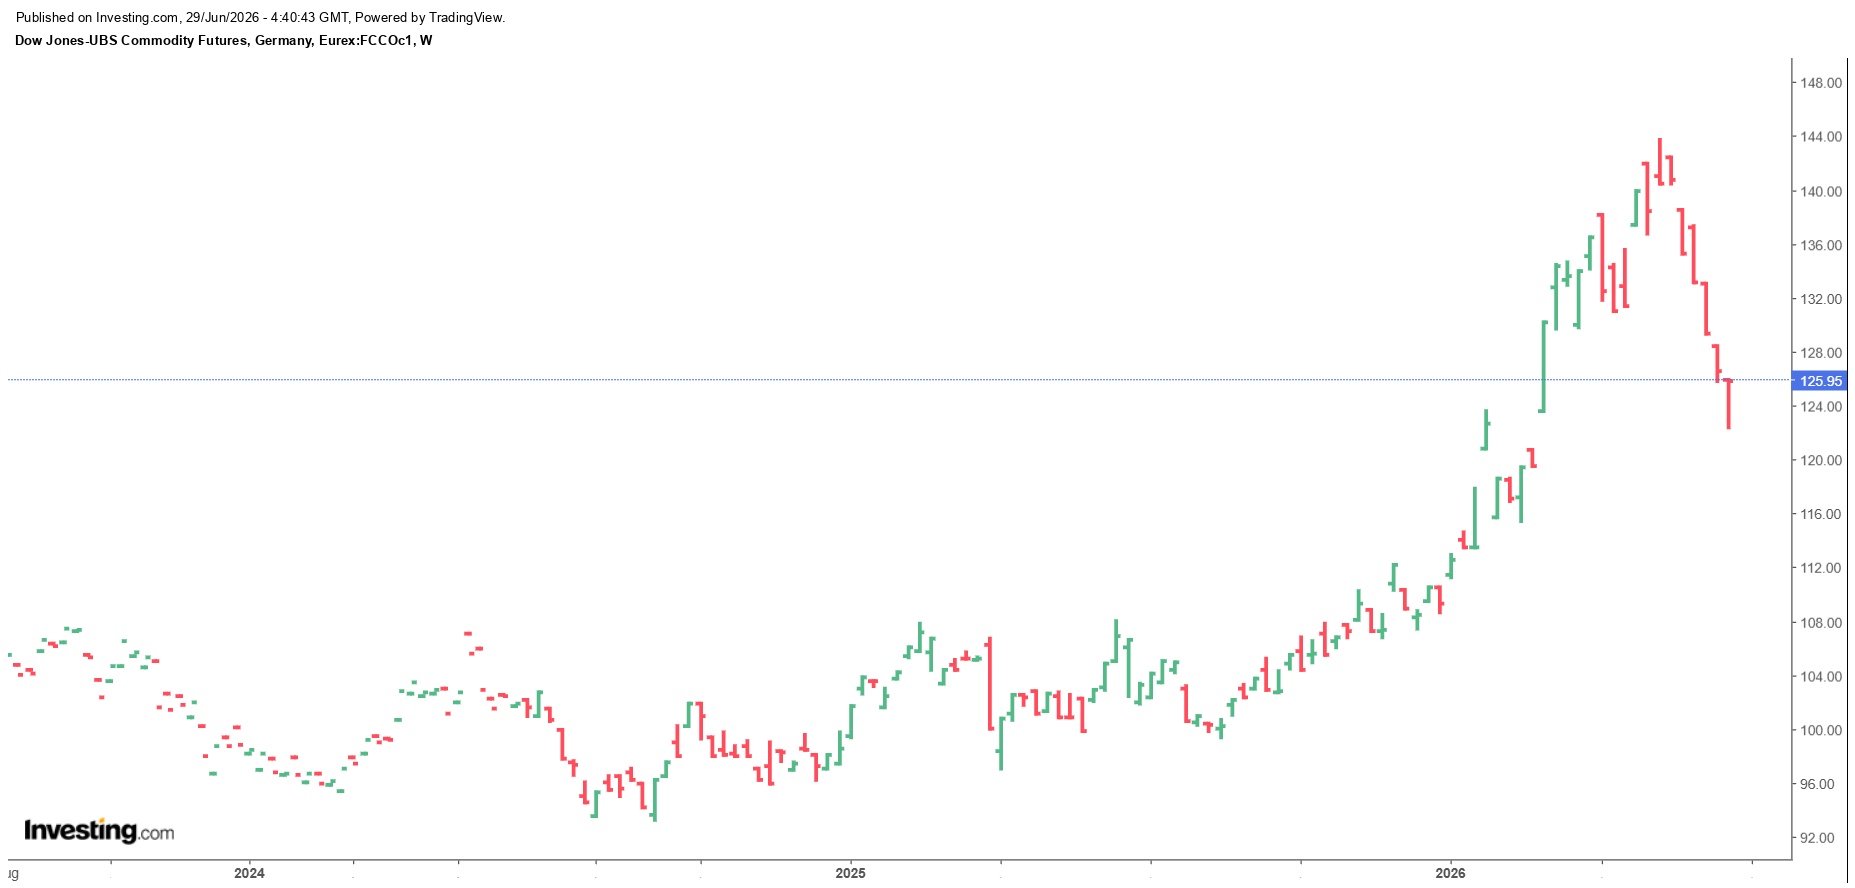
If oil prices remain below $70 for some more time, it will likely ease concerns about inflation and continue to drop the Treasury yields. This may provide relief for commodities and precious metals if crude oil remains low. But the oil outlook remains uncertain as the tensions in the Middle East persist.
Iran’s Revolutionary Guards continue to put pressure on shipping routes. They are doing enough to maintain control of the Strait of Hormuz. This maintains the risk premium for oil. The US is also depleting its Strategic Petroleum Reserve to help reduce the supply gap and maintain low prices. That may help in the short term but it increases the vulnerability of the US if Iran threatens to disrupt the oil passage through the Strait again.
Gold Price Forecast
Every new Gold analysis as it publishes, today's technical signal and key levels, live price — on one page.
See all Gold forecastsRising US Debt Supports the Long-Term Bull Case for Gold and Silver
The recent correction in gold and silver prices from the record levels is due to profit-taking. This correction remains part of a long term commodities uptrend. This uptrend is supported by the debt burden of the United States.
The chart below shows that the federal debt of the United States has increased dramatically as a proportion of GDP, particularly after the financial crisis in 2008 and the recession in 2020. Debt has increased from nearly 35% of GDP prior to 2008 to around 100% post 2020 and remains near that level.
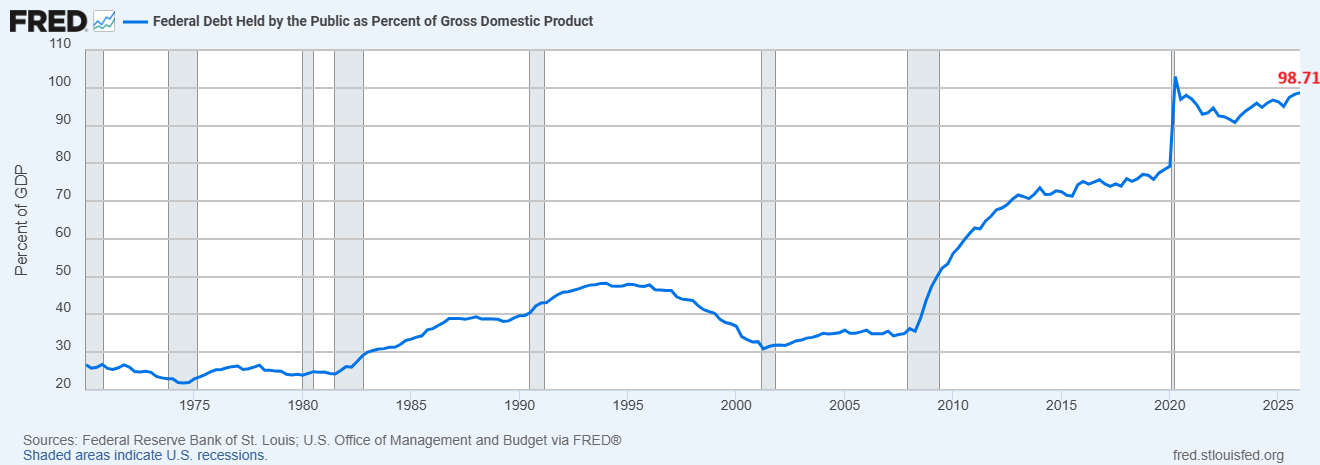
This indicates that the US government has much bigger debt than in previous decades. If a country has a high debt load, it is more difficult for policymakers to maintain interest rates at high level for a longer period as interest costs can rise quickly.
CBO projections show that federal debt held by the public may rise above its post-World War II peak before 2030. This puts pressure on the policymakers to maintain interest rates below the inflation rate for extended periods.
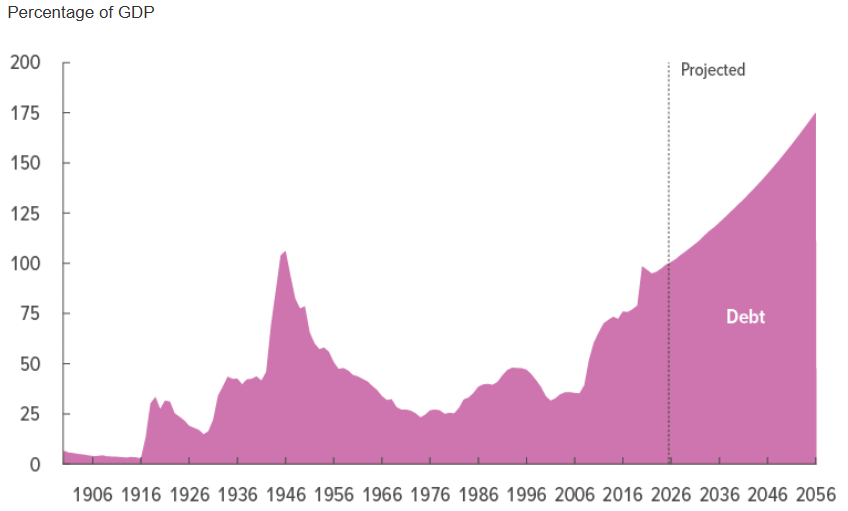
This type of environment can support hard assets. When inflation exceeds the interest rates, the real value of debt decreases over time. This occurred in the 1950’s through the 1970’s. But the current situation is more complicated as the budget deficit is already on the verge of 6% of GDP.
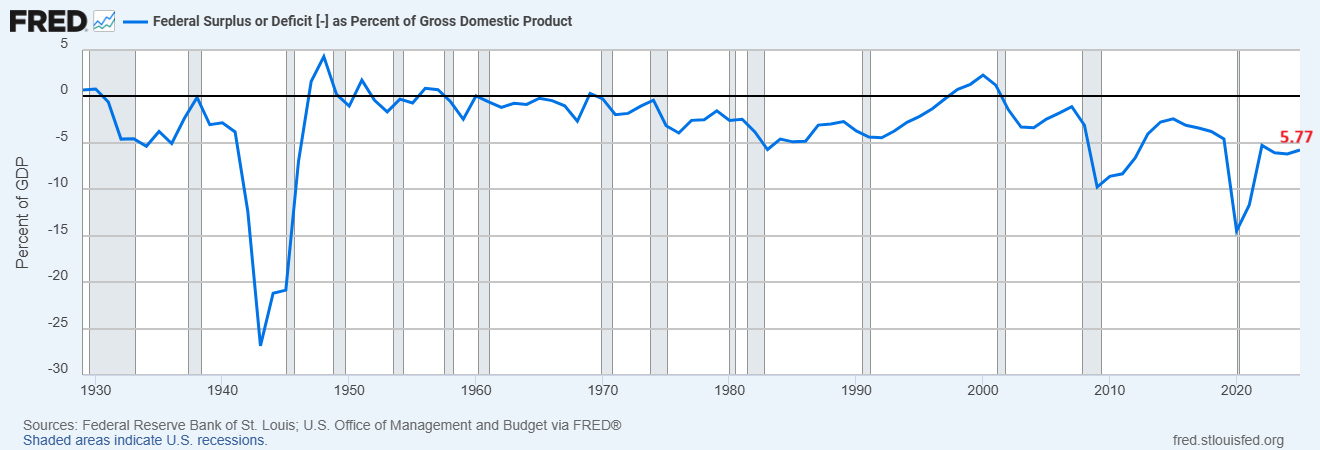
It could spread further as the U.S. spends more on defense and essential supply chains as per the CBO projections.
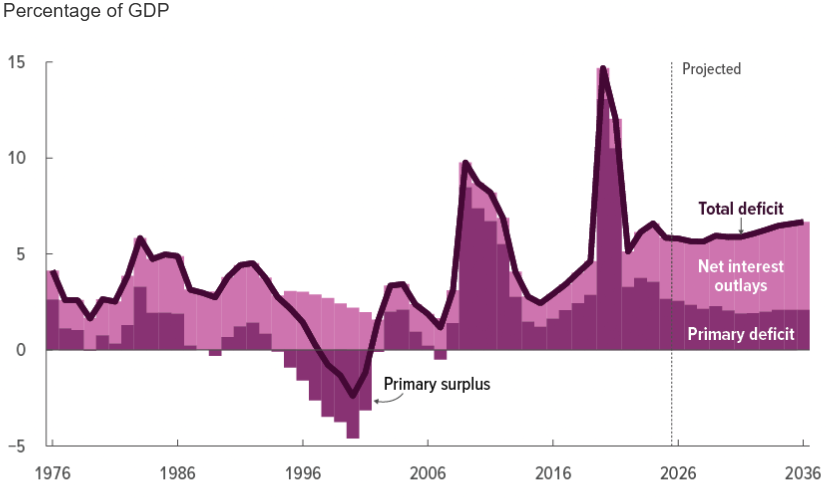
This means that capping interest rates may not be enough to stop the debt burden from rising. This supports the long term view of gold and silver. The short-term trend depends on the yields, the dollar and the price of crude oil. But the upward pressure on debt, persistent deficits and an effort to keep rates low support the long-term bull case for gold and silver.
Gold and Silver Hold Long-Term Breakout Structure
The long-term bullish structure for gold and silver is evident in the chart below. This shows that the gold and silver prices broke the long-term trend line coming from the 1980 highs in 2025. This breakout triggered a strong surge to push the gold and silver prices to $5,600 and $120, respectively.
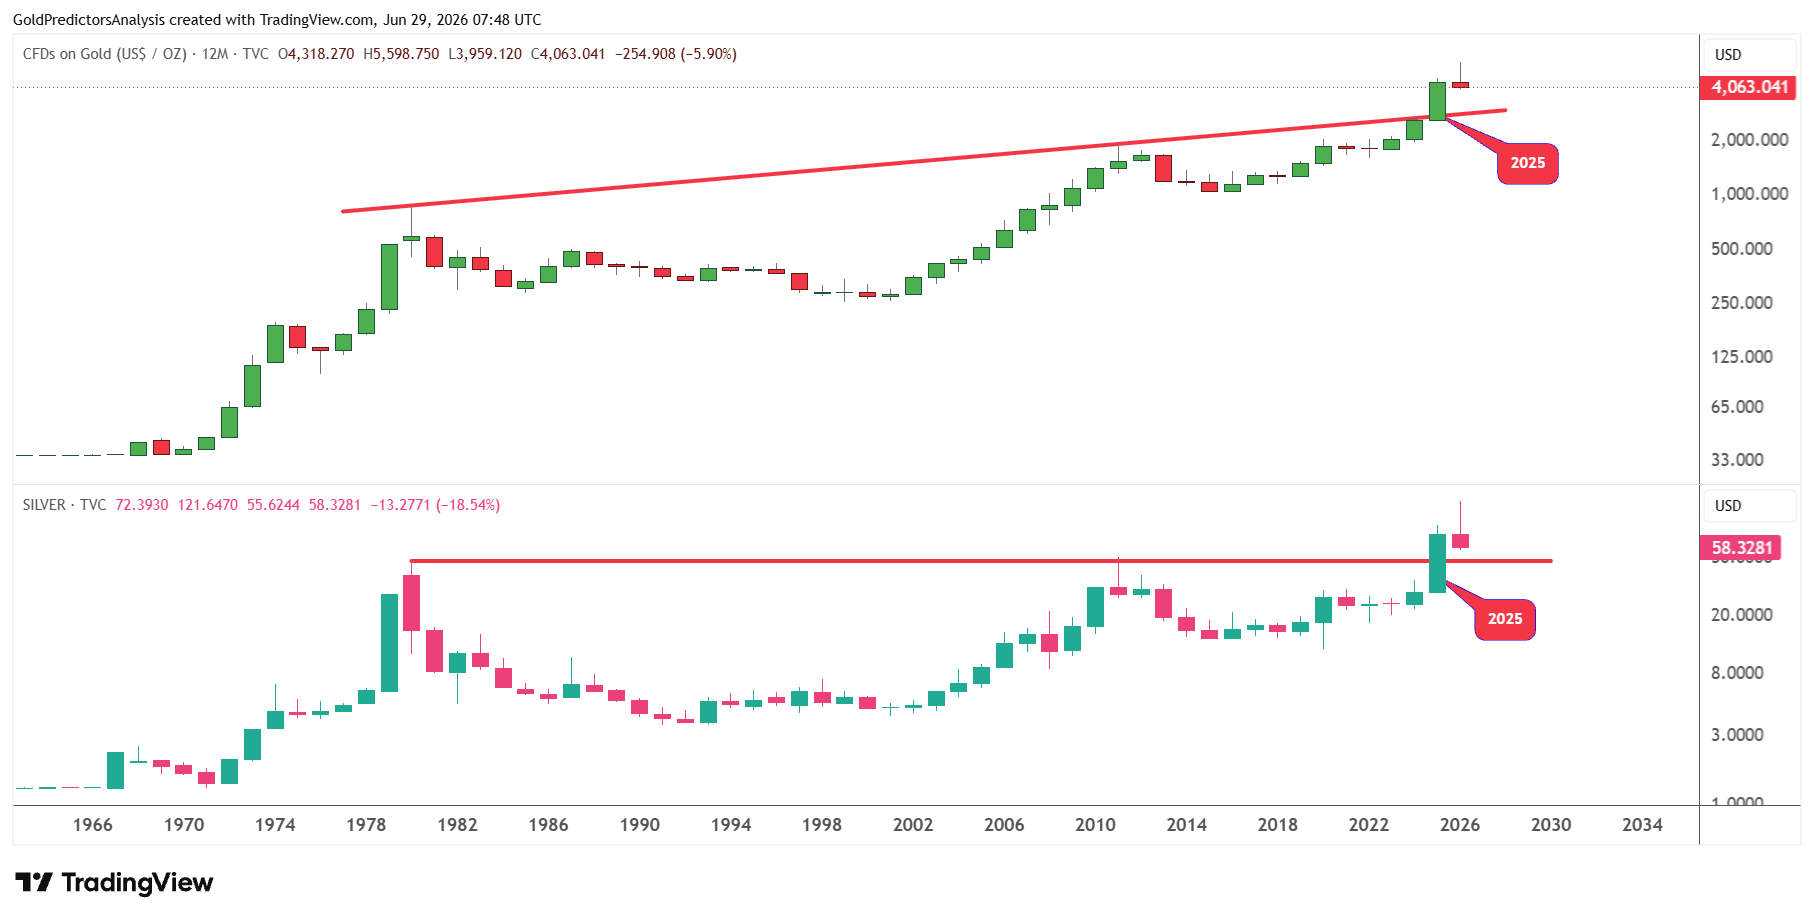
After marking these peaks, prices are retracing back toward the breakout level in 2026. Since this is the first breakout of this long-term trend line, the correction might be healthy. This correction may continue to hit the trend lines before resuming the more robust rally.
But if the yearly candle closes below this trend line in December 2026, it will likely indicate further downside in 2027. However, based on the fundamentals and technical structure, prices will likely form a bottom soon and continue higher.
Silver Holds Stronger Technical Structure than Gold
The silver price shows more constructive price action compared to the gold market as it broke the neckline of the cup and handle pattern. This breakout also aligns with the ascending triangle pattern that was also broken in 2025. This suggests that the gold and silver will likely continue to rally once this correction is completed.
The silver price is poised to produce the first negative quarterly close in Q2 2026. The first negative quarterly candle after five consecutive quarters of growth suggests that there may be a mid-year bottom in 2026. Once this bottom is confirmed, the second half of 2026 can be strong.
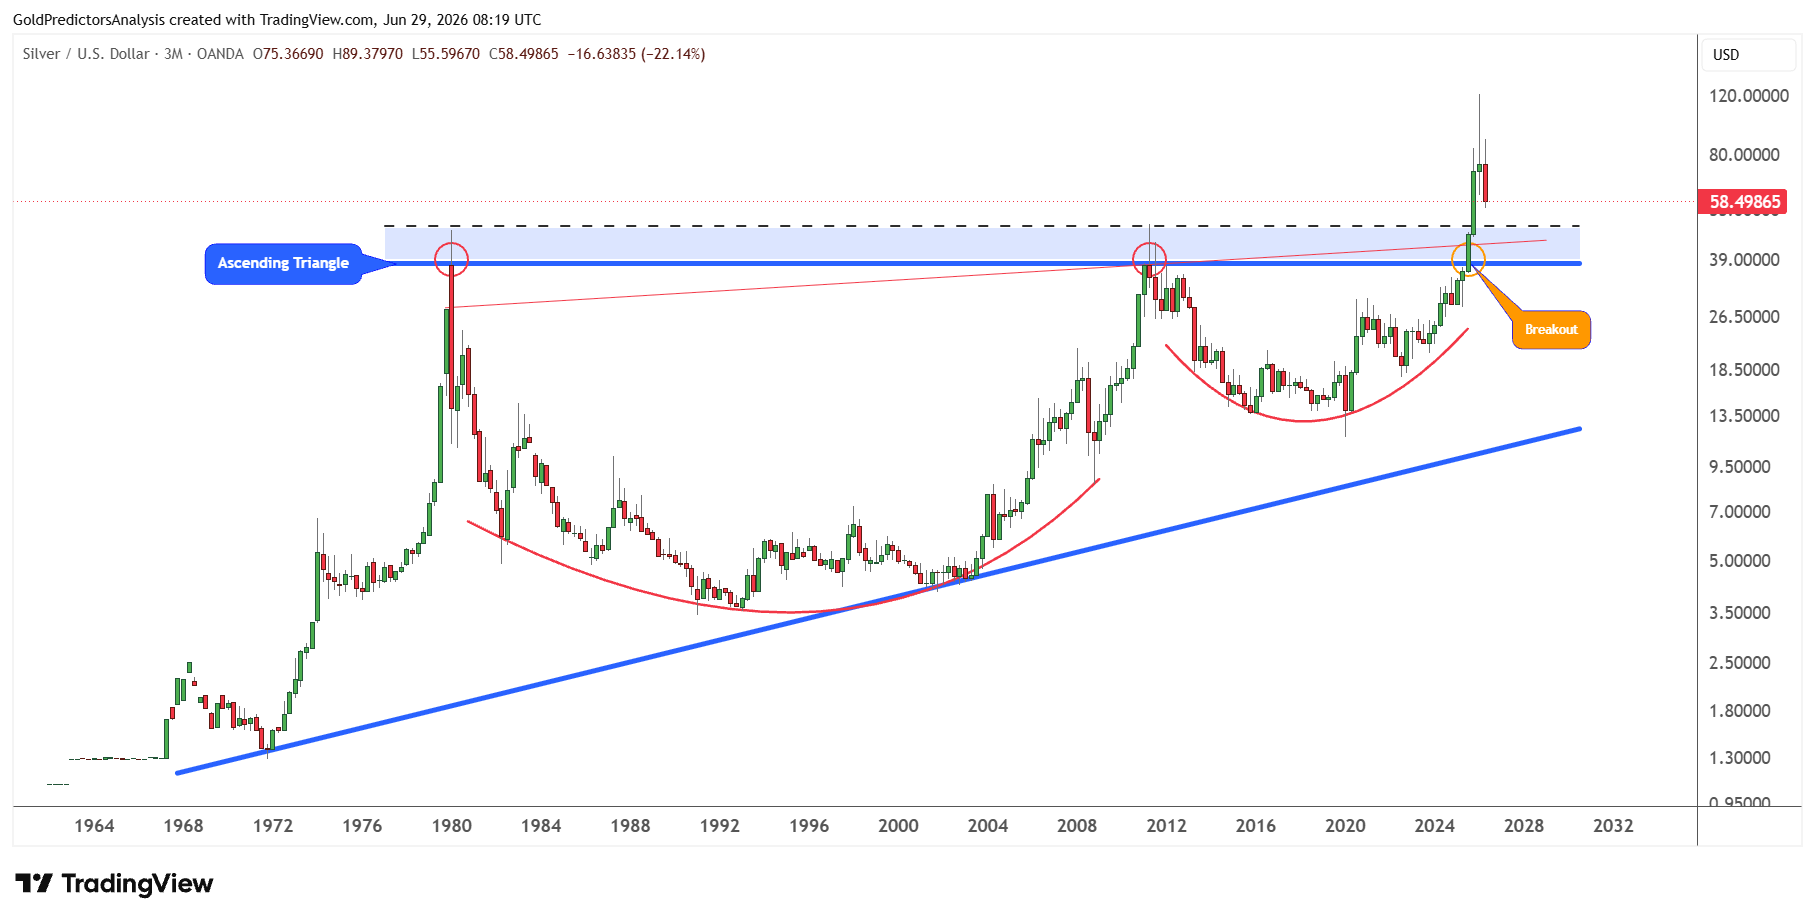
The strong long-term support zone is seen between $35 and $50, as shown by the blue highlighted region. This support region remains highly volatile. Therefore, any drop within this zone may trigger sharp move higher.
Gold-to-Silver Ratio Signals Next Bottom in Precious Metals
The gold-to-silver ratio is rebounding within a strong negative trend. This negative trend in the ratio supports the healthy rally in the gold and silver markets. This happens because silver often outperforms gold during precious metals bull markets, which pushes the ratio lower. When the ratio peaks, gold and silver prices form a bottom and continue to rally.
The chart below shows that peaks in June 2003, October 2008, March 2020 and April 2025 produced strong gold rallies and strong silver bottoms.
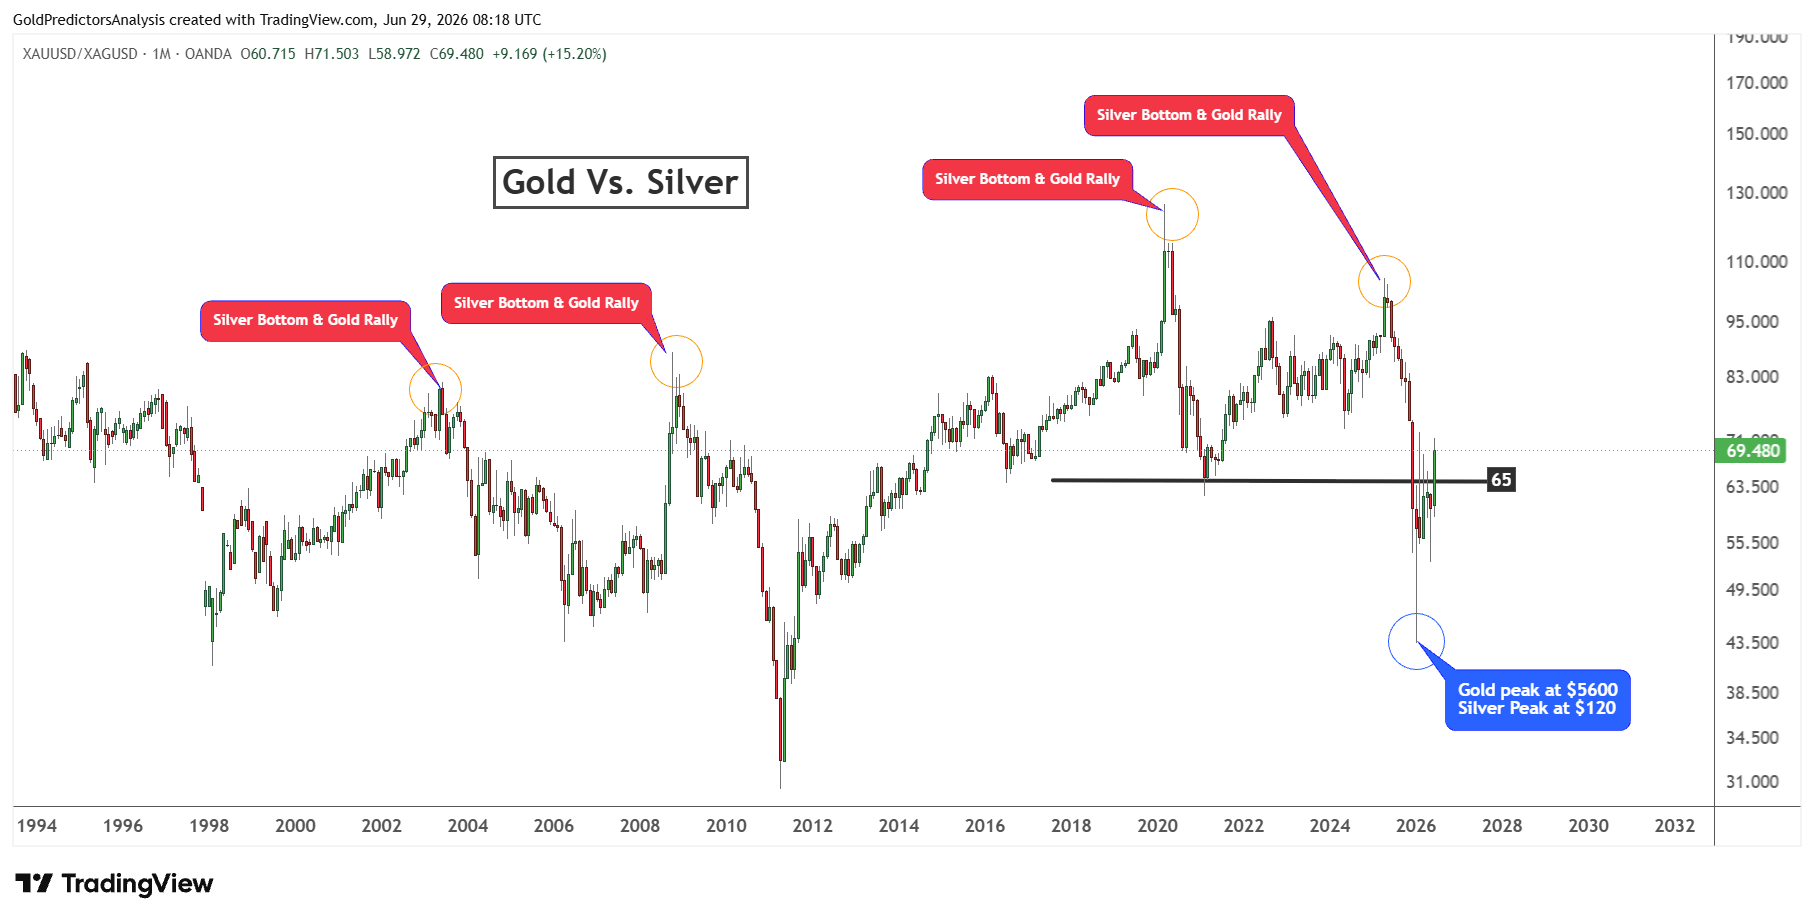
The ratio already hit a low at 43.41 in January 2026, when gold prices peaked at $5,600 and silver peaked at $120. The ratio reversed higher above the 65 level after marking a low.
This reversal in the ratio indicates that gold and silver prices are in correction mode. Therefore, the next bottom in both metals will be confirmed when the gold-to-silver ratio produces another peak and starts to decline.
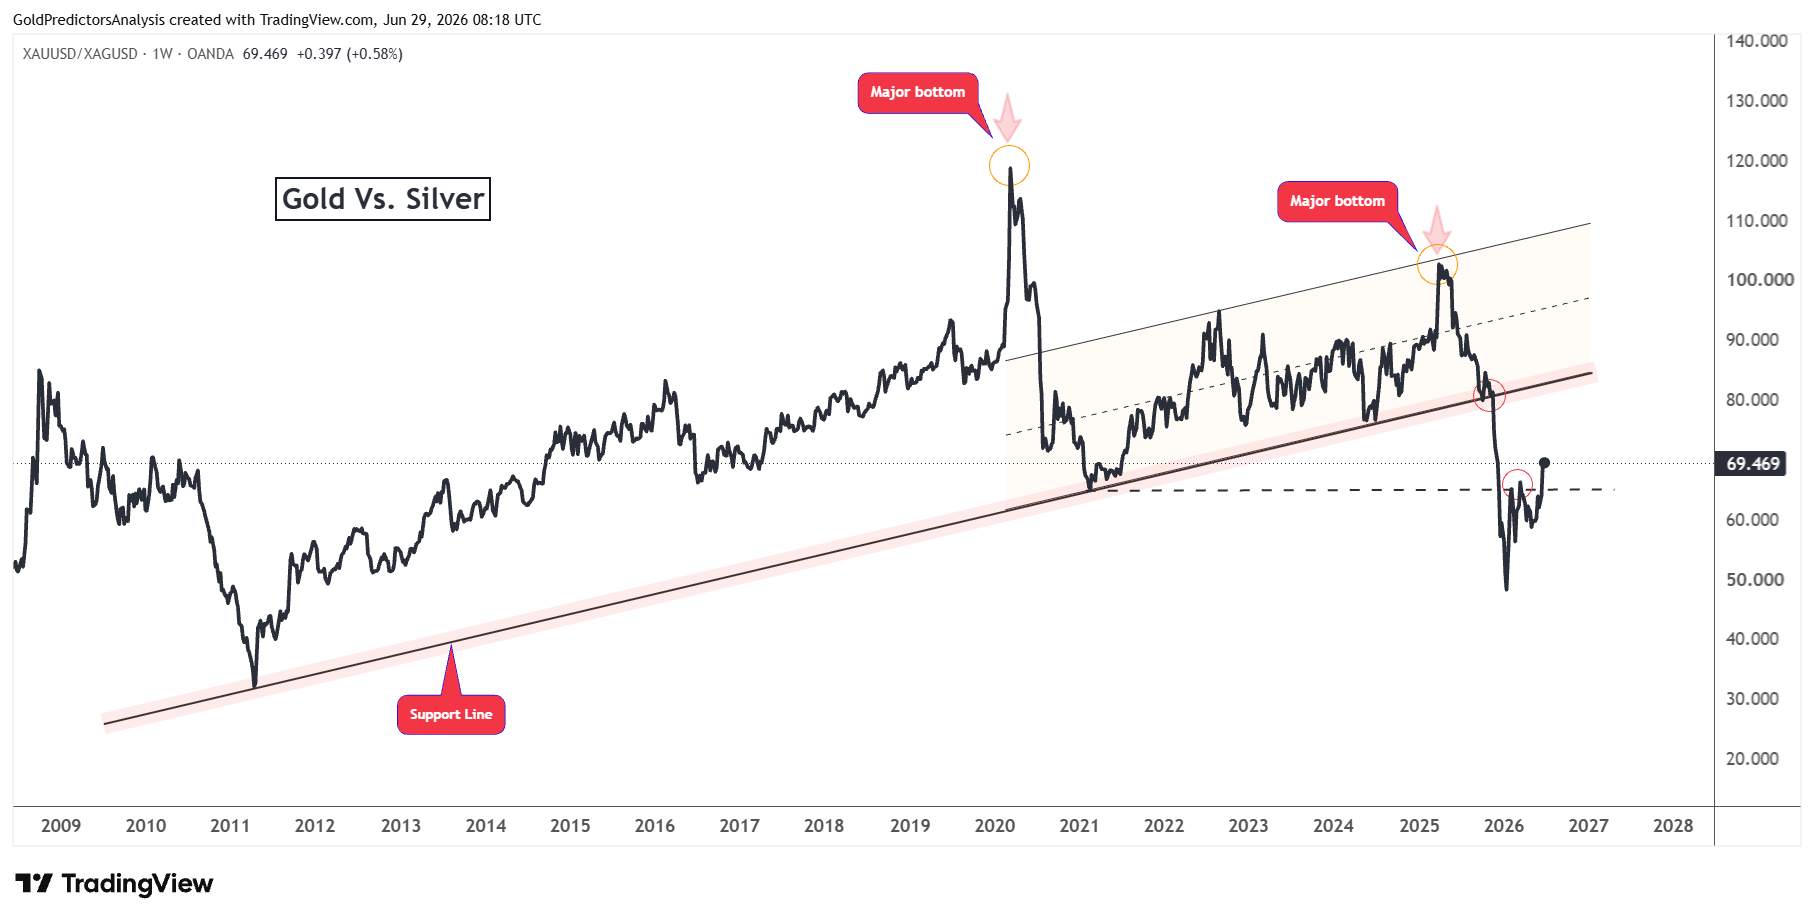
The rally in gold and silver was also supported by the breakout from the ascending channel pattern at the 80 level in the gold-to-silver ratio.
But the ratio is now rebounding higher toward the resistance at 80. When the ratio hits the resistance at the 75-80 range, it may again signal a bottom in gold and silver.
In Closing
Gold and silver remain in a healthy correction after the strong long-term breakout. This correction does not change the long-term story of gold as the US debt continues to increase and policymakers may not be able to maintain high interest rates for longer. It helps to make the case for hard assets in the long run. The gold to silver ratio also indicates that the next bottom may form when the ratio tops out and begins to go down again. While gold and silver maintain the long term breakout zones, the pullback may provide the base for the next strong move higher.
Read more: NFP Data and Iran Talks Drive Next Breakout in Gold and Silver